Printed in Brazil - ©2004 Sociedade Brasileira de Química 0103 - 5053 $6.00+0.00
Article
* e-mail: [email protected]
Evaluation of Air Quality in Volta Redonda, the Main Metallurgical Industrial City in Brazil
Adriana Gioda*,a,b, José A. Salesc, Paulina M. S. Cavalcantic, Marilza F. Maiac, Luiz F. P. G. Maiad and Francisco R. Aquino Netoa
a
Instituto de Química, Centro de Tecnologia, Bloco A, Sala 607, Ilha do Fundão, Universidade Federal do Rio de Janeiro, 21949-900 Rio de Janeiro-RJ, Brazil
b
Departamento de Química, Universidade da Região de Joinville, Campus Universitário s/n, Bom Retiro, 89201-972 Joinville-SC, Brazil
c
DIAAR/FEEMA-Governo do Estado do Rio de Janeiro, Av. Nossa Senhora de Copacabana 493, 6º andar, 22020-000 Rio de Janeiro – RJ, Brazil
d
Departamento de Meteorologia, IGEO-CCMN, Ilha do Fundão, Universidade Federal do Rio de Janeiro, 21949-900 Rio de Janeiro-RJ, Brazil
A maior indústria de aço do Brasil está situada na cidade de Volta Redonda, RJ. A produção de coque neste tipo de indústria é a maior fonte de emissão de compostos aromáticos. Com objetivo de implementar medidas de controle da poluição nas indústrias a FEEMA, agência ambiental do Estado do Rio de Janeiro, avaliou a qualidade do ar naquela cidade em Dec/95-Mai/96 e Abr-Mai/99. Na primeira campanha, material particulado total (MPT), benzeno, tolueno, xilenos (BTX) e dióxido de enxofre (SO2) foram analisados e concentrações médias altas foram encontradas: 102 µg m-3,
70 µg m-3, 23 µg m-3, 2,5 µg m-3 e 186 µg m-3, respectivamente. Após medidas drásticas de controle,
a segunda avaliação (Abr-Mai/99), apresentou valores menores: 102 µg m-3 (TSP); 62 µg m-3
(PM10), 23 µg m
-3 (B), 4 µg m-3 (T), 0,6 µg m-3 (X), 73 µg m-3 (SO
2) além de metais. Esses
resultados, principalmente para benzeno, indicam que o programa de monitoramento deve continuar até atingir a solução final para o problema.
The largest steel plant in Brazil is located in Volta Redonda city, RJ. Coke production in this kind of industry is the major emission source of aromatic compounds. Aiming the implementation of pollution control measures in industries, FEEMA, Rio de Janeiro State environmental agency, evaluated air quality in that city in Dec/95-May/96 and Apr-May/99. In the first campaign, total suspended particles (TSP), benzene, toluene, xylenes (BTX) and sulfur dioxide (SO2) were analyzed and high average concentrations were found 102 µg m-3, 70 µg m-3, 23 µg m-3, 2.5 µg m-3 and
186 µg m-3, respectively. Following drastic control measures, the second evaluation (Apr-May/99)
showed values that dropped to 102 µg m-3 (TSP); 62 µg m-3 (PM
10), 23 µg m
-3 (B), 4 µg m-3 (T),
0.6 µg m-3 (X), 73 µg m-3 (SO
2) besides metals. These results, mainly for benzene, indicate that the
monitoring program must continue until a final solution for this problem is reached.
Keywords: air pollution, BTX, particulate matter, steel industry, outdoor air
Introduction
Volta Redonda, a city in Rio de Janeiro State, grew around the largest steel producing plant in Brazil. It has a current population of 250,000 inhabitants, and is the source of one of the state’s main revenues.1 Its
environmental problems are basically related to air pollution resulting from the type and location of the
region’s industrial activities. The most important source of organic pollutants in the monitored area is coke production at National Steel Company (CSN) (4.6 x 10⁶
Depending on the type of industry, particles, sulfur dioxide and organic compounds constitute the main atmospheric pollutants.1 The concentration, composition and
particle size of suspended particulate matter are determined by such factors as meteorological properties of the atmosphere, topographical influences, emission sources, and particle parameters such as density, shape, and hygroscopicity.2
Particulate matter less or equal to 10 µm in diameter is associated with adverse health effects including increased respiratory problems, mortality and increase of cancer in some urban areas.3 By the same token, the chemical composition
of particles (Polycyclic Aromatic Hydrocarbons (PAHs), metals, acidity) can induce health-related effects.2 Benzene,
toluene and xylenes (BTX) are present in the environment because of emissions from automobiles, petrochemical industry and combustion processes. Due to the toxicity and mutagenic or carcinogenic properties of BTX,4 aromatic
hydrocarbon air pollution is a very important topic for environmental health. Although significant, few are the studies related to atmospheric pollution in Brazil. These researches, most related to the effects of traffic, have been basically carried out in large metropolis such as São Paulo,5,6 Rio de Janeiro,7-11
Porto Alegre,12,13 Salvador14 and in the Amazonian region.15
There are few studies concerning industrial areas.
Aiming to follow the implementation of pollution control measures in industries, FEEMA, the Rio de Janeiro State environmental agency, in partnership with Laboratório de Apoio ao Desenvolvimento Tecnológico (LADETEC/ UFRJ) and Department of Meteorology of Universidade Federal do Rio de Janeiro (IGEO/UFRJ) evaluated air quality in several sampling sites in Volta Redonda. Two evaluations were performed in Dec/95-May/96 and Apr-May/99. The parameters were chosen according to national and international recommendations. The objective of this study was to obtain information regarding air quality in the Municipal District of Volta Redonda, so as to permit the proposal of new pollution control policies, and to increase the population awareness about eventual high pollution levels and environmental degradation. The results can be used in the evaluation of the existing monitoring program and may contribute to the generation of new pollution control strategies to evaluate and restructure the existent network of antipollution devices/procedures.
Experimental
Monitored area
The Municipal District of Volta Redonda is located on the margins of the Paraíba do Sul river, between the Mantiqueira and Mar mountain ranges, parallels 22 22' 11"
and 22 38' of South latitude, and the meridians 44o 09’25"
and 44o 20' of West longitude. Its urban perimeter occupies
an area of 54 km2 corresponding to 0.4% of the total area of
the state of Rio de Janeiro. Its altitude varies widely, from 363 m at Paraibas’s river margins to 707 m (in the northeast tip) above the sea level, while the altitude at the central area is 380.3 m.According to a study published by FEEMA,16 the
climate of Volta Redonda can be classified as mesotermic with a compensated medium temperature of 21 oC. The annual
maximum average is 27.8 oC and the monthly minimum
average is 16.5 oC. The rainy season runs from October to
March, including summer, and it averages 130 days of rain/ year. January and February are the months of larger pluviometric index. The mean relative air humidity is 77%, with August and September as the least humid months.
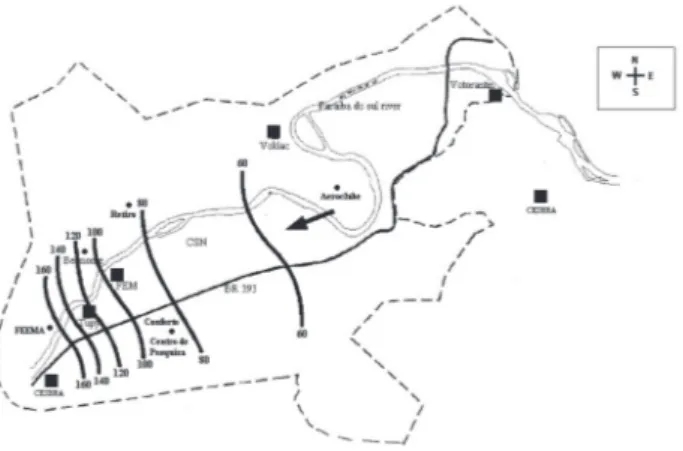
The monitoring was performed in five stations located at strategic places within the Municipal District perimeter. The choice of the sampling points in the monitoring evaluation was based on: first, the representativeness of areas with high population density or intense traffic; second, areas surrounding main pollution sources with the correct predominant wind direction. Using these criteria, four sampling points were selected, leeward (downwind) of the emission sources, while a point to windward (upwind) was chosen as a reference station. They were FEEMA (FE), Belmonte (BE), Retiro (RE), and Centro de Pesquisas stations (CP) to leeward and Aeroclube (AE) to windward (background). These stations are located in Figure 1.1 The
urban area of Volta Redonda is dominated mainly by metallurgic industries such as CSN (National Steel Company), FEM (Plant of Metallic Structures), CESBRA (Tin Company of Brazil), Voldac Casting, and cement
industries like Tupy Cement and Votorantin Cement. These may also be considered as considerable emitting sources.1
In the first evaluation (Dec/95-May/96), Belmonte, Retiro, Centro de Pesquisass and Aeroclube were equipped to measure the concentrations of total suspended particles (TSP) and Benzene, Toluene and Xylenes (BTX). FEEMA was able to measure TSP, BTX, sulphur dioxide (SO2), wind speed and direction. In the second evaluation (Apr-May/ 99), TSP and metals in TPS (FEEMA, Belmonte, Retiro, Aeroclube and Conforto), inhalable particles (PM10) and metals in PM10 (FEEMA, Belmonte and Conforto), BTX (FEEMA and Retiro) and SO2 (FEEMA) were collected and analyzed. Conforto substituted Centro de Pesquisas station.
Total suspended particles (TSP) and inhalable particles (PM10)
TSP was collected using a high-volume air sampler, Hi-Vol (Andersen, Smyrna, GA, USA) fitted with fiberglass filter of 8 x 10 inches, having an air flow of 1.1 to 1.7 m3 min-1 for
a continuous 24 h period. Particulate matter (PM), with a diameter up to 100 µm was retained in the filter. To analyze PM10 a Hi-Vol sampler impactor capable of retaining particles
≤ 10 µm was used. TSP and PM10 concentrations were gravimetrically determined. In the particulate matter, metals concentrations were determined in the second sampling. In the first evaluation (Dec/95-May/96), TSP sampling was effected each 24 h, 45 samples being collected. In the second evaluation (Apr-May/99), it was carried out every two days, corresponding to 10 samples.
Metals
The particles retained in the fiber glass filter (Hi-Vol) were submitted (1/6 of the filter) to a nitric acid 3 mol L-1
(Merck, Darmstadt, Germany) hot digestion. Metals dissolved in the sample were determined by Flame Atomic Absorption Spectrophotometry CG 904 model using hollow cathode lamp to each metal to be analyzed: Cadmium (Cd), Chromium (Cr), Copper (Cu), Iron (Fe), Lead (Pb), Manganese (Mn), Nickel (Ni), Vanadium (V) and Zinc (Zn).17 Blank filters and reagents were analyzed
for each sampling for the determinations of possible contamination. The average metal content of the blanks represent less than 5% of the samples average metal content. Detection limit was 0.04 µg m-3. Metals were
sampled in a total of 11 days.
Benzene, toluene and xylenes (BTX)
Air was pumped (1 to 2 L min-1) through adsorbent
tubes (Supelco ORBO 100, batch 6719, Bellefonte, PA, EUA), which contained two sections of activated charcoal. Mean volume of pumped air was 1.5 m3 24h-1. Solvent
desorption with carbon disulfide (Tedia, Fairifield, OH, USA) was used. 2 µL of samples were injected into a 25 meter capillary column (CARBOWAX 20 M - HP-20M; 25 m x 0.2 mm, film thickness 0.2 µm) attached to a Hewlett-Packard 5890 GC, Series II with flame ionization detector (FID). Split mode 1:100 was used. Temperature of the injector and detector were 250 oC. The temperature of
the column oven was maintained initially at 30 oC for 12
min, then increased at 25 oC per minute to 180 oC. BTX
standard solutions were prepared from high purity standards obtained commercially (Riedel, Phillips and Ecibra). Dilutions were made with CS2 to build a calibration curve with 5 different standard concentrations (13, 26, 52, 104, 208 mg L-1). The samples were injected in
duplicate and blanks and standard solutions in triplicate. Blank values were around 5 mg L-1. Standard deviations
between sample injections were less than 10%. Dectection limit of method was 1 µg m-3. BTX sampling, in the first
evaluation (Dec/95-May/96), was realized continuously, during seven days every month, corresponding to 42 sampling days. In the second one, it was collected every two days, in a total of 11 days. In both evaluations, two samples were collected during 12 hours.
Sulphur dioxide (SO2)
During the campaign an automatic analyzer (Thermo Electron Corporation, Houston, TX, USA) was used continuously to measure the concentrations of sulphur dioxide. The employed methodology was based on fluorescence UV. The measurement of sulphur dioxide was registered every 10, 15 or 20 min and averaged for each hour. SO2 was sampled for 122 days in the first evaluation (Dec/95-May/96) and 16 days in the second one (Apr-May/99). Calibration is made each 24h and annually by the manufacturer.
Meteorological data
Prediction (NCEP) of the United States. In the second monitoring evaluation, the results generated by the meteorological station at CSN were used. The wind regime came from the East, and varied from Northeast to Southeast.1
Results and Discussion
In Brazil, the threshold limit for the majority of compounds in outdoor air is set by Conselho Nacional do Meio Ambiente (CONAMA).18 However, some pollutants
still do not have any established air quality standards. In these cases, international standards (European Environmental Agency-EEA,19 U.S. Environmental
Protection Agency-USEPA20 and World Health Organization
– WHO21) were adopted as reference. Due to the fact that
the sampling period in both campaigns was less than one year, the results will be compared with 24 h standards suggested by the agencies; if not available the annual standard will be used.
Total suspended particles (TSP)
Table 1 presents averages, as well as minimum and maximum values of total suspended particles obtained during both evaluations in Volta Redonda and guideline values. All sampling sites in both evaluations did not exceed the daily limit for TSP according to CONAMA18 (240 µg m-3)
or EEA19 (250 µg m-3). But, FEEMA station presented
maximum concentration higher than the primary 24 h standard established by these agencies in both cases.
FEEMA and Belmonte stations presented the highest concentration averages, while Aeroclube presented the lowest in both evaluations. TSP average spatial distribution shows a clear increase from Northeast to Southwest (Figure 1). The isolines in Figure 1 refer to distribution of TSP concentrations in Volta Redonda according to wind direction. It can be stated that the gradient of TSP concentration is lower windward to CSN than leeward. The handling of iron ores and the burning of coal at CSN plant can origin the plume of pollution that reach FEEMA and Belmonte stations (leeward) but not reach Aeroclube (windward to CSN). Votorantin cement, which emits particulate matter in its process, seems not to influence TSP levels in Aeroclube station. Perhaps, the distance between station and plant is big enough to disperse or settle the particles. Low levels of TSP in this station were observed in both campaigns. But, Tupy cement can have some influence in PM mainly in FEEMA station due to their proximity. The highest levels (average and maximum) of TSP detected in both campaigns suggested this influence.
The average concentrations found for TSP in Volta Redonda (54-163 µg m-3) are lower than the average
concentration found in polluted areas in Rio de Janeiro (68-198 µg m-3) according to FEEMA.1 In another research,
Azevedo et al.9 found 27 to 348 µg m-3 TSP in industrial
and heavy traffic areas in Rio de Janeiro. Dos Santos et al.11 measured concentrations within 110-399 µg m-3 of
TSP near the crop burning region in Campos dos Goytacazes, RJ, Brazil. In other cities (Table 2) average concentrations were 56-113 µg m-3, i. e., lower than Volta
Redonda.
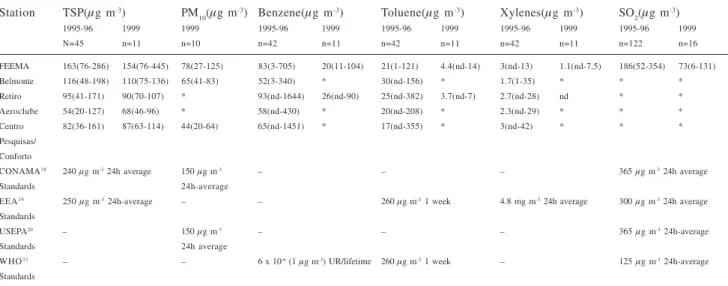
Table 1. Average (range in parenthesis) concentrations of TSP, PM10, BTX and SO2 during sampling period (Dec/95-May/96 and Apr-May/99) in Volta Redonda city and guideline limits for these compounds suggested by national and international agencies
Station TSP(µg m-3) PM
10(µg m
-3) Benzene(µg m-3) Toluene(µg m-3) Xylenes(µg m-3) SO 2(µg m
-3)
1995-96 1999 1999 1995-96 1999 1995-96 1999 1995-96 1999 1995-96 1999
N=45 n=11 n=10 n=42 n=11 n=42 n=11 n=42 n=11 n=122 n=16
FEEMA 163(76-286) 154(76-445) 78(27-125) 83(3-705) 20(11-104) 21(1-121) 4.4(nd-14) 3(nd-13) 1.1(nd-7.5) 186(52-354) 73(6-131)
Belmonte 116(48-198) 110(75-136) 65(41-83) 52(3-340) * 30(nd-156) * 1.7(1-35) * * *
Retiro 95(41-171) 90(70-107) * 93(nd-1644) 26(nd-90) 25(nd-382) 3.7(nd-7) 2.7(nd-28) nd * *
Aeroclube 54(20-127) 68(46-96) * 58(nd-430) * 20(nd-208) * 2.3(nd-29) * * *
Centro 82(36-161) 87(63-114) 44(20-64) 65(nd-1451) * 17(nd-355) * 3(nd-42) * * *
Pesquisas/ Conforto
CONAMA18 240 µg m-3 24h average 150 µg m-3 – – – 365 µg m-3 24h average
Standards 24h-average
EEA19 250 µg m-3 24h-average – – 260 µg m-3 1 week 4.8 mg m-3 24h average 300 µg m-3 24h average
Standards
USEPA20 – 150 µg m-3 – – – 365 µg m-3 24h-average
Standards 24h average
WHO21 – – 6 x 10⁻⁶ (1 µg m-3) UR/lifetime 260 µg m-3 1 week – 125 µg m-3 24h-average
Standards
Inhalable particles (PM10)
Inhalable particle concentrations were measured only in the second evaluation (Apr-May/99). Table 1 shows average, minimum and maximum concentrations of inhalable particles obtained for each monitoring station during the second campaign and suggested limits. The average concentrations for all stations do not exceed the national and international daily limits (150 µg m-3).
Conforto registered the lowest concentrations that may probably be explained by the wind regime and the location of sampling sites. This fact confirms the results found for TSP. The ratio of PM10/TSP was greater than 0.5 for all points, highlighting the relevance of the PM10 contribution to the TSP, that is, more than 50% correspond to PM10. In downtown Rio de Janeiro, average values within 57-100 µg m-3 PM
10 were detected, i.e., similar to the
average values found in Volta Redonda (44-78 µg m-3).1
According to Table 2, the concentrations found in other cities (24-96 µg m-3) are also similar.
Metals
Table 2 shows the concentrations of airborne trace metals at each station and international standard limits besides concentrations obtained in other cities. Zinc and iron presented the highest concentrations. Zinc concen-tration ranged from 2.5 to 7.0 µg m-3 in TSP and 0.006 to
4.3 µg m-3 in PM
10, corresponding to 3-5% and 5-10% of
metal concentration, respectively. Iron concentration ranged from 2.1 to 5.2 µg m-3 in TSP and 1.4 to 3.7 µg m-3
in PM10, representing 2-5% and 3-6% of metal concen-tration, respectively. Chromium and vanadium concentra-tions were below the detection limit. Lead concentraconcentra-tions did not exceed the daily standard established by EEA19
(3 µg m-3) and USEPA20 (1.5 µg m-3 quarterly average). For
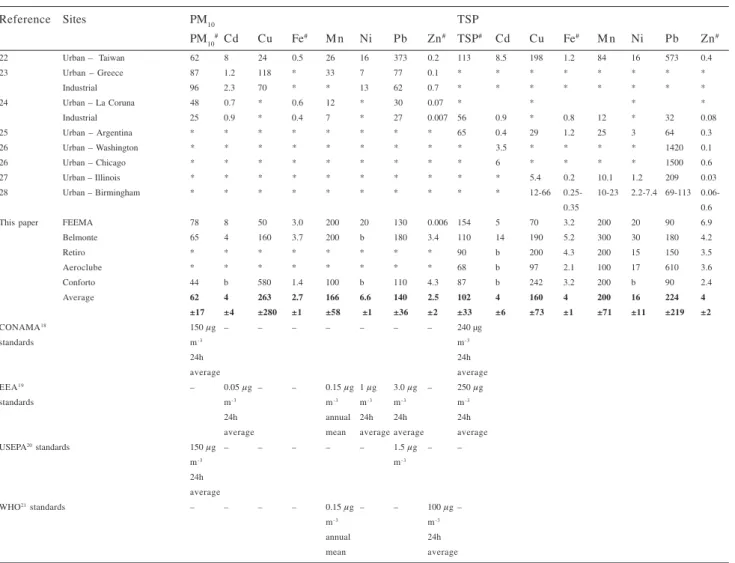
Table 2. Heavy metals found in particulate matter in Volta Redonda and other cities and guideline values
Reference Sites PM10 TSP
PM10#Cd Cu Fe# M n Ni Pb Zn# TSP# Cd Cu Fe# M n Ni Pb Zn#
22 Urban – Taiwan 62 8 24 0.5 26 16 373 0.2 113 8.5 198 1.2 84 16 573 0.4
23 Urban – Greece 87 1.2 118 * 33 7 77 0.1 * * * * * * * *
Industrial 96 2.3 70 * * 13 62 0.7 * * * * * * * *
24 Urban – La Coruna 48 0.7 * 0.6 12 * 30 0.07 * * * *
Industrial 25 0.9 * 0.4 7 * 27 0.007 56 0.9 * 0.8 12 * 32 0.08
25 Urban – Argentina * * * * * * * * 65 0.4 29 1.2 25 3 64 0.3
26 Urban – Washington * * * * * * * * * 3.5 * * * * 1420 0.1
26 Urban – Chicago * * * * * * * * * 6 * * * * 1500 0.6
27 Urban – Illinois * * * * * * * * * * 5.4 0.2 10.1 1.2 209 0.03
28 Urban – Birmingham * * * * * * * * * * 12-66 0.25- 10-23 2.2-7.4 69-113
0.06-0.35 0.6
This paper FEEMA 78 8 50 3.0 200 20 130 0.006 154 5 70 3.2 200 20 90 6.9
Belmonte 65 4 160 3.7 200 b 180 3.4 110 14 190 5.2 300 30 180 4.2
Retiro * * * * * * * * 90 b 200 4.3 200 15 150 3.5
Aeroclube * * * * * * * * 68 b 97 2.1 100 17 610 3.6
Conforto 44 b 580 1.4 100 b 110 4.3 87 b 242 3.2 200 b 90 2.4
Average 62 4 263 2.7 166 6.6 140 2.5 102 4 160 4 200 16 224 4
±17 ±4 ±280 ±1 ±58 ±1 ±36 ±2 ±33 ±6 ±73 ±1 ±71 ±11 ±219 ±2
CONAMA18 150 µg – – – – – – – 240 µg
standards m-3 m-3
24h 24h
average average
EEA19 – 0.05 µg – – 0.15 µg 1 µg 3.0 µg – 250 µg
standards m-3 m-3 m-3 m-3 m-3
24h annual 24h 24h 24h
average mean average average average
USEPA20 standards 150 µg – – – – – 1.5 µg – –
m-3 m-3
24h average
WHO21 standards – – – – 0.15 µg – – 100 µg –
m-3 m-3
annual 24h
mean average
Concentration in ng m-3, #except for PM
10, TSP, Fe and Zn (µg m
-3); * not analyzed; (-) values for 24h-average not suggested; (b) below detection
manganese, if it was considered the annual WHO21 standard
for Europe (0.15 µg m-3) it was exceeded in all stations,
except Aeroclube. Cd and Ni did not exceed the limit suggested by EEA19 in TSP and PM
10, 0.05 µg m
-3 and
1 µg m-3 24h-average, respectively. Zn also did not surpass
daily standard established by WHO21 (100 µg m-3) in both
kinds of particles. Cu and Fe do not have standards established by these agencies.
Half of airborne trace metals in Volta Redonda area are higher than average values reported for urban particulates. In PM10 Cu, Fe, Mn and Zn and in TSP Fe, Mn and Zn presented average concentrations higher than other cities (Table 2). When compared to Brazilian levels, Fe concentrations found in Volta Redonda (2-5 µg m-3 in TSP
and 1.5-4.0 µg m-3 in PM
10) were similar to Rio de Janeiro 1
(1.5-3.0 µg m-3 in TSP and 1.5-2.0 µg m-3 in PM
10). In the
same way, zinc concentrations were 4.5-6.0 µg m-3 in TSP
in Rio de Janeiro1 and 2.0-7.0 µg m-3 in TSP in Volta
Redonda.For most of toxic trace metals (Pb, Cd, Zn, Ni , Cu) anthropogenic inputs are more important than natural sources.25 In Volta Redonda, anthropogenic sources seem
to be responsible for the high metal concentrations, mostly industry related sources such as CSN (Al, Mn, Cr, Sn, Zn and mainly Fe), FEM (mainly Fe), CESBRA (Sb, Bi, Ni, Ag, Zn, Pb and mainly Sn) and Voldac (Mn, Cu and mainly Fe). The wind direction from Northeast to Southwest proves these results since that the highest metal concentrations were registered in Belmonte and FEEMA stations. It is believed that CESBRA and Voldac have minor influence
in metal concentration in the stations due to distance, but they are also emitting.
These results are of some concern as it is well established that inhalable particles that have higher concentrations of many trace elements such Pb, Cd, Zn, Cr, Ni, Mn and Cu are correlated with pulmonary toxicity.23,25
Benzene, toluene and xylenes (BTX)
Table 1 presents the results of BTX levels obtained in the Municipal District of Volta Redonda in both eva-luations. In the first evaluation (Dec/95-May/96) average concentrations for benzene, toluene, xylenes were 70 µg m-3, 23 µg m-3 and 2.5 µg m-3, respectively. In the
second one (Apr-May/99), the arithmetic means were for benzene 23 µg m-3, toluene 4 µg m-3 and xylenes
0.6 µg m-3. Benzene concentrations in the second
evaluation (Apr-May/99) presented values approximately four times lower than in the first one (1995-96). Toluene levels presented a reduction from five to seven times in this last sampling (1999). Xylenes were found in low levels in both evaluations. BTX in Volta Redonda and different cities are presented in Table 3. Reported average concen-trations of benzene has been for South America cities 5-24 µg m-3, Europe, North America and Oceania, < 5 µg m-3
and Asia, 7-31 µg m-3 (except Calcuta 28,555 µg m-3).10,29
Benzene levels in Volta Redonda, in the first evaluation (Dec/95-May/96), were among the highest in cities. In the
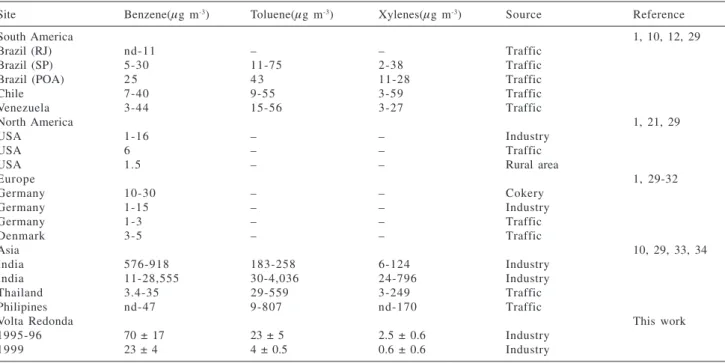
Table 3. BTX average concentrations in Volta Redonda and other regions of the world
Site Benzene(µg m-3) Toluene(µg m-3) Xylenes(µg m-3) Source Reference
South America 1, 10, 12, 29
Brazil (RJ) nd-11 – – Traffic
Brazil (SP) 5-30 11-75 2-38 Traffic
Brazil (POA) 2 5 4 3 11-28 Traffic
Chile 7-40 9-55 3-59 Traffic
Venezuela 3-44 15-56 3-27 Traffic
North America 1, 21, 29
USA 1-16 – – Industry
USA 6 – – Traffic
USA 1.5 – – Rural area
Europe 1, 29-32
Germany 10-30 – – Cokery
Germany 1-15 – – Industry
Germany 1-3 – – Traffic
Denmark 3-5 – – Traffic
Asia 10, 29, 33, 34
India 576-918 183-258 6-124 Industry
India 11-28,555 30-4,036 24-796 Industry
Thailand 3.4-35 29-559 3-249 Traffic
Philipines nd-47 9-807 nd-170 Traffic
Volta Redonda This work
1995-96 70 ± 17 23 ± 5 2.5 ± 0.6 Industry
1999 23 ± 4 4 ± 0.5 0.6 ± 0.6 Industry
second campaign these indices decreased and remained within the levels found in the cities of Latin America and Brazil. The other compounds occurred in low levels similar to other Brazilian cities.
BTX do not have recommended limits according to Brazilian legislation. But following WHO21 and EEA19
standards, average values for toluene and xylenes did not exceed the limit suggested in both campaigns (Table 1). Benzene is a special case for presenting health risk even in low concentrations. Therefore it does not have a standard value but a reference concentration. WHO21 considered that
the excess lifetime risk of leukemia at an air concentration of 1 µg m-3 is 6 x 10⁻⁶, i. e., six extra-cases of leukemia in a
million people exposed during their life. FEEMA adopts as reference the limits suggested by the Germany Governmental Agency35 (2.5 µg m-3) and WHO21 (1.0 µg m-3). In both cases,
all values found for benzene in Volta Redonda exceeded the reference concentration in both evaluations.
In Volta Redonda benzene concentrations ranged from 52 to 93 µg m-3 in the first evaluation (Dec/95-May/96), and
from 20 to 26 µg m-3 in the second one (Apr-May/99).
Maximum concentration was 1644 µg m-3 at Retiro (1995/
96) and 104 µg m-3 at FEEMA (1999). These average
concentrations could correspond to 120 up to 558 extra-cases of leukemia in a population of a million exposed citizens. Considering Volta Redonda population around 250,000 inhabitants this would mean 78 to 140 extra-cases and 30 to 40 extra-cases in the first and second evaluations, respectively. These estimates of extra-cases of leukemia may be real since the Secretary of Health from Volta Redonda36 registered 688
cases of benzenism from 1984 to 1999. The actual number is probably higher because several symptomatic cases are not recognized by the Brazilian Health Integrated System yet. Also, in Cubatão, other big steel producer, hundreds of workers were diagnosed with benzenism, due to exposure in coke producing ovens.37 Benzenism was also prevalent in other
activities, mainly in the petrochemical and oil industries but no estimate of the population potentially exposed in Brazil has been advanced.37
To evaluate the source of BT pollution it is possible to consider the T/B ratio. Depending on gasoline composition T/B from 2 to 3 indicates traffic as a main source of pollution, while values less than 0.5 correspond predominantly to industrial sources.10 Average ratio in the
first evaluation (Dec/95-May/96) was: 0.4 (FEEMA), 1.1 (Belmonte), 0.3 (Retiro), 0.4 (Aeroclube) and 0.3 (Centro de Pesquisass). In the second evaluation (April-May/99) FEEMA presented a ratio T/B of 0.22 and Retiro one of 0.14. These ratios suggest that, during both evaluations, the organic compound pollution is basically due to industrial emissions. According to meteorological
information, the predominant wind direction in the region is East to West, varying from Northeast to Southeast. In both evaluations, the maximum concentration of benzene was obtained at the North and Southeast sections of the studied area, in other words, in Retiro and FEEMA. Wind direction correlation with aromatic hydrocarbon levels permitted to establish the location of the source: the coke producing facility of CSN.
Sulphur dioxide
Sulphur dioxide concentrations were measured only at FEEMA, with an automatic equipment that registered
hourly its average concentration. SO2 average
concentrations were 186 µg m-3 on the first evaluation
(Dec/95-May/96) and 73 µg m-3 on the second one
(Apr-May/99) (Table 1). There was a significant decrease of SO2 concentration between the two evaluations, 2.5 times. Both average concentrations did not exceed the established standards by CONAMA18 and USEPA20 (365 µg m-3-24h)
and EEA19 (300 µg m-3). But in the first evaluation (Dec/
95-May/96) WHO21 daily standards (125 µg m-3-24h) were
exceeded on about 30% of the samplings. According to WHO,21 SO
2 is also toxic for vegetation in annual
concen-trations from 10 to 30 µg m-3, i. e., the concentrations found
in Volta Redonda can originate acid rain, which can damage trees, lakes, and soil.
The results obtained in Volta Redonda (73-186 µg m-3)
are lower than those obtained in the metropolitan area of Rio de Janeiro (140-300 µg m-3).1
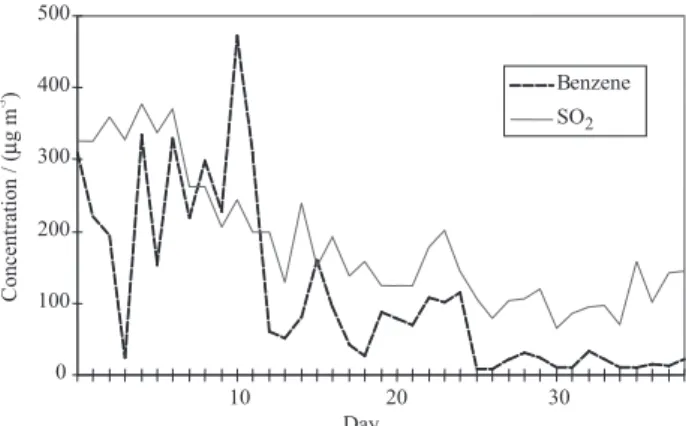
The highest concentration peaks occurred when the wind blew from Northeast to East. Lower concentrations were obtained with the wind blowing from West to Northwest. These results indicate that burning of coal in CSN is the major source of SO2 in that city. It was confirmed by fact that the daily concentrations of SO2 and benzene present similar behavior (Figure 2), that is, the main emission sources for both compounds is the same.
Conclusions
TSP in Volta Redonda presented average levels that did not exceed 24h-standards by CONAMA18 (240 µg m-3)
and EEA19 (250 µg m-3). Also, the concentrations found
were lower than for other Brazilian and foreign cities, not being the major pollutant in that city. In accordance with wind direction and locations of monitoring sampling sites the most probable source of TSP in Volta Redonda is the CSN plant (handling of ores and burning of coal) followed by Tupy cement (crushing and blending of limestone and grinding to a fine powder).
PM10 levels were below daily limits established by CONAMA18 and USEPA20 (150 µg m-3). PM
10 corresponds
to more than 50% of TSP, indicating anthropogenic sources for particulate matter. The concentrations found were similar to other cities.
All metals monitored were in high concentration, except V, Cr (not detected) and Cd. The highest concentra-tions were detected for Zn and Fe. These metals together with Mn, are among the most used by the local industries. Only Mn exceeded the limit suggested by WHO21 and
EEA19 (0.15 µg m-3) if it were considered as annual average,
except in Aeroclube. Metal concentrations occurred mainly in TSP (Fe, Cu, Mn and Zn). The high concentration of metals can be attributed to several industries in Volta Redonda (CSN, FEM, Voldac and CESBRA). FEEMA and Belmonte stations were more affected stations by metal concentrations due to proximity to emission sources. Elevated concentration of metals in PM found in Volta Redonda can jeopardize population health, for example pulmonary diseases, mainly in susceptible people. These results are punctual and do not allow many conclusions about exact emission sources, metal distribution in particulate matter and annual average concentrations. Further research is definitely needed.
BTX, mainly BT, presented high concentrations (70 µg m-3, 23 µg m-3, 2.5 µg m-3, respectively ) in the first
evaluation (Dec/95-May/96) being reduced 4 to 7 times in the second one (23 µg m-3, 4 µg m-3, 0.6 µg m-3,
respectively), but benzene values were still high. Toluene and xylenes did not go above the limits suggested by WHO21 and EEA19. Benzene is toxic in any concentration,
therefore it can be considered to be the major airborne pollutants in Volta Redonda. T/B ratios were lower than 0.5 reinforcing industrial emissions as the pollution source. Consistent with meteorological information, the highest levels of BTX were obtained leeward to CSN coke producing plant, pinpointing it as their major emission source. Elevated benzene concentrations can be influencing directly on population health in Volta Redonda
confirmed by lofty benzenism index (688 registered cases from 1984 to 1999).
SO2 concentrations were below the 24h-average according to CONAMA18 and USEPA20 (365 µg m-3) but
exceeded WHO21 limits in the first evaluation
(Dec/95-May/96) (125 µg m-3). In the second the levels were
reduced by 2.5 times. But, these indices are still high for vegetation. According to meteorological data the highest concentrations were obtained when the wind blew from CSN to FEEMA station indicating the burning of coal as main emission source.
In conclusion, monitored air composition showed that the industrial activity is the predominant pollution source in Volta Redonda, possibly due to gaseous emissions during coke production and raw benzene storage. It was evident that, in general, the highest registered values of concen-tration for each monitoring air quality station occurs leeward from CSN, and that the lower values occurs windward. The analysis of the results in the second monitoring evaluation of air quality, especially with regards to the organic compounds and sulphur dioxide, showed that the concentration levels of these pollutants were significantly reduced in relation to the values on the first one. This fact confirms that the pollution control measures adopted by CSN, after the first evaluation (Dec/95-May/ 96), such as benzene storage leakage control system, flotation membranes and the change of the coke oven’s doors control system, resulted in a great reduction of the pollution levels at the surveyed area.
The small budget available to governmental entities such as FEEMA for monitoring campaigns together with their high cost has limited the sampling period. However, this work, in spite of limited data, had great importance to improve air quality in Volta Redonda. Based on this research, drastic measures were enforced decreasing the levels of pollutants by more than 70% which will benefit hundreds of citizens and the environment.
Acknowledgements
FAPERJ, CNPq, CAPES and FUJB for research grants.
References
1. FEEMA, Rio de Janeiro State Environmental Engineering Foundation; Air Quality in Volta Redonda, Report of Results Obtained in Monitoring Evaluation of 96 and 99, FEEMA/ GTZ, 1999 (document in Portuguese).
3. Martinis, B. S.; Kado, N. Y.; Carvalho, L. R. F.; Okamoto, R. A.; Gundel, L. A.; Mut. Res.1999, 446, 83.
4. Bono, R.; Bugliosi, E. H.; Schiliro, T.; Gilli, G.; Atmos. Environ. 2001, 35, S107.
5. Grosjean, D.; Miguel, A. H.; Tavares, T. M.; Atmos. Environ. 1990, 24B, 101.
6. Allen, A. G.; Miguel, A. H.; Atmos. Environ. 1995, 29, 3519. 7. Daisey, J. M.; Miguel, A. H.; de Andrade, J. B.; Pereira; P. A. P.;
Tanner, R. L.; J. Air Pollut. Control Assoc.1987, 37, 15. 8. Tanner, R. L.; Miguel, A. H.; Aerosol Sci. Technol. 1989, 10,
213.
9. Azevedo, D. A.; Moreira, L. S.; Siqueira, D. S.; Atmos. Environ. 1999, 33, 4987.
10. Fernandes, M. B.; Brickus, L. S. R.; Moreira, J. C.; Cardoso, J. N.; Chemosphere2002, 47, 417.
11. Santos, C. Y. M.; Azevedo, D. A.; Aquino Neto, F. R.; Atmos. Environ. 2002, 36, 3009.
12. Grosjean E.; Grosjean, D.; Rasmussen, R. A.; Environ. Sci. Technol. 1998, 32, 2061.
13. Grosjean, E.; Reinhold, A. R.; Grosjean, D.; Atmos. Environ. 1998, 32, 3371.
14. de Andrade, J. B.; Andrade, M. V.; Pinheiro, H. L. C.; J. Braz. Chem. Soc.1998, 9, 219.
15. Abas, M. R. B.; Simoneit, B. R. I.; Elias, V.; Cabral, J. A.; Cardoso, J. N.; Chemosphere1995, 30, 995.
16. FEEMA, Rio de Janeiro State Environmental Engineering Foundation; Environmental Profile of Volta Redonda Municipality, 1991(document in Portuguese).
17. FEEMA, Rio de Janeiro State Environmental Engineering Foundation, MF-613.R-2;Method to Determine Metals in Total Particulate Matter in Air by Atomic Absorption Spectrometry, 1999 (document in Portuguese).
18. CONAMA, National Environmental Council, Resolution no
03, 28/06/1990; Guidelines for Air Quality, Preview in PRONAR, Published in D.O.U, 22/08/90, Section I, pg. 15.937 to 15.939. Available in: http://www.lei.adv.br/003-90.htm, accessed in August 2003 (document in Portuguese). 19. EEA, European Environmental Agency; Guidelines, 2000.
Available in: http://www.eea.eu.int, accessed in August 2003. 20. USEPA, US Environmental Protection Agency; National Ambient Air Quality Standards, Office of Air Quality Planning and Standards, USA, 1990. Available in: http://www.usepa.gov/ airs/criteria, accessed in August 2003.
21. WHO, World Health Organization; Air Quality Guidelines, 2nd Edition, Regional Office for Europe, 2000. Available in: http://www.euro.who.int/air/Activities, accessed in August 2003.
22. Fang, C. G.; Chang, C. N.; Chu, C. C; Wu, Y. W.; Fu, P. P. C.; Yang I. L.; Chen, M. H.; Sci. Total Environ. 2003, 308, 157. 23. Voutsa, D.; Samara, C.; Atmos. Environ. 2002, 36, 3583. 24. Beceiro-González, E. B.; Garda, J. M.; Velasco, E. S.;
López-Mahía, P.; Sci. Total Environ. 1997, 196, 131.
25. Bilos, C.; Colombo, J. C.; Skorupka, C. N.; Rodrigues Preza, M. J.; Environ. Pollut. 2001, 111, 149.
26. Greenberg, R.R. In Analysis of Atmospheric Particulate Samples
via Instrumental Neutron Activation Analysis - Monitoring Methods for Toxics in the Atmosphere; Zielinski Jr., W.L.; Dorko, W.D., eds. , ASTM STP 1052, American Society for Testing and Materials: Philadelphia, 1990, pp. 175-184. 27. Sweet, C. W.; Vermette, S. J.; Landsberg, S.; Environ. Sci.
Technol.1993, 27, 2502.
28. Harrison, R. M.; Smith, D. J. T.; Luhana, L.; Environ. Sci. Technol. 1996, 30, 175.
29. Gee, I. L.; Sollars, C. J.; Chemosphere 1998, 36, 2497. 30. Skov, H.; Hansen, A. B.; Lorenzen, G.; Andersen, H. V;
Lofstrom, P.; Christensen, C.; Atmos. Environ.2001, 35, 2463. 31. Schneider, P.; Gebefugi, I.; Richter, K.; Wolke, G.; Schnelle, J.; Wichmann, H. E.; Heinrich, J.; Sci. Total Environ. 2001,
267, 41.
32. Gladtke, D.; Toxicol. Lett. 1998,96-97, 277.
33. Chattopadhyay, G.; Chatterjee, S.; Chakraborti, D.; Environ. Technol.1996, 17, 477.
34. Samanta, G.; Chattopadhyay, G.; Mandal, B. K.; Chowdhury, T. R.; Chanda, C. R.; Banerjee, P.; Lodh, D.; Das, D.; Chakraborti, D.; Curr. Sci.1998, 75, 123.
35. EC, European Communities, Council directive 96/62/EC of 27 September 1996; Ambient Air Quality Assessment and Management, Official Journal of the European Communities, L 296/55, 21 November 1996.
36. SSVR-RJ, Health Secretary of Volta Redonda; Report about Benzenism Cases in Volta Redonda Municipality, Health
Integrated System, 1999 (document in Portuguese). 37. Freitas C. M.; Porto, M. F. S.; Freitas, N. B. B.; Pivetta, F.;
Arcuri, A. S.; Moreira, J. C.; Machado, J. M. H.; J. Hazard. Mater.2001, 86, 135.
Received: January 24, 2003