Printed in Brazil - ©2004 Sociedade Brasileira de Química 0103 - 5053 $6.00+0.00
A
r
ti
c
le
* e-mail: [email protected]
Slurry Sampling for Hg Determination in Sediments, Sewage Sludge and Coal Samples
by Cold Vapor Atomic Absorption Spectrometry
Anderson S. Ribeiro, Mariana A. Vieira and Adilson J. Curtius*
Departamento de Química, Universidade Federal de Santa Catarina, 880400-900 Florianópolis - SC, Brazil
Um método simples e robusto para a determinação de Hg em amostras ambientais por espectrometria de absorção atômica com geração de vapor frio diretamente de suspensões ácidas é proposto. Após redução do tamanho das partículas da amostra para ≤ 50 µm em gral de ágata, dois procedimentos foram utilizados para a preparação das suspensões: com 6,7% v/v de ácido nítrico ou 10% v/v de água-régia mais 2% v/v de ácido fluorídrico. Dependendo da amostra, a concentração da amostra na suspensão variou de 3,3 a 23 mg mL-1. O vapor frio de Hg gerado diretamente das
suspensões ácidas das amostras foi conduzido para o tubo T de quartzo, posicionado no lugar do atomizador do espectrômetro. Oito amostras ambientais de referência certificadas foram analisadas. Pelo uso da calibração convencional com padrões aquosos, excelentes resultados foram obtidos quando a água-régia mais o ácido fluorídrico foram utilizados nas suspensões. Amostras de sedimento e carvão de Santa Catarina, Brasil, também foram analisadas. O limite de detecção foi de 30 ng g-1.
Simplicidade, baixo custo e alta eficiência são algumas qualidades do método proposto, mostrando-se adequado para análimostrando-ses de rotina.
A simple and robust method for the determination of Hg in environmental samples by slurry sampling cold vapor generation atomic absorption spectrometry is proposed. After reducing the sample particles size to ≤ 50 µm in an agate mortar, two procedures were used in the slurry preparation: either using 6.7% v/v nitric acid only or 10% v/v aqua regia plus 2% v/v hydrofluoric acid medium. Depending on the sample, the slurry concentrations varied from 3.3 to 23 mg mL-1.
The mercury cold vapor generated directly from the acidified sample slurry was conducted to quartz T tube, placed in the atomizer of the spectrometer. Eight certified environmental materials were analyzed. By using the conventional calibration against aqueous standard solutions, excellent results were obtained when aqua regia plus hydrofluoric acid was used as the slurry medium. Sediment and coal samples from Santa Catarina, Brazil were also analyzed. The obtained limit of detection was 30 ng g-1. Simplicity, low cost and high efficiency are some of the qualities of the proposed method,
making it adequate for routine analysis.
Keywords: mercury, environmental samples, slurry sampling, cold vapor, atomic absorption spectrometry
Introduction
Human and environmental contamination from Hg can be expected, as this element is extensively used in the industry due to its properties. According to the Environmental Protection Agency (EPA), it is one of the most dangerous elements, especially because of its cumulative characteristics.1 Industrial wastes are the main
source of river contamination. The ashing of urban and industrial garbage promotes its volatilization. Coal burning from electrical power generation, as well as, coal mining and activities related to agriculture are also source of
contamination.1,2 In addition to accumulate Hg,
contaminated sediments also act as a potential source, with the possibility of releasing it to the water phase, contaminating then the aquatic environment, from where it can be transferred to the atmosphere and transported with the particulate matter to new places not yet contaminated.1,3
Among the analytical techniques used for Hg determination, the cold vapor generation coupled to atomic absorption spectrometry (CV AAS) is very popular and have relatively low cost. Very often, in order to reach the best conditions for the analysis of different samples, a decomposition, generally with specific acids for different matrices, is suggested in the literature, such as the use of aqua regia4-5 or of a mixture of nitric and sulfuric acids,
followed by the addition or not of hydrogen peroxide6-10
for biological and environmental matrices. However these procedures are tedious, use a lot of glassware and reagents, increasing the risk of Hg contamination or loss in the laboratory.
Horvat et al.11 have proposed the combustion of the
solid sample in a flow of oxygen. The released Hg was retained in gold and determined by CV AAS, after heating the gold trap to volatilize the Hg. The determination of Hg, without sample decomposition, by solid sampling graphite furnace atomic absorption spectrometry (SS GF AAS), can be difficult, because of the very high background signals produced at the allowed low pyrolysis temperatures.12 However, when the conditions are well
optimized, good results can be obtained, as long as certified reference materials12 or, more easily, aqueous standard
solutions stabilized with potassium permanganate13 are
used for calibration. In both cases, a common deuterium lamp background corrector can be used. Anyway, especial accessories are needed for the solid sampling, as a microbalance and devices to introduce the solid sample power into the graphite tube. An interesting alternative is the use of slurry sampling, for which the same devices used for the introduction of liquid sample, as the autosampler or a flow injection system14-15 can be employed.
Still, the generated cold vapor can be retained in a graphite tube treated with a permanent modifier,16-18 before being
determined by GF AAS. The slurry sampling combines the advantages of the liquid and solid sample presentations, with a simplified sample pre-treatment, which also avoids analyte contamination or loss and provides cost reduction and the use of less dangerous reagents. The slurry sampling usually allows the use of aqueous standard solutions for calibration or the analyte addition technique, not requiring certified reference materials for this purpose.2,12,16,19-21
Garcia et al.22 have demonstrated the analysis of coal
fly ash and in diatomaceous earth as slurry. An aliquot of the slurry supernatant was used to determined Hg by CV AAS. The determination of Hg in commercial iron(III) oxide and in titanium oxide pigments by slurry sampling CV AAS is also described in the literature.23
The goal of this work is the development of a robust analytical method for the determination of Hg in different
environmental solid samples (sediments, sewage sludge, coal and coal fly ash) by slurry sampling CV AAS. Specific methods for different samples are proposed in the literature, but a more general procedure could be very practical and useful for routine analysis. In the proposed method, the vapor generated directly from the slurry is conducted to a quartz T tube placed in the atomizer position of the spectrometer.
Experimental
Instrumentation
Integrated absorbance signals (peak area) were measured in an atomic absorption spectrometry AAnalyst 100 (Perkin Elmer, Norwalk, CT, USA) equipped with an mercury electrodeless discharge lamp and a deuterium background corrector under the following operating conditions: wavelength, 253.7 nm; slit-width, 0.7 nm; current, 150 mA.
A hydride generator MHS 15 (Perkin Elmer) was coupled to the AAnalyst 100 and the vapor generator was manually operated. A 3% m/v sodium borohydride solution stabilized with 1% m/v sodium hydroxide was used as reducing agent. The reducing agent was injected during 4 s, corresponding approximately to 1.5 mL of the solution added to the reaction flask. The sample volume was 3 mL. Argon with a purity of 99.996% (White Martins, São Paulo, Brazil) was used as the carrier gas for the mercury vapor, at a pressure of 250 kPa, as recommended by the equipment manual.24
The real samples were also analyzed after dissolution in a microwave oven MLS-1200 MEGA (Milestone, Sorisole, Italy).
The solid samples were weighed using an M2P micro-balance (Sartorius, Göttingen, Germany) and the slurry was sonicated using a Model T7 ultrasonic bath (Thorton, São Paulo, Brazil).
Reagents and reference materials
The reducing agent, a 3% m/v sodium tetrahydroborate solution were prepared by dissolving NaBH4 powder (Merck, No. K1483871) in 1% m/v NaOH (Merck, No. B665769), and stored in polyethylene flask under refrigeration.
The calibration solutions with concentrations of 1.0– 20.0 µg L-1 Hg in 6.7% v/v HNO
3 or 10% v/v of aqua regia
plus 2% v/v HF were obtained daily by appropriate dilution of a 1000 mg L-1 stock solution (Merck, No.80309631).
The emulsion of Antifoam A (Sigma, Steinheim, Germanay, No. 100K0177) was used for the analysis of the of sewage sludge sample.
The following certified reference materials were used: SRM 2704 Buffalo River Sediment (National Institute of Standards & Technology, NIST, Gaithersburg, MD), RS-3 River Sediment from a round robin test,25 PACS-2 marine
sediments (National Research Council of Canada, Ottawa, Ontario), CRM 146 R Sewage Sludge from Industrial Origin and CRM 144 R Sewage Sludge from Domestic Origin (Community Bureau of Reference, Brussels, Belgium), SARM-20 Coal-Sasolburg (South Africa Bureau of Standards) and 1630a Trace Mercury in Coal and 1633b Coal Fly Ash (NIST).
Sediments samples were collected in the coast of Santa Catarina Island, Brazil, in the mangrove of Itacorubi and in the beaches of Ribeirão da Ilha and of Sambaqui. A sediment sampler, model Ekman Tall from Wildco (Buffalo, NY, USA) was used in the collection. A column of about 10 cm of height of the sediment (about 1 kg) was collected. The samples were lyophilized and kept in a refrigerator before homogenization, subdivision and analysis. A coal sample (about 1 kg) from Criciúma, Santa Catarina, Brazil, was analyzed as received after homogenization and subdivision.
Plastic containers were washed with tap water and diluted Extran solution (Merck), kept in contact with 10% v/v HNO3 for at least 48 h, and rinsed three times with de-ionized water prior to their use. The polyester sieves were kept in 3% v/v HNO3 for at least 24 h, before use.
Slurry preparation
Based on the work of Vieira et al.20-21 and of Flores et
al.,16 two procedures were tested, using two different acid
media in the slurries. All samples were ground in an agate mortar and passed through a ≤ 50 µm polyester sieve. The slurry was prepared by mixing approximately 50 to 350 mg of the ground and sieved sample with 1 mL of nitric acid or with 1.5 mL of aqua regia plus 0.3 mL of hydrofluoric acid in a 15 mL volumetric flask, which was placed in an ultrasonic bath for 30 min. The slurry was
allowed to stand at room temperature for 48 h under occasional shaking and submitted to the ultrasonic bath again for another 30 min. In this way, the nominal solid sample concentration in the slurry was between 3.3 and 23.3 mg mL-1 in a 6.7% v/v nitric acid or 10% v/v aqua
regia plus 2% hydrofluoric acid medium. After that, the volumes were made up to 15 mL with deionized water. The sample blanks was prepared in the same way as the slurries. The slurries were manually shaken for 30 s before the analysis for a better homogeneity.
Microwave digestion
About 250 mg of the sediment or 100 mg of the coal were transferred to a microwave over digestion flask and 5 mL of nitric acid plus 2 mL of hydrofluoric acid were added. After 20 min, the flask was closed and introduced into the oven, allowing the complete decomposition of the material using the following program: 250 W for 6 min, 400 W for 6 min, 650 W for 6 min, 250 W for 6 min and zero W for 5 min. The final solution was quantitatively transferred to a 50 mL flask and the volume was completed with water.
Analytical procedure
A 3 mL aliquot of the standard solution, mineralized sample or slurry was transferred to the reaction flask of the hydride generator and 40 µL of Antifoam A was added only for the analysis of the sewage sludge sample, as it is not necessary for the sediment and coal samples. The reducing agent, was added to the reaction flask for 4 s and the vapor generated was carried to the quartz T tube coupled to the AAS spectrometer. At least three measurements were taken for each sample, and the respective absorbance signal for the blank (in the order of 0.020 s) was always taken into consideration. Conventional calibration against aqueous standard solutions in the same acid medium as in the slurries was used.
Results and Discussion
Vapor generation system optimization
The batch system used for the vapor generation is of commercial origin, being all parameters optimized by the manufacturer for the analysis of aqueous solutions in diluted acid media.24 The conditions were re-optimized for the
of 8 s for the reducing agent injection. As shown, a concentration of 1.5% m/v gives the best signal for sediment and coal slurries. However, for the sewage sludge, twice this concentration (3.0% m/v) is required for the best signal. At lower sodium tetrahydroborate concentration, the produced hydrogen probably is not sufficient to reduce all Hg in the slurry liquid phase. For higher concentration than the optimum, the signal is lower, indicating interference in the liquid phase of the slurry, probably by the co-reduction of interfering species, that could retain the Hg. In addition, the high production of hydrogen for higher reducing agent concentrations, may dilute the Hg vapor and certainly increases the vapor flow rate through the absorption cell, decreasing the residence time of the Hg atoms in the cell and, consequently, the absorbance signal.
The concentration of 3.0% m/v of sodium tetrahydroborate was chosen to investigate the reducing agent injection time, as this concentration is recommended by the manufacturer for aqueous solutions.24 As shown in
Figure 2, a injection time of 4 s provides the best integrated absorbance signal. For this injected time, a volume of approximately 1.5 mL of the sodium tetrahydroborate solution is injected in the reaction flask.
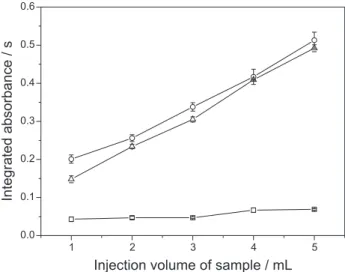
The slurry volume pipetted into the reaction vessel is of great importance, as it affects the limit of detection (LOD). For the studied range, shown in Figure 3, the absorbance signal increases almost linearly with the slurry volume. An injection volume of 3 mL was selected, since enough sensitivity was obtained for the analyzed samples. Better detection limits probably could be attained using higher slurry volume. For the sewage sludge sample of industrial origin, the addition of an antifoaming was
necessary, in order to avoid the transportation of part of the sample slurry as foam to the quartz T tube.
The use of the sample as slurry, instead of a sample solution, did not change the cold vapor system parameters optimized by the manufacturer, indicating that calibration against aqueous standard solution can be used, as it is going to be demonstrated in this work.
Figures of merit
The obtained parameters for the 3 calibration curves are shown in Table 1. As shown, the curve slopes are not affected by the studied acid media or by the antifoaming. In all curves, good correlation coefficients were obtained, Figure 3. Effect of the injected volume of the sample on the inte-grated absorbance signal of Hg for slurries of (—{—) RS-3 River Sediment, (—U—) CRM 146 R Sewage Sludge from Industrial Origin and (— —) SARM-20 Coal-Sasolburg.
Figure 2. Effect of the injection time of NaBH4 3% m/v on the integrated absorbance signal of Hg for slurries of (—{—) RS-3 River Sediment, (—U—) CRM 146 R Sewage Sludge from Indus-trial Origin and (— —) SARM-20 Coal-Sasolburg.
with R ≥ 0.999. Using the more concentrated slurry, for example 23.3 mg mL-1, a limit of detection of 30 ng g-1 was
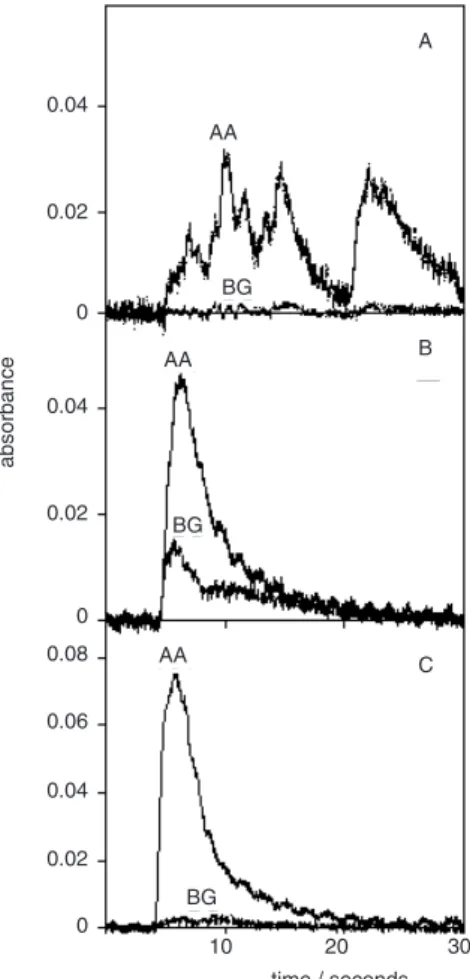
obtained, as the ratio between 3 times the standard deviation of 10 measurements of the standard solution blank and the calibration curve slope. Unexpectedly, the absorption pulses for the sediment or coal slurry and for the aqueous standard solutions were very similar, indi-cating that most of the mercury was extracted to the water phase, as also demonstrated by Flores et al.16 The slightly
higher background signal for the sample slurry could be adequately corrected by the deuterium continuum corrector. However, a different behavior was exhibit by the sewage sludge from industrial origin sample, as shown in Figure 4, being more critical when its slurry is prepared in nitric acid only. The problem, already mentioned, is the foaming of the sewage sludge slurry, circumvented by adding an antifoaming agent. With the addition of the Antifoam A, absorption pulses similar to that for an aqueous standard solution, were also obtained for this sample slurry.
Analytical application
The proposed method was applied to the analysis of 8 certified reference materials (3 sediments, 2 sewage sludge samples, 2 coals and 1 coal fly ash), using conventional
calibration against aqueous standard solutions in the same acid medium as in the slurries. As shown in Table 2, the results for the sample slurry prepared in nitric acid were
Table 2. Analytical results obtained for eight reference materials using slurry sampling CV AAS
Samples Certified (µg g-1) Nitric acid Aqua regia + HF
Found (µg g-1) RSD (%) Found (µg g-1) RSD (%)
Sediments
SRM 2704 1.47 ± 0.07 1.21 ± 0.08 6.6 1.54 ± 0.03 1.9
RS-3 10.34 ± 0.14 7.89 ± 0.71 9.0 10.58 ± 0.10 0.9
PACS-2 3.04 ± 0.20 2.07 ± 0.34 16.4 3.13 ± 0.05 1.6
Sewage Sludge
CRM 146 R 8.62 ± 0.33 6.4 ± 0.1 1.6 8.27 ± 0.16 1.9
CRM 144 R 3.14 ± 0.23 2.25 ± 0.10 4.4 3.09 ± 0.21 6.8
Coals
SARM-20 0.25 (0.18-0.27) 0.20 ± 0.01 5.0 0.26 ± 0.02 7.7
1630a 0.106 ± 0.023 0.119 ± 0.004 3.4 0.107 ± 0.009 8.4
Coal Fly ash
1633b 0.141 ± 0.019 0.159 ± 0.024 15.1 0.127 ± 0.011 8.7
n = 3.
Table 1. Effect of different media used in the slurry preparation on the calibration curve for mercury
Medium Slope (L µg-1) s R LOD (µg L-1)
HNO3 0.03483 0.9999 0.69
HNO3 + HCl + HF 0.03528 0.9996 0.68
HNO3 + Antifoam A 0.03455 0.9990 0.70
significant lower than the certified values for the sediments and for sewage samples, however good agreement was obtained for the coal and coal fly ash samples. Most probably, part of the mercury is retained by the particles of the sediment and sewage sludge slurries. In addition, the relative standard deviation (RSD) were higher then 10% for some samples. By using aqua regia plus HF, the agreement with the certified values was excellent, according to the t-test for a 95% confidence level. The relative standard deviations, below 8.7%, were also quite adequate for slurry sample presentation.
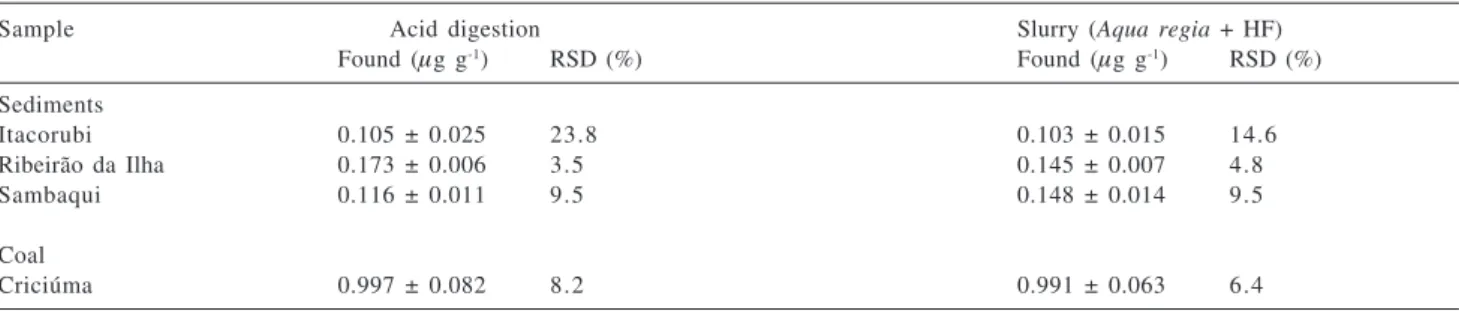
The proposed method that uses aqua regia plus hydrofluoric acid in the slurry was also applied to the analysis of three sediments samples collected in the coastal region of the Santa Catarina Island and one coal sample from Criciúma. The same samples were also analyzed after dissolution assisted by microwaves. The obtained concentrations by the two methods are shown in Table 3. According to the Student t-test, there is not significant difference between the results for a confidence level of 95%, except for the sample from Ribeirão da Ilha, for which the agreement is for a confidence level of 99%.
Certainly, the aqua regia plus hydrofluoric acid medium promotes a more efficient extraction of the analyte to the water phase of the slurry, due to a more drastic oxidant attack of the silica and of the organic matter. The aqua regia plus hydrofluoric acid medium is recommended, since it is adequate for a greater variety of environmental samples.
Conclusions
A simple, robust, low cost and efficient method for the determination of Hg by slurry sampling CV AAS, in environmental samples, without sample decomposition is proposed. The sample particles size is reduced to ≤ 50 µm in an agate mortar before forming slurry in an acid medium. A mixture of aqua regia plus hydrofluoric acid, recommended as the slurry medium, allows accurate determination of Hg, in sediment, coal, coal fly ash and
sewage sludge samples. By using nitric acid only as the slurry medium only coal and coal fly ash can be analyzed accurately analyzed. A more efficient extraction of the analyte to the water phase may be responsible for the success of the aqua regia plus hydrofluoric acid medium. The reduced sample size and reagent consumption, in addition to the minimum sample handling lead to lower risks of contamination and loss and generate less residue in the laboratory, demonstrating that the method is applicable to routine Hg determinations.
Certainly, the same method of sample introduction can also be adapted to other detectors, for example, to an atomic fluorescence spectrometer or to an inductively coupled plasma mass spectrometer, improving the detection limits.
Acknowledgments
The authors are thankful to Conselho Nacional de Pesquisas e Desenvolvimento Tecnológico (CNPq) and to Financiadora de Estudos e Projetos (FINEP) for financial support (Contract PADCT III-3-CIAMB-01/97-03/02-30). The authors have research scholarships from CNPq.
References
1. EPA-452/R-97-007, Mercury Study Report to Congress -Volume V: Health Effects of Mercury and Mercury Compounds, Environmental Protection Agency, December 1997. 2. Maia, S. M.; Pozebon, D.; Curtius, A. J.; J. Anal. At. Spectrom.
2003,18, 330.
3. Kudo, A.; Water Sci. Technol. 1992, 26, 217.
4. Hanna, C. P.; McIntosh, S. A.; At. Spectrosc. 1995, 16, 106. 5. Zhou, C. Y.; Wong, M. K.; Koh, L. L.; Wee Y. C.; Anal. Sci.
1996, 12, 471.
6. Kuldvere, A.; Analyst 1990, 115, 559.
7. Adeloju, S. B.; Dhindsa, H. S.; Tandon, R. K.; Anal. Chim. Acta 1994, 285, 359.
8. Adeloju, S. B.; Dhindsa, H. S.; Mierzwa J.; Anal. Sci. 1997, 13, 619.
Table 3. Mercury concentrations in marine sediment samples collected around the cost of the Santa Catarina Island and in mineral coal collected in Cricíuma (Santa Catarina, Brazil)
Sample Acid digestion Slurry (Aqua regia + HF)
Found (µg g-1) RSD (%) Found (µg g-1) RSD (%)
Sediments
Itacorubi 0.105 ± 0.025 23.8 0.103 ± 0.015 14.6
Ribeirão da Ilha 0.173 ± 0.006 3.5 0.145 ± 0.007 4.8
Sambaqui 0.116 ± 0.011 9.5 0.148 ± 0.014 9.5
Coal
Criciúma 0.997 ± 0.082 8.2 0.991 ± 0.063 6.4
9. Nguyen, T. H.; Boman, J.; Leermakers, M.; Baeyens, W.; Fresenius J. Anal. Chem. 1998, 360, 199.
10. Nguyen, T. H.; Boman, J.; Leermakers, J.; Baeyens, W.; X-ray Spectrom. 1998, 27, 277.
11. Horvat, M; Lupšina, V.; Pilhar, B.; Anal. Chim. Acta 1991, 243, 71.
12. Maia, S. M.; Welz, B.; Ganzarolli, E.; Curtius, A. J.; Spectrochim. Act Part B 2002, 57, 473.
13. Silva, A.F.; Welz, B.; Curtius, A. J.; Spectrochim. Acta Part B
2002, 57, 2031.
14. Río-Segade S.; Bendicho, C.; J. Anal. At. Spectrom. 1999,14, 1907.
15. Segade, S. R.; Tyson, J. F.; J. Anal. At. Spectrom. 2003,18, 268.
16. Flores, E. M.; Welz, B.; Curtius, A. J.; Spectrochim. Acta Part B 2001, 56, 1605.
17. Moreda-Piñeiro, J.; López-Mahía P.; Muniategui-Lorenzo, S.; Fernández-Fernández, E.; Spectrochim. Acta Part B 2002, 57, 883.
18. Moreda-Piñeiro, J.; López-Mahía P.; Muniategui-Lorenzo, S.; Fernández-Fernández, E.; Prada-Rodriguez, D.; Anal. Chim. Acta 2002, 460, 111.
19. Magalhães, C. E. C.; Arruda, M. A. Z.; Quim. Nova 1998, 21, 459.
20. Vieira, M. A.; Welz, B.; Curtius, A. J.; Spectrochim. Acta Part
B 2002, 57, 2057.
21. Vieira, M. A.; Saint’Pierre, T. D.; Welz, B.; Curtius, A. J.; J.
Anal. At. Spectrom. 2004, 19, 297.
22. García, I. L.; Cortez, J. A.; Córdoba, M. H.; At. Spectrosc.
1993, 14, 144.
23. García, I. L.; Martínez, M. J. V.; Córdoba, M. H.; J. Anal.
Atom. Spectrom. 1991, 6, 627.
24. Perkin Elmer, MHS 15; Mercury Hydride System, User’s Guide, Part number 0993-5288, 2000.
25. Heininger, P.; Pelzer, J.; Henrion,R.; Henrion, G.; Fresenius’
J. Anal. Chem. 1998, 360, 344.
Received: January 7, 2004