Carlos Eduardo Lobo e Silva Geoffrey J. D. Hewings
Resumo
O objetivo central deste trabalho é mostrar a importância que a organização interna das firmas pode ter na decisão de localização das empresas e, consequentemente, no processo de fragmentação espacial da produção. Na simulação proposta, na medida em que os custos de comunicação diminuem ou as estru-turas gerenciais se tornam mais flexíveis, as fábricas tendem a se localizar nas cidades médias, enquanto as administrações centrais das firmas se aglomeram nas áreas metropolitanas. A introdução da organização interna das firmas no modelo, um aspecto não levado em conta pela abordagem proposta por Jones e Kierzkowski, permite formalizar evidências empíricas apontadas pela literatura recente.
Palavras-Chave
fragmentação produtiva, estrutura gerencial, localização de negócio
Abstract
The main purpose of the work is to provide a theoretical link between the location decision and the in-ternal organization of firms. In the simulation presented, (1) communication costs within the firm and (2) managerial structures affect both the production fragmentation process and the economic specialization of cities. More specifically, as either communication costs diminish or managerial structures become more flexible, manufacturing plants tend to move from the big city to medium cities, whereas headquarters and business services tend to agglomerate in the metropolitan area. The introduction of the internal organiza-tion of firms into the model, an aspect that is not modeled by Jones-Kierzkowski’s approach, allows this article to formalize some empirical evidences pointed out by the literature.
Keywords
production fragmentation, managerial structure, business location
JEL Classiication D20, R12
Pontifícia Universidade Católica do Rio Grande do Sul (PUC-RS). The author would like to thank Conselho
Nacional de Desenvolvimento Tecnológico (CNPq) for the financial support. E-mail: [email protected].
University of Illinois at Urbana-Champaig. E-mail: [email protected].
1 Introduction
Herbert Simon (1991) imagines a mythical visitor from Mars who “approaches the Earth from space, equipped with a telescope that reveals social structures” (p. 27). The firms are shown as solid green areas, market transactions are red lines con-necting firms, whereas pale blue lines represent the lines of authority concon-necting bosses with subordinates. Simon says that no matter which economy our visitor approached, the green areas would be the dominant feature of the landscape. With his story, Simon aims to stress the importance of the organization of firms in this social structure called a market economy.
However, if our visitor compared the image captured by his telescope with the one taken by the first expedition 30 years earlier, he would be able to see interesting differences between both pictures. In the recent image, not only are there more red lines – some extremely long – that would show him the increase in the trade of inputs, but also many blue lines now connect discontinuous green areas as indirect consequences of the increasing intra-firm trade. This structural transformation has generated significant impacts on the global economy with effects at different scales, national, regional, and urban, since the growing efficiency in transportation and communication has given firms more flexibility to make their location decisions.
This phenomenon has been identified by many works such as Hewings et al. (1998) and, more recently, Guo et al. (2005). In both papers, the authors use Chicago data and obtain similar results to those found by Okazaki (1989) for the Japanese eco-nomy: the manufacturing sectors of big cities have become less and less dependent on local suppliers and demanders for physical goods, thereby increasing the inter-regional trade in inputs, whereas they have become more dependent on services produced within the metropolitan areas. This process, that has lowered the volume of input trade within a region, has been termed “hollowing out.”
The “fragmentation” of the production process, in contrast, has been studied by Jones (2000) and Jones and Kierzkowski (1990, 2003, 2005) among others. According to Jones (2000), “production processes that have traditionally been ver-tically connected, so that all activity takes place in one location, are now frequently broken up or fragmented so that regions that are especially well suited to the pro-duction of parts of the process can now be utilized in producing these fragments” (p. 115).
instead of on the factory floor (within production blocks)” (p. 5). They call it an
alternative framework in order to provide a benchmark comparison with the one proposed by Krugman (1991) among others in the construction of the ideas known today as the new trade theory based on existence of increasing returns in manufac-turing sectors, monopolistic competition, and love for variety.
In the Jones and Kierzkowski framework, the process happens especially among countries in which each economy produces only part of the final good thus increa-sing the international trade of inputs. However, as mentioned above, the hollowing out process, which has been shown to be strongly connected to the fragmentation of production, has been identified at the regional scale (HEWINGS et al., 1998; OKAZAKI, 1989). The same tack has been taken by Krugman’s ideas over the last twenty years: the new trade theory when applied to regional issues has offered insi-ghts on the importance of the spatial dimension in economic theory (KRUGMAN, 1991).
Two recent studies by Duranton and Puga (2002, 2005) not only help us to unders-tand the relationship between features of the economic sectors and agglomeration process but also explicitly mention the connection between the organization of firms and the urban structure. The authors offer an insightful explanation for the fact that some urban areas have become functionally specialized instead of having their activities concentrated on a small number of sectors. This transition, they say, “is inextricably interrelated with changes in firm’s organization” (p. 1).
There is no doubt that the “external-to-the-firm” reasons, such as the cost of fac-tors and transport, are very important for firms’ decisions. However, the relevance of the “external-to-the-firm” reasons does not mean that we should disregard the implications of spatially fragmenting the production on the transactions within the firms (across establishments). Spatial fragmentation is not only a matter of trans-port costs, but also it has to do with the control over production. Thus, models that can provide us with analyses about the internal organization of firms should be taken as complementary tools to examine the regional fragmentation of production and the hollowing out process.
The main argument of the present work is that the questions related to the frag-mentation and hollowing out processes do have much to do with the transactions within them. Considering the production process as a sequence of stages, whene-ver stages n and n+1 are located far away from each other, we have higher cost of transportation and communication. While traders will pay more for transporting, they have an alternative strategy to avoid increasing communication costs: the n+1
how important communication is for a given production process and how commu-nication flow goes through the different levels of a firm are questions that should be answered in order to fully understand firms’ location decisions.
More specifically, the main objective of this paper is to construct a model based on Aghion and Tirole (1997) and Silva and Hewings (2007)to show that commu-nication costs and managerial structure affect both the production fragmentation process and the economic specialization of cities. More specifically, as communica-tion costs diminish (or managerial structure becomes more flexible) manufacturing plants move from the big city to medium cities, whereas headquarters and business services tend to agglomerate in the metropolitan area.
2
Model and Simulation
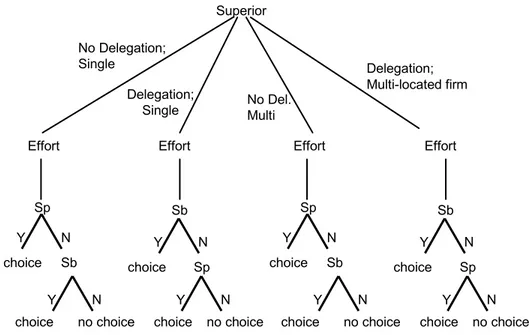
In Aghion and Tirole (1997), subordinate and superior interact to choose the best project among some possibilities. Differently, in the present paper, they have to make a decision related to the manufacturing plant’s operation. Then, superior and subordinate carry out some effort to learn about the problem that demands such decision. The probability of understanding everything regarding the problem is a function of the amount of effort, which varies between zero and one. Still the ow-ner may or may not delegate the final decision to the controller and the implications of that will be better understood soon.
A crucial point of the model presented here is that it is based on the incomplete contracting theory, which means that the owner cannot contract the subordinate´s effort neither she has a menu of incentive to offer to the subordinate. The owner does not know what kind of problem they may face and has no idea about possible solutions that can come up from their learning processes.
that the cost of implementing an efficient communication system is higher. The question, then, could be why should the manufacturing plant be located far away if this does not seem to be desirable for the owner? Some reasons can be advanced to explain why firms implement the multi-locational system such as factor prices, markets and the presence of business services. As a consequence of those reasons, manufacturing plants and headquarters may have the highest locational advantage in different places what gives the owner incentives to spatially split the production process. No Delegation; Single Delegation; Single Sb Y N Sp choice
choice no choice
Effort Effort Y N Sp Y N Sb choice
choice no choice
Y N Superior Sb Y N Sp choice
choice no choice
Effort Effort Y N Sp Y N Sb choice
choice no choice
Y N
Delegation; Multi-located firm No Del.
Multi
Figure 1 – he Process of Decision
not propose any solution for the problem only if he or she has not learnt anything in period 2. In this case, the outcome will be zero for both players. Otherwise, the controller will rubber-stamp the owner’s decision.
The agent decides the effort based only on the formal authority arrangement, not considering the effort expended by the principal. The assumption behind this sim-plification is that the controller does not know how much effort the owner is carrying out. Thus, even though there will not be a maximization problem for the controller, his or her effort responds to the formal authority scheme defined.1
Note that the owner is seen as a receptor of information coming from the manufac-turing plant. The owner learns from that information and any problem of efficiency of communication will hurt her understanding. The controller does not need any communication to learn about and evaluate the projects since the project is rela-ted to the manufacturing plant controlled by him in loco. Therefore, even when the controller and the owner are far from each other, the controller does not have any additional cost to learn about the project because the source of information is always close to him.2
Equations (1) and (2) represent the utility function of the owner of firm j, when the manufacturing plant locates in city mp and the headquarters is in city mh. In equation 2, the formal authority is delegated to the controller. From the compari-son between both, the owner decides if she will delegate the formal authority. The owner decides locations for the manufacturing plant and the headquarters.
Depending on owner’s decision about the formal authority, her utility function can be represented as follows:
, ,
(1
,)
ln(1
,)
,j j j j j
mp mh mp mh mp mh n mp mh mp mh
u
=
E
B
+ −
E
e
a + σ
B
−
tE
+
w
(1),
(1
)
,ln(1
,)
,j j j j
mp mh d mp mh d mp mh mp mh
u
= −
e E
B e
+ a + σ
B
−
tE
+
w
(2)1 About the effort of the agent, Aghion and Tirole say: “Delegation thus increases the agent’s initia-tive; because the principal cannot overrule the agent, the agent has more incentives to become informed” (p.12). This interpretation is incorporated in the present model. The fact that effort of the controller (e) is not a function of the effort of the owner (E) can be understood as if the agent had an expectation about the effort of the owner under those two delegation schemes. Thus, the expectation ofthe owner’s effort would be incorporated in the controller’s maximiza-tion problem, instead of its actual value.
1
1
mp mh t
mp mh t
= ⇔ =
≠ ⇔ >
E and e represent the principal and agent’s efforts, respectively. The payoff of the prin-cipal is B when the best project is chosen according to her preferences and aB when the agent chooses the project. The third term of the right side (σln(1−tEmp mhj , )) mea-sures the cost of effort made to understand the project. The marginal cost is zero when effort is zero and it is infinite when the effort is one. t is equal or greater than one and measures the communication inefficiency.
Note that in equation (1), EB is the probability of identifying the best project ti-mes the payoff that this project yields to the principal. The effect of delegation on the principal’s payoff can be seen in equation (2). (1-e) precedes EB; which means that the choice of the principal will be undertaken only if the agent does not learn anything. Otherwise, the agent will learn everything and choose the project, which is represented by the second term of the equation (2).
Finally, there is some divergence between the interests of the principal and the agent. If the principal chooses the project, her payoff is B, but when the agent makes the final decision, the principal’s expected payoff will be a fraction of B.
If the manufacturing plant is located far from the owner, part of the effort under-taken by the owner is lost in the process and, then, t is greater than one. Otherwise,
t is equal to one and there is no loss of efficiency.
The locational advantage (w) is determined by three elements: (1) the amount of business services present in the city, (2) the population size,3 and (3) the remaining exogenous terms (proximity to inputs, wage differential, etc).
Thus, w turns to be:
,
j j j
w p h
k m = k + m (3)
Where:
1
j j
k k k
p
=
X
+ δ
Pop
(4)1 2
j
m m m
h
= δ
Pop
+ δ
S
(5)Thereforepj
kis the locational advantage of placing the manufacturing plant of firm
j in city k andhj
mis the gain of locating the headquarters of firm j in city m.
Xkand Popk represent respectively the exogenous locational advantage for firm j and the population in city k, whereas Sm is the amount of business sector of city m. Therefore, population affects both h and p. A large population could mean a po-tential market for production, reducing the cost of transportation to ship the final good from the manufacturing plant to the consumers. In case of the headquarters, the large populations of metropolitan areas would be desirable in terms of supplying skilled workers.
Finally:
1 2
m m m
Pop
= θ
NH
+ θ
NP
(6)3
m m
S
= θ
NH
(7)NHmand NPm are respectively the number of headquarters and manufacturing plants in city m.
Note that the communication costs affect only the efficiency of communication within the firm. Therefore, the effect of communication costs on the relationship between manufacturing and business services is not considered. However, this sim-plification should not be seen as a serious limitation since the main objective here is to show how and why (1) communication costs within firms and (2) their mana-gerial structures can change the production distribution over the region.
In the simulation, the number of cities and firms was arbitrarily defined as, 20 and 100, respectively. The only purpose of this choice was to make the simulation able to reveal what the model claims. The distance between any two cities is the same. Besides, in the first period, they have the same population size (normalized at zero) and no firms. Therefore, none of the cities has business services in period zero (see equation 7). Thus, for the first firm, the only variable that can make the total locational advantages (w) vary across cities is X. Then, at the beginning of the first period, the first firm appears. It analyzes the cities and chooses a location for the headquarters and also a place for the manufacturing plant. For the manufacturing plant, it will choose city k such that:
1 1
k g
In fact, for each firm, X will be positive in just one city and zero in any other loca-tion. The locational advantage is homogenously distributed across cities, i.e., given that there are 100 firms and 20 cities, each city will present positive locational advantage for 5 firms.
Since there is no business service in this economy yet and the populations across cities are the same, the headquarters of firm 1 will be located in the city where the plant is located (city k) in order to avoid unnecessary costs of communications. Given this choice, before the second period starts, the simulation updates the po-pulation and the amount of services in city k. The size of population increases and the business service sector becomes positive. Now, the economy is ready to receive the second firm.
Suppose that city v is close to the input of firm 2 and, consequently, it has the highest value of X2.
2 2
X X
v > k for any k≠v
Therefore
p
k2< 2 vp
and firm 2 will have 3 alternatives: (1) locate manufacturing plant in city v and HQ in city k; (2) locate everything in city k; and (3) locate everything in city v. The last two options have no communication costs. If the ow-ner is allowed to delegate the decision to the controller, she will have six options: the same three location choices under delegation and no-delegation.After the decision of the second firm, new updating occurs and the third firm appears. The important point is that the complexity of the decision-making does not increase as the number of firm increases. Firm j identifies the better places both for the manufacturing plant and for the HQ. Then, regardless of the number of firms already placed, firm j has no more than three options to be evaluated as was also the case for the second firm: agglomerating everything (no communication costs) where the manufacturing plant benefits most; agglomerating everything (no communication costs) where the HQ benefits most; or splitting the firm to take the locational advantages in both places.
equilibrium turns out to be determined in the first round, as will be the case here. This assumption can be justified by two arguments: firstly, migration costs are actually significant and, secondly, the main purpose of this work is to show that different managerial structures and communication costs generate different levels
of agglomeration (or fragmentation). The analysis is comparative and the absolute values do not mean much.
Initially, all the cities are of the same size. The population of a given city is a function of the number of manufacturing plant and headquarters (HQ), whereas the amount of business services is a function only of the number of HQ located in there. Therefore, there is no maximization problem for service sectors and the only agent that makes decisions (location and delegation) is the manager of the manufacturing corporation.
At each period of time a new firm arrives. Hence the increase in the number of firms is what drives the simulation. At the beginning of a given period, firm j
decides the location of the headquarters and the manufacturing plant, taking into consideration the locational advantages and the cost of communication in case the corporation is split in two different cities. Given this decision, population increases where the manufacturing plant and the HQs are located; whereas the amount of business services only rises where the HQs are placed.
there is a tendency for fragmenting the process as the production increases once the costs of service links becomes less significant.
The model presented here does not aim to explain all the causes of this phenome-non, rather it presents a framework modeling the internal organization of firms, an aspect that has been overlooked by the literature on fragmentation, so that it can add some additional dimensions (management and communication costs) to the debate that have been ignored by the literature.
The Jones-Kierzkowski’s framework allows them to identify the fragmentation pro-cess by examining a single firm, i.e., the number of production blocks (placed in different location) utilized by the firm indicates the degree of fragmented of the production process. In contrast, in the present model, many firms can use only either one or two production blocks, once introducing multi-establishment firms would make the model much less treatable. Thus, the intensity of the production fragmentation is measured by the number of firms that split their production in two blocks. Despite the limitation of not allowing firms to split the production in many blocks, the advantage of what has been proposed here is that, as mentioned before, this framework can incorporate management aspects and communication costs into the urban system analysis.
3
Procedures and Results
The simulation deals with two scenarios: initially, the owner is allowed to delegate the formal authority to the controller, whereas, in the second part, the owner does not have this alternative. Besides, as explained in detail below, different levels of communication cost are used to check its impact on the regional economy.
It is worth emphasizing that the objective is to show how and why both the internal structure of the firm and communication costs can affect the distribution of pro-duction over a given region. The parameters used do not come from estimations; their role is to introduce into the simulation the assumptions made in the model construction. The results coming from the simulations do not aim to measure any effect; rather they strongly suggest a tendency for fragmentation when communi-cation costs are lower and/or the managerial structure is more flexible. Thus, the choice of parameters had to satisfy the following condition: they should be neither too big nor too low. This condition assures that firms’ decisions will not be defined by the initial parameters regardless of anything else.4For example, if the parameter
that measures the exogenous locational advantages
(
Xs) were too big the location of all manufacturing plants would be the same for any managerial structure and communication costs. Therefore, the choice of parameters have to guarantee that different communication costs and managerial structures lead (at least one) firms to different strategies.Recall that at time zero, the population and the amount of business services of all (twenty) cities are normalized in zero. Before the first firm comes, the simulation randomly defines the order of entries of the firms. Each firm (owner) decides four things: (1) the delegation scheme; (2) the location of the manufacturing plant; (3) the location of headquarters; and (4) the level of effort to learn about the project. In the first round, the cost of communication for firms having manufacturing plant and HQ in different locations is equal to one. It means that, in the first round, firms do not face additional communication costs when they decide to split their production. Then, the first result is obtained.
After that, the simulation goes to the second round: with the same order of enters, all firms make their decisions facing a higher communication cost. In the second round, it will be 1.1; in the third, it raises to 1.2, and so on. The communication costs vary between 1 and 2 in eleven rounds. Thus, it provides eleven results for eleven distinct cases.
The procedure described in the last two paragraphs is repeated 60 times, defining at random new orders of enters for each set of eleven rounds (60 orders of enters). Thus, for each level of communication cost, the simulation provides a sample of 60 maps of production as final result. Therefore, this first part allows us to analyze the effect of different communication costs for the distribution of production and to check whether or not it affects the process of production fragmentation.
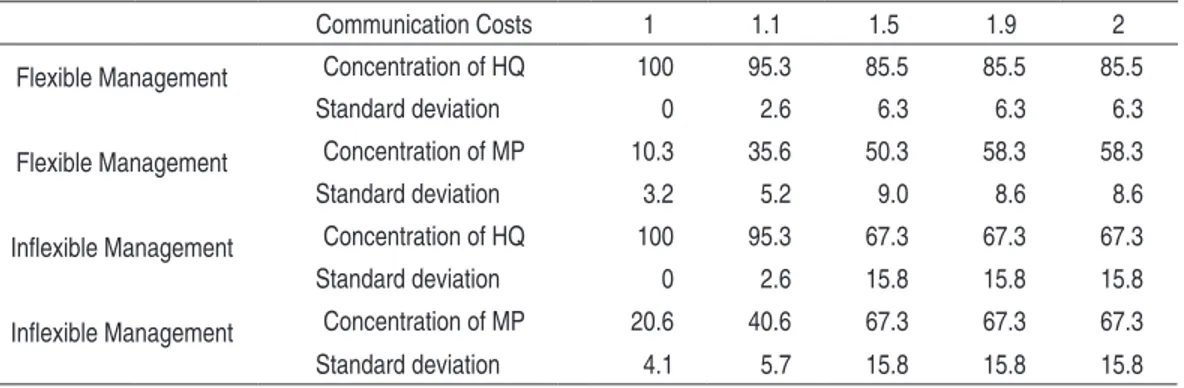
Table 1 – Concentration (%) of Headquarters (HQ) and Manufacturing Plants (MP) in the Metropolitan Area5
Communication Costs 1 1.1 1.5 1.9 2
Flexible Management Concentration of HQ 100 95.3 85.5 85.5 85.5
Standard deviation 0 2.6 6.3 6.3 6.3
Flexible Management Concentration of MP 10.3 35.6 50.3 58.3 58.3
Standard deviation 3.2 5.2 9.0 8.6 8.6
Inlexible Management Concentration of HQ 100 95.3 67.3 67.3 67.3
Standard deviation 0 2.6 15.8 15.8 15.8
Inlexible Management Concentration of MP 20.6 40.6 67.3 67.3 67.3
Standard deviation 4.1 5.7 15.8 15.8 15.8
Table 1 shows the results for those two managerial structures and five levels of communication costs. The numbers represent the average (of those sixty simu-lations) of the concentration (%) of HQ and manufacturing plants in the biggest city of the region. Note that, differently from the so-called Core-Periphery model, which assume the existence of a big city surrounded by the periphery, in the pre-sent work the big city emerges from the model and the location where it will grow depends on the order of enters.
The first results to which attention should be drawn are the different tendencies presented by HQs and manufacturing plants. Under both managerial structures, as the communication costs reduce, HQs concentrate in the main city of the region, whereas the manufacturing plants move to medium cities. Therefore, when commu-nication costs are low, the large city becomes (functionally) specialized in services. In contrast, the manufacturing plants that in the beginning are more concentrated in the metropolitan area, – are distributed across cities according to their own lo-cational advantage. As consequence, one should expect that trade of manufactured good within the metropolitan area is more intense when communication costs are high.
The comparison between two scenarios, with flexible and inflexible management, shows the importance of the internal structure of firms for the map of production. The most important point is the fact that the percentage of manufacturing plants agglomerated in the large city is lower when firms have flexible management for any communication costs. The opposite happens when headquarters are analyzed.
Therefore, the possibility of delegating the formal authority to the controller con-siderably increases both the fragmentation of production and the functional spe-cialization of the metropolitan area (services).
When the owner cannot delegate the formal authority to the controller and com-munication costs are high, the owner keeps the manufacturing plant and the HQ in the same city as can be seen in the three last columns.
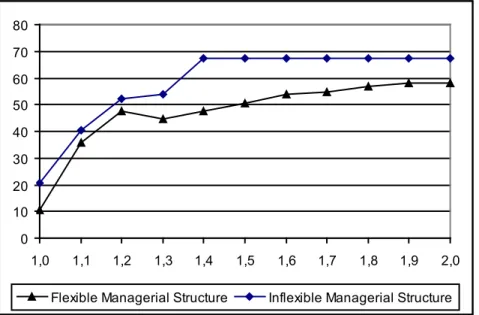
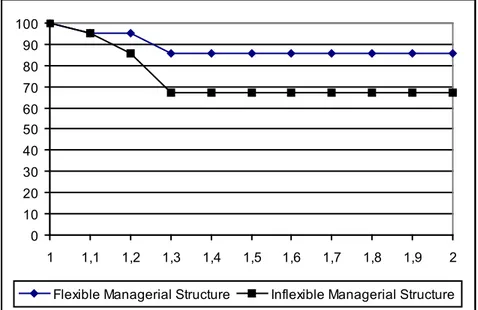
In Figures 2 and 3 , the complete sequence of the averages of the concentration of HQ and manufacturing plants can be seen for different communication costs.
Essentially, the figures confirm what was seen in Table 1. Nonetheless, note that, in the case the delegation is allowed, the concentration of manufacturing plant in-creases as communication costs go from 1.3 to 1.2, in contrast to the tendency (see in Figure 2). This happens because the concentration of headquarters (Figure 3) jumps when communication costs become 1.2, which attracts some manufacturing plants to the metropolitan area.
0 10 20 30 40 50 60 70 80
1,0 1,1 1,2 1,3 1,4 1,5 1,6 1,7 1,8 1,9 2,0
Flexible Managerial Structure Inflexible Managerial Structure
0 10 20 30 40 50 60 70 80 90 100
1 1,1 1,2 1,3 1,4 1,5 1,6 1,7 1,8 1,9 2
Flexible Managerial Structure Inflexible Managerial Structure
Figure 3 – Concentration (%) of Headquarters in the Metropolitan Area for Diferent Communication Costs
While the numbers and graphs presented above strongly suggest that both low communication costs and managerial flexibility contribute to the processes of pro-duction fragmentation and functional specialization of the metropolitan areas, the next step is to test if the averages found for the scenarios analyzed are statistically different. Since the averages of concentration of headquarters and manufacturing plants come from a simple of sixty simulations (greater than thirty), the following formula can be used:
1 2
2 2
1 2
1 2
(
X
X
)
z
S
S
n
n
−
=
+
(8)
The results are summarized in Table 2 and 3.
Table 2 – Testing the Impact of Communication Costs on the Concentration of HQ and MP
Communication Costs 1.1 - 1.5 1.5 - 1.9
Head quarters 12.49 0.00
Manufacturing Plants 8.21 3.07
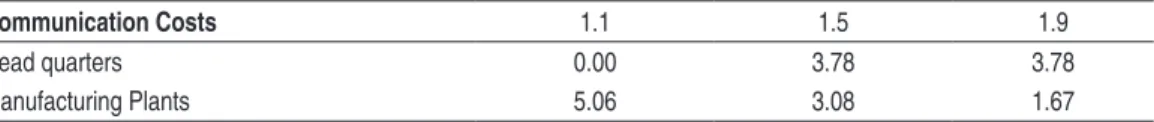
Table 3 – Testing the Impact of Diferent Managerial Structures on the Concentration of HQ and MP
Communication Costs 1.1 1.5 1.9
Head quarters 0.00 3.78 3.78
Manufacturing Plants 5.06 3.08 1.67
Whenever the values in Tables 2 and 3 are greater than 1.65, the averages analyzed can be considered statistically different (with 5% of significance). T he concen-tration of manufacturing plants (Table 2, row 2) presents significant changes for different communication costs, which shows the importance of low internal com-munication costs for firms to decide spreading their production. Still in Table 2, it can be verified that the concentration of headquarters does not change for high communication costs. However, the concentrations of HQs are very different for low costs. In Table 3, except for the case of the concentration of HQs for very low communication costs, the results confirm that different managerial structures drive the regional economy to distinct maps of production.
4 Conclusions
The intuition explaining the main result goes in the following way: in order to bene-fit from both (1) agglomeration of business services in the metropolitan area and (2) the locational advantage, most firms have to fragment their product. However, frag-menting the product means positive communication costs. Then, once controlling the production process turns to be costly, owners will have incentive to decrease their effort and, consequently, delegate the final decision to their subordinates. Therefore, higher communication costs make the fragmentation process less likely, whereas flexible managerial structures allows owners to delegate power, which ten-ds to reduce the cost coming from the geographic distance between headquarters and manufacturing plant, making the fragmentation process more likely.
This model also confirms the findings coming from empirical work such as Arita and McCann (2002) and Sheard (1983) about the positive relationship between decentralization of location and decentralization of decision. Arita and McCann (2002) analyze the electronics and semiconductor industry and try to link the internal structure of the American and Japanese firms with the location of their assembly plants. According to the authors (p. 360), “the Japanese organizational arrangements are constructed within a strict hierarchical system with very little individual autonomy, whereas US firms have a greater degree of decision-making latitude.” Therefore, it may be seen that there is more delegation in the American structure than in the Japanese corporations. Assuming this, the model proposed here would expect there would be a tendency for the Japanese plants to be located closer to headquarters, whereas American plants would be more aggressive in pla-cing their plants where the locational advantage appears to be higher. In the authors’ word: “(…) the US firms are much more spatially differentiated and internationally integrated than the Japanese firms, in the sense that the activities are distributed more widely according to both location and activity types” (p. 359).
The main limitation of this model is the assumption that migration costs are high enough to prevent firms from changing their location decision. Firms decide their best location and cannot move in response to the other firms’ choices. Besides, they do not know the preferences of those firms that are coming and, then, they make the decision taking into consideration only those firms that have already placed. An interesting extension of the work would be to derive the equilibrium by assuming there is a finite cost of migration. In this case, it is important to introduce some centrifugal forces - such as congestion costs – as well.
References
AGHION, Philippe; TIROlE, Jean. Formal and real authority in organizations. The Journal of Political Economy, v. 105, n. 1, p. 1-29, 1997.
ARITA, Tomokazu; MCCANN, Philip. The relationship between the spatial and hierarchical organization of multiplant firms: observations from the global semi-conductor industry. In: MCCANN, Philip. (Ed.). Industrial location economics.
Massachusetts: Edward Elgar Publishing limited, 2002. p. 319-363
DURANTON, Gilles; PUGA, Diego. Diversity and specialization in cities: why, where and when does it matter? In: MCCANN, Philip. (Ed.). Industrial location economics. Massachusetts: Edward Elgar Publishing limited, 2002. p. 151-186.
______. From sectoral to functional urban specialization. Journal of Urban Economics, v. 57, n. 2, p. 343-370, 2005.
GUO, Dong; HEWINGS, Geoffrey; SONIS, Michael. Integrating decomposition approaches for the analysis of temporal changes in economic structure: an ap-plication to Chicago’s economy from 1980 to 2000. Economic System Research, v. 17, n. 3, p. 297-315, 2005.
HEWINGS, Geoffrey; SONIS, Michael; GUO, Jiemin; ISRAIlEVICH, Philip; SCHINDlER, Graham. The hollowing-out process in the Chicago economy, 1975-2011. Geographical Analysis, v. 30, n. 3, p. 217-233, 1998.
JONES, Ronald. Globalization and the theory of input trade. Cambridge, Massachu-setts: the MIT Press, 2000.
JONES, Ronald; KIERZKOWSKI, Henryk. The role of services in production and international trade: a theoretical framework. In: JONES, R.; KRUEGER, A. (Ed.). The political economy of international trade. Oxford: Basil Blackwell, 1990. p. 31-48.
______. International trade and agglomeration: an alternative framework. Sep. 2003. Unpublished manuscript.
KRUGMAN, Paul. Increasing return and economic geography. The Journal of Political Economy, v. 99, n. 3, p. 483-499, 1991.
OKAZAKI, F. The hollowing out phenomenon in economic development. In:
PACI-FIC REGIONAl SCIENCE CONFERENCE,1989, Singapore.
PEllENBARG, Piet; WISSEN, leo van; DIJK, Jouke van. Firm migration. In: MCCANN, Philip. (Ed.). Industrial location economics. Massachusetts: Edward Elgar Publishing limited, 2002. p. 110-148.
SHEARD, P. Auto-production system in Japan: organizational and locational features.
Australian Geographical Studies, v. 21, n. 1, p. 49-68, 1983
SIlVA, C.E.l.; HEWINGS, Geoffrey. location, communication, and control within a vertically integrated firm. Discussion Paper, Regional Economics Applications Laboratory (REAL 07-T-7), 2007.