Frequency of Acute Plaque Ruptures and Thin Cap Atheromas at
Sites of Maximal Stenosis
Fabio Tavora, Nathaniel Cresswell, Ling Li, David Fowler, Allen Burke
Armed Forces Institute of Pathology, University of MarylandAbstract
Background: There have been few autopsy studies relating sites of thin cap atheroma (TCFA) to sites of acute plaque rupture in culprit arteries, and sites of maximal narrowing in non-culprit arteries.
Objectives: We aimed to quantify and locate the frequency of TCFA related to the sites of maximal stenosis in atherosclerotic plaques.
Methods: We studied 88 hearts in victims of sudden death dying with coronary thrombus overlying acute plaque rupture. Thin cap atheromas were defined as fibrous cap < 65 microns overlying a necrotic core. Percent luminal narrowing was determined at the sites of plaque rupture and thin cap atheromas.
Results: There were 81 men and 7 women, mean age 50 years ± 9 SD. The plaque rupture was the site of maximal luminal narrowing in 47% of culprit arteries. TCFAs were present in 67 hearts (83%). Of these, 49 (73%) demonstrated TCFAs in the culprit artery; 17 (25%) in the culprit artery only, 32 (48%) in the culprit artery and in a non-culprit artery, and 18 (27%) only in a non-culprit artery. In non-culprit arteries, TCFAs represented the maximal site of stenosis in 44% of arteries. The acute rupture site is the site of maximal luminal narrowing in the involved vessel in 47% of hearts from patients dying with acute plaque rupture.
Conclusions: These data may suggest that luminal narrowing is not a reliable marker for TCFA. (Arq Bras Cardiol 2010;94(2): 143-149)
Key Words: Atherosclerosis; coronary artery disease; heart rupture; coronary stenosis.
Mailing Address: Fabio Tavora •
6825 16th St NW, Washington, DC, 20306
E-mail: [email protected]
Manuscript received June 30, 2009; revised manuscript received August 07, 2009; accepted August 20, 2009.
Introduction
Thin cap atheroma (TCFA) is considered to be the precursor lesion to acute plaque rupture, and has been defined as a fibroatheroma with a fibrous cap thinner than 65 microns1.
The numbers of thin cap fibroatheromas have been described in a number of autopsy studies2-5. Imaging of TCFAs is not
currently feasible by routine methods, due to lack of resolution capabilities, although a variety of investigational approaches are being studied to identify TCFAs in coronary arteries6-14.
The relationship between underlying plaque stenosis and areas of maximal luminal narrowing comparing rupture sites and TCFAs has not been fully studied at autopsy. Although maximal narrowing is frequently the site of plaque rupture or TCFA in a given artery, the frequency with which these lesions occupy the most severe lesion in terms of angiography is not known.
We studied a series of hearts with acute plaque rupture, in order to determine the frequency with which acute ruptures are the site of maximal luminal narrowing in a given artery
(culprit artery), and the frequency with which TCFA is the site of maximal luminal narrowing in non-culprit arteries.
Methods
Hearts were seen in consultation from a Medical Examiner’s office. Cases of sudden cardiac death were selected based on the presence of acute plaque rupture with luminal thrombus. Epicardial arteries were serially sectioned at 3 mm intervals and all arteries with grossly visible atherosclerosis embedded in paraffin after fixation. A mean of 36 ± 23 segments were studied microscopically in each heart. Acute plaque rupture and thin cap atheroma were defined as previously described1.
Specifically, thin cap atheroma denoted the presence of a necrotic core with an overlying fibrous cap, which measured
≤ 65 microns in thickness. Stenosis of the underlying plaque
sites of rupture did not include the mural thrombus. Stenosis was determined by computed planimetry in most cases (SPOT® Insight Digital camera mounted on an Olympus
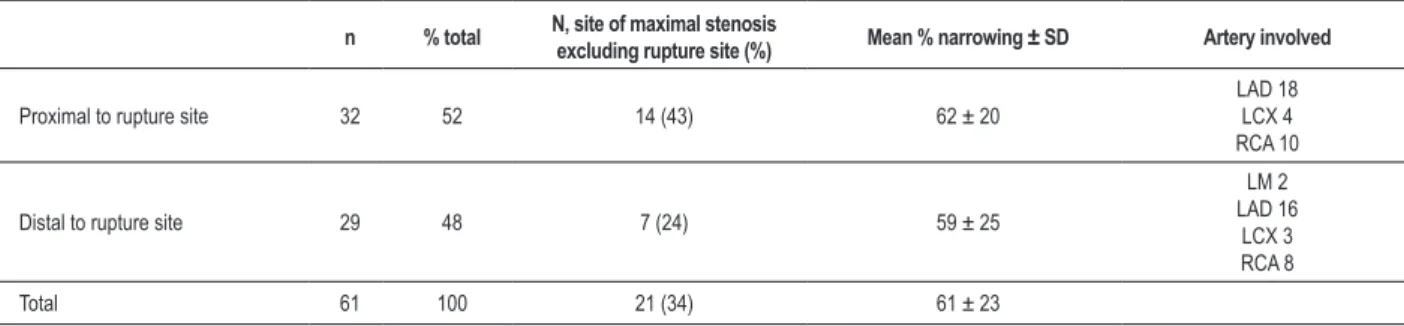
Table 1 - Culprit artery TCFAS*
n % total N, site of maximal stenosis
excluding rupture site (%) Mean % narrowing ± SD Artery involved
Proximal to rupture site 32 52 14 (43) 62 ± 20
LAD 18 LCX 4 RCA 10
Distal to rupture site 29 48 7 (24) 59 ± 25
LM 2 LAD 16
LCX 3 RCA 8
Total 61 100 21 (34) 61 ± 23
*Only TCFA with greatest narrowing proximal or distal to rupture site included; TCFA - thin cap ibroatheroma; LAD - left anterior descending; LCX - left circumlex;
RCA - right coronary artery.
performed using IPLab software (Scanalytics, Inc., Fairfax, VA). A segment devoid of necrotic core was required to consider a TCFA or acute rupture a distinct lesion and not a contiguous plaque type.
There were 5 types of plaques identified and measured in the 4 major arteries (left main, left anterior descending and diagonals, left circumflex and marginals, and right coronary artery): the acute rupture site; the site of maximal narrowing in the culprit artery (if not the rupture site); TCFAs proximal and distal to the rupture site in the culprit artery (maximum 2); TCFA with the most narrowing in non-culprit arteries (1 per artery, maximum 3 per heart); and maximal luminal narrowing in non-culprit arteries with TCFAs (maximum 3 per heart). All 88 hearts were considered in determining the frequency with which the rupture site was the site of maximal luminal narrowing in the culprit artery and comparing the % stenosis of the rupture site when maximal or not. TCFAs in the culprit artery were measured proximally and distally to the rupture site to determine the frequency of each group and how often the TCFA was the next most narrowed lesion after the rupture (Table 1). TCFAs in non-culprit arteries were similarly compared to sites of maximal narrowing (Table 2).
Results
There were 81 men and 7 women. The mean age was 50 years (Table 3). The most frequent site of acute plaque rupture was the left anterior descending artery, followed by
the right (Table 3). 67 of 88 hearts showed ≥ 1 TCFA; these
hearts formed the basis for study.
Plaque ruptures were present in the left anterior descending artery and branches in 45 hearts, the right coronary and branches in 27 hearts, the left circumflex and marginals in 13 hearts, and the left main in 3. Figure 1 illustrates a classical example of an acute thrombus overlying plaque rupture. In 41 hearts, the underlying narrowing at the site of rupture was the maximal narrowing along the course of the culprit artery; in 47 hearts, it was not (Table 4). The mean difference in luminal area narrowing between the rupture site (excluding thrombus) and the other maximal narrowing site was 18% both for positive and negative delta (Table 4).
The maximal luminal narrowing was present in the culprit artery (that with the plaque rupture) in only 36% of hearts. The mean maximal narrowing in the non-culprit artery was
81% ± 14 vs. 77% ± 14 in the culprit artery (p = .06 paired T test).
In 67 hearts with any TCFAs, 49 hearts had ≥ TCFA in the
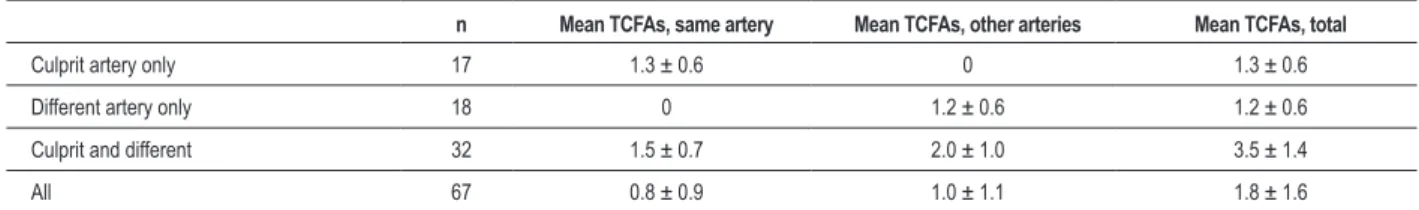
culprit artery with acute rupture; of these, 17 had TCFAs in other arteries as well, and 18 hearts had TCFAs only in non-culprit arteries (Table 5). The mean number of TCFAs in the
67 hearts with ≥ TCFA was 1.8 ± 1.6 SD (Table 5). Figures 2
and 3 shows a TCFA and a thick fibrous cap fibroatheroma, respectively.
The most common location for TCFA was the LAD and diagonals (54), followed closely by the right and posterior descending (52). There were 4 TCFAs in the left main, and 32 in the circumflex distribution.
In the culprit artery (that with the acute rupture), 32 TCFAs were proximal, and 29 distal to the rupture site. There was no significant difference in luminal area narrowing (Table 1). In 34% of the cases, the TCFA was the site of maximal stenosis, with 43% the area of maximal stenosis if proximal to the rupture site (Table 2).
In non-culprit arteries (those without the acute rupture), 36 were the site of maximal luminal narrowing, 21 were proximal to a stable plaque with maximal narrowing, and 24 were distal (Table 2). The relationship among stenosis at the TCFA site, maximal narrowing in either culprit and non-culprit arteries or the rupture site (non-culprit) is shown in Table 6. The sites of maximal stenosis in both culprit and non-culprit arteries and the stenosis at the rupture site were significantly narrower than the mean of percentage luminal narrowing at the TCFA sites (Table 6).
Discussion
The current study shows that less than 50% of acute ruptures occur at the site of maximal luminal narrowing, and that a similar proportion of TCFAs are present at sites of maximal stenosis in non-culprit arteries. These findings support angiographic studies that show that although segments narrowed >80% are most likely to occlude by presumed rupture, the less obstructive plaques give rise to more occlusions because of their much greater number15. In the
Table 2 - TCFAs in non-culprit arteries*
n % total Mean % narrowing Artery involved
Proximal to maximal stenosis 21 26 59 ± 19
LAD 6 LCX 6 RCA 9
Distal to maximal stenosis 24 30 52 ± 21
LAD 4 LCX 8 RCA 12
Site of maximal stenosis 36 44 75 ± 17
LM 1 LAD 11 LCX 11 RCA 13
Total 81 100 64 ± 21
*Only TCFA with greatest narrowing proximal per artery included; TCFA - thin cap ibroatheroma; LAD - left anterior descending; LCX - left circumlex; RCA - right coronary artery; LM - left main.
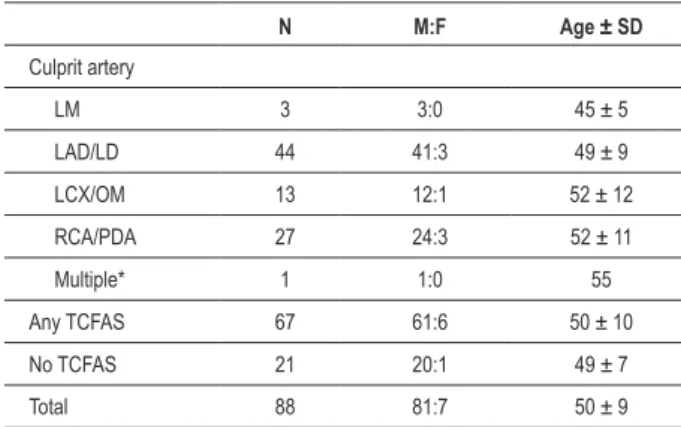
Table 3 - Demographic data of all patients by culprit artery and
frequency of thin-cap ibroatheroma
N M:F Age ± SD
Culprit artery
LM 3 3:0 45 ± 5
LAD/LD 44 41:3 49 ± 9
LCX/OM 13 12:1 52 ± 12
RCA/PDA 27 24:3 52 ± 11
Multiple* 1 1:0 55
Any TCFAS 67 61:6 50 ± 10
No TCFAS 21 20:1 49 ± 7
Total 88 81:7 50 ± 9
*An occlusive thrombus in the PLAD was used for subsequent data analysis; there was also a non-occlusive thrombus in the right coronary; LM = left main; LAD/LD = left anterior descending or left diagonal; LCx/OM = left circumlex or obtuse marginal; RCA/PDA = right coronary artery or posterior descending artery; TCFA = thin cap ibroatheroma.
Table 4 - Plaque ruptures, relationship of underlying luminal narrowing with maximal stenosis in culprit artery
n % of total underlying rupture site% narrowing, underlying rupture site% narrowing, Arteries
Rupture max. narrowing
(underlying plaque) 41 47 81 ± 14 81 ± 14
LAD 17 RCA 14 LCX 9
LM 3
Rupture not maximal
narrowing 47 53 65 ± 14 65 ± 14
LAD 28 RCA 13 LCX 4
LAD - left anterior descending and diagonals; RCA - right coronary artery and posterior descending; LCX - left circumlex and marginal branches; LM - left main.
morphology need to be assessed by imaging methods. Our findings that TCFA is present in areas of less than maximum stenosis is similar to angiographic and necropsy studies that
have shown that the risk of plaque rupture correlates only weakly with the degree of luminal narrowing16.
TCFAs are distributed, in our study, fairly uniformly throughout the coronary arteries, and only 18 of 67 hearts showed TCFAs only in non-culprit arteries, but that 50 of 67 showed some TCFAs in non-culprit arteries. We also demonstrate that the numbers of TCFAs proximal and distal to the culprit lesion was similar. Furthermore, only 44% of TCFAs in non-culprit arteries represented the sites of maximal narrowing, and those TCFAs that were not at sites of maximal narrowing were evenly distributed proximally and distally. These data suggest that by percent stenosis, it would be difficult to locate TCFAs angiographically, due to their random distribution throughout the coronary circulation.
The majority of coronary thrombi are associated with plaque rupture, of which TCFA is generally considered the precursor lesion16. Although TCFA is synonymous with the
concept of a “vulnerable plaque” in angiographic and autopsy studies, the plaque progression mechanism is complex, and may involve both local and systemic factors17,18. Although most,
Table 5 - Frequency and location of TCFA in hearts with any TCFAs
n Mean TCFAs, same artery Mean TCFAs, other arteries Mean TCFAs, total
Culprit artery only 17 1.3 ± 0.6 0 1.3 ± 0.6
Different artery only 18 0 1.2 ± 0.6 1.2 ± 0.6
Culprit and different 32 1.5 ± 0.7 2.0 ± 1.0 3.5 ± 1.4
All 67 0.8 ± 0.9 1.0 ± 1.1 1.8 ± 1.6
TCFA - thin cap ibroatheroma.
Figure 1 -Acute plaque rupture, left anterior descending coronary artery. Low magniication showing acute occlusive thrombus overlying atheroma with rupture on shoulder
(arrow, main igure and inset) and communication of the thrombus with atheroma core. Hematoxylin and eosin, original magniication 20x.
The definition of thin cap is derived from previous findings that determined that >95% of ruptured plaques had areas of cap thinning to at least 65 microns1. The necrotic core
of TCFAs is usually large, and the thinned cap is densely infiltrated by macrophages5.Vulnerable plaques are generally
characterized as those having a thin inflamed fibrous cap over a very large lipid core. However, only a small percentage of such plaques get ruptured, and the identifying characteristics of TCFAs that progress to rupture are unknown22. The current
study corroborates previous findings that plaques that may be prone to rupture occur proximally and in a similar distribution as acute plaque rupture3,4,23,24. The coronary distribution of
fibrous-cap atheromas has been shown similar to those of TCFAs and plaque ruptures3.
The current study shows that TCFA are located close to rupture sites (either proximally or distally in similar proportions) in culprit coronaries, but in a significant number of cases, they were also located in other non-culprit coronary segments. This study corroborates findings of location and distribution of TCFA in the coronary tree. Kolodgie et al3 also found that
the majority of TCFA, ruptures and healed ruptures occur in the proximal LAD.
The number of TCFA found in our study represents only a small percentage of area and length when the whole coronary tree is used as denominator. Another whole heart autopsy study also identified that ruptures and TCFA accounted only for 1.6% and 1.2%, respectively, of the total length of the coronary tree in a population dying of cardiovascular causes2.
These represent a smaller portion than those identified the current study, but a difference in population selection is noted, since our study included only sudden unexpected deaths. Furthermore, the frequency of acute ruptures and TCFA in sudden coronary death varies with risk factors, age and gender25. Our study had an intrinsic male bias, precluding
gender comparison, but there was no age difference among patients with TCFA and those without.
The goal of newer imaging studies is to image not only the lumen but the characteristics of the plaque in order to identify those prone to rupture25. Intravascular ultrasound (IVUS) can
Table 6 - Relationship between stenosis at TCFA site vs. maximal narrowing and rupture site narrowing Percent luminal narrowing, mean ± S.D.
Site Culprit artery Non-culprit arteries
TCFA with maximal stenosis 61.0 ± 22.6 63.6 ± 20.9
Maximal stenosis, any plaque type 74.3 ± 17.4* 71.7 ± 17.2**
Rupture site 70.0 ± 15.1*** N/A
* p = .0007 vs TCFA; ** p = .002 vs TCFA; *** p = .006 vs TCFA; N/A - not applicable. TCFA - thin-cap ibroatheroma. SD - standard deviation.
Figure 2 -Thin cap ibroatheroma (TCFA) left anterior descending artery. Note thread like ibrous cap separating necrotic core (NC) from coronary lumen. (arrow).
presence of calcification and amount of fibrous tissue, but it fails to provide quantification of specific plaque composition26,27. A
more recent approach called virtual histology IVUS (VH-IVUS) has been used in the attempt to characterize plaques in vivo. Nakamura et al28 studied non-culprit segments in patients with
stable angina and acute coronary syndrome and found, similar to our study, a large number of presumed TCFA in non-culprit segments of patients with acute coronary syndrome. IVUS cannot, however, identify specific plaque components, which can be assessed by near infrared spectroscopy7. Moreno et al29
reported a sensitivity and specificity of 77 and 93% for TCFA when compared to histological assessment in post-mortem coronary segments of patients with acute coronary events. Lastly, computed tomography-based techniques such as multidetector-row CT and optical coherence tomography are promising new methods of evaluating atherosclerotic plaque and its composition13,30. Similar to our results, an autopsy
study using optical coherence tomography found that 64% patients with acute coronary syndrome had 1 or more TCFAs. The authors concluded that TCFAs, clustering in the proximal segments of the 3 major epicardial coronary arteries, are a common finding in unselected autopsy subjects10.
In conclusion, a large number of TCFAs occur in regions proximal and distal to culprit plaques (ruptures) and at sites away from these lesions. These TCFAs occur at sites of maximum luminal narrowing at a similar rate to ruptures, namely between 40 and 50%. Therefore, luminal narrowing cannot be taken as a reliable angiographic marker for assessment of patient’s risk, and further autopsy and angiographic studies are needed in order to establish the subset of TCFAs that are “vulnerable”.
Potential Conflict of Interest
No potential conflict of interest relevant to this article was reported.
Sources of Funding
There were no external funding sources for this study.
Study Association
This study is not associated with any post-graduation program.
References
1. Burke AP, Farb A, Malcom GT, Liang YH, Smialek J, Virmani R. Coronary risk factors and plaque morphology in men with coronary disease who died suddenly. N Engl J Med. 1997; 336: 1276-82.
2. Cheruvu PK, Finn AV, Gardner C, Coplan J, Goldstein J, Stone GW, et al. Frequency and distribution of thin-cap fibroatheroma and ruptured plaques in human coronary arteries: a pathologic study. J Am Coll Cardiol. 2007; 50: 940-9.
3. Kolodgie FD, Burke AP, Farb A, Gold HK, Yuan J, Narula J, et al. The thin-cap fibroatheroma: a type of vulnerable plaque: the major precursor lesion to acute coronary syndromes. Curr Opin Cardiol. 2001; 16: 285-92.
4. Kolodgie FD, Virmani R, Burke AP, Farb A, Weber DK, Kutuys R, et al. Pathologic assessment of the vulnerable human coronary plaque. Heart. 2004; 90: 1385-91.
5. Virmani R, Burke AP, Kolodgie FD, Farb A. Pathology of the thin-cap fibroatheroma: a type of vulnerable plaque. J Interv Cardiol. 2003; 16: 267-72.
6. Cademartiri F, La Grutta L, Palumbo A, Maffei E, Aldovrandi A, Malago R, et al. Imaging techniques for the vulnerable coronary plaque. Radiol Med. 2007; 112: 637-59.
7. Caplan JD, Waxman S, Nesto RW, Muller JE. Near-infrared spectroscopy for the detection of vulnerable coronary artery plaques. J Am Coll Cardiol. 2006; 47: C92-6.
8. Hosokawa R, Kambara N, Ohba M, Mukai T, Ogawa M, Motomura H, et al. A catheter-based intravascular radiation detector of vulnerable plaques. J Nucl Med. 2006; 47: 863-7.
9. Kubo T, Akasaka T. Recent advances in intracoronary imaging techniques: focus on optical coherence tomography. Expert Rev Med Devices. 2008; 5: 691-7.
10. Kume T, Okura H, Yamada R, Kawamoto T, Watanabe N, Neishi Y, et al. Frequency and spatial distribution of thin-cap fibroatheroma assessed by 3-vessel intravascular ultrasound and optical coherence tomography. Circ J. 2009; 73: 1086-91.
11. Lerakis S, Synetos A, Toutouzas K, Vavuranakis M, Tsiamis E, Stefanadis C. Imaging of the vulnerable plaque: noninvasive and invasive techniques. Am
J Med Sci. 2008; 336: 342-8.
12. Miyamoto A, Prieto AR, Friedl SE, Lin FC, Muller JE, Nesto RW, et al. Atheromatous plaque cap thickness can be determined by quantitative color analysis during angioscopy: implications for identifying the vulnerable plaque. Clin Cardiol. 2004; 27: 9-15.
13. Ogasawara N, Komatsu S, Ropers D, Ropers U, Pfederer T, Kuhlmann A, et al. Detecting vulnerable plaque of arteriosclerosis obliterans by multidetector-row computed tomography--comparing with VH (virtual histology)-intravascular ultrasound. Int J Cardiol. 2008; 127: e33-5.
14. Sarno G, Vanhoenacker P, Decramer I, Schuijf JD, Pundziute G, Margolis P, et al. Characterisation of the “vulnerable” coronary plaque by multi-detector computed tomography: a correlative study with intravascular ultrasound-derived radiofrequency analysis of plaque composition. EuroIntervention. 2008; 4: 318-23.
15. Alderman EL, Corley SD, Fisher LD, Chaitman BR, Faxon DP, Foster DP, et al. Five-year angiographic follow-up of factors associated with progression of coronary artery disease in the Coronary Artery Surgery Study (CASS). CASS Participating Investigators and Staff. J Am Coll Cardiol. 1993; 22: 1141-54.
16. Falk E, Shah PK, Fuster V. Coronary plaque disruption. Circulation. 1995; 92: 657-71.
17. Naghavi M, Libby P, Falk E, Casscells SW, Litovsky S, Rumberger J, et al. From vulnerable plaque to vulnerable patient: a call for new definitions and risk assessment strategies: Part I. Circulation. 2003; 108: 1664-72.
18. Ambrose JA. In search of the “vulnerable plaque”: can it be localized and will focal regional therapy ever be an option for cardiac prevention? J Am Coll Cardiol. 2008; 51: 1539-42.
19. Farb A, Burke AP, Tang AL, Liang TY, Mannan P, Smialek J, et al. Coronary plaque erosion without rupture into a lipid core: a frequent cause of coronary thrombosis in sudden coronary death. Circulation. 1996; 93: 1354-63.
21. Virmani R, Burke AP, Farb A. Plaque rupture and plaque erosion. Thromb Haemost. 1999; 82 (Suppl 1): 1-3.
22. Fishbein MC. The vulnerable and unstable atherosclerotic plaque. Cardiovasc Pathol. 2008 Sep. 30. [Epub ahead of print].
23. Virmani R, Burke AP, Farb A, Kolodgie FD. Pathology of the unstable plaque. Prog Cardiovasc Dis. 2002; 44: 349-56.
24. Virmani R, Burke AP, Farb A, Kolodgie FD. Pathology of the vulnerable plaque. J Am Coll Cardiol. 2006; 47: C13-8.
25. Burke AP, Virmani R, Galis Z, Haudenschild CC, Muller JE. 34th Bethesda Conference: Task force #2--What is the pathologic basis for new atherosclerosis imaging techniques? J Am Coll Cardiol. 2003; 41: 1874-86.
26. Palmer ND, Northridge D, Lessells A, McDicken WN, Fox KA. In vitro analysis of coronary atheromatous lesions by intravascular ultrasound; reproducibility and histological correlation of lesion morphology. Eur Heart J. 1999; 20: 1701-6.
27. Nair A, Kuban BD, Tuzcu EM, Schoenhagen P, Nissen SE, Vince DG. Coronary plaque classification with intravascular ultrasound radiofrequency data analysis. Circulation. 2002; 106: 2200-6.
28. Nakamura T, Kubo N, Funayama H, Sugawara Y, Ako J, Momomura SI. Plaque characteristics of the coronary segment proximal to the culprit lesion in stable and unstable patients. Clin Cardiol. 2009; 32 (8): E9-12..
29. Moreno PR, Lodder RA, Purushothaman KR, Charash WE, O’Connor WN, Muller JE. Detection of lipid pool, thin fibrous cap, and inflammatory cells in human aortic atherosclerotic plaques by near-infrared spectroscopy. Circulation. 2002; 105: 923-7.