Abstract
Background: Supravalvar aortic stenosis (SVAS) is used to study overload-induced cardiac remodeling (CR). In this model, neither CR behavior since beginning stage nor the best parameters to identify ventricular dysfunction are clearly stated.
Objective: ) Characterizing, early and evolutively, morphological and functional modifications during CR in rats with SVAS and ) identifying the most sensitive index for detecting the moment when the diastolic and systolic dysfunction first appeared in the left ventricle (LV).
Methods: Wistar Rats were divided into two groups – control (CG, n=) and SVAS (SVASG, n=4) – and studied in post-surgical rd, 6th, th and 8th weeks. Hearts were analyzed by means of an echocardiogram (ECHO).
Results: By the end of the experiment, ratios between the LV, right ventricle and atria and the final body weight were increased in the SVASG. The ECHO showed that the left atrium underwent significant remodeling from the 6th on. The percent of endocardial shortening underwent significant drop as of the nd week and the percent of, as of the 8th week, in the SVASG. The ratio between E- wave and A-wave (E/A) was higher in CG compared to the SVASG in all events analyzed.
Conclusions: During the remodeling process, the left ventricle of rats with SVAS presented concentric hypertrophy, early diastolic dysfunction and improvement of systolic function, with posterior performance deterioration. Besides this, the study found out the most sensitive echocardiographic indexes for detecting systolic and diastolic dysfunction are, respectively, the ratio E/A and the percent of endocardial shortening. (Arq Bras Cardiol 00; 94() : 59-66)
Key Words: Aortic Stenosis, Supravalvular; Ventricular Remodeling; Echocardiography; Rats; Ventricular Dysfunction / Risk Assessment.
Mailing Address: Olga de Castro Mendes •
Faculdade de Medicina de Botucatu - UNESP - Depto de Clínica Médica - Rubião Júnior, S/N - 18618-000 - Botucatu, SP, Brasil
E-mail: [email protected]
Manuscript received November 5, 2008; revised manuscript received March 23, 2009; accepted June 5, 2009
Cardiac Remodeling: Serial Analysis and Indexes for Early Detection
of Ventricular Dysfunction
Olga de Castro Mendes
1,2, Dijon Henrique S. de Campos
1, Ricardo Luiz Damatto
1, Mário Mateus Sugizaki
1,2,
Carlos Roberto Padovani
1, Katashi Okoshi
1and Antônio Carlos Cicogna
1Departamento de Clínica Médica - Faculdade de Medicina FMB – UNESP1, Botucatu, Faculdades Integradas de Bauru2, Bauru, SP, Brasil
Introduction
Cardiac remodeling (CR) refers to an alteration in gene expression in response to an aggression, resulting in molecular changes, cellular changes and myocardial interstitial alterations, expressed in variations of the heart size, shape and function1.
This is also a mechanism in adaptation to hemodynamic overload, allowing the heart to keep its functions in view of load increase2-4. This is deemed as a risk factor for development
of ventricular dysfunction and heart failure (HF)5.
Several experimental models have been proposed for the study of CR due to pressure overload, such as supravalvar aortic stenosis (SVAS) in rats6-8. When young animals are
subject to aortic constriction, pressure overload is low at the beginning, being increased proportionally with their growth. SVAS advantages are: gradual development of CR, associated
in short term to the improvement of systolic function; absence of severe lesions in myocardial anatomy; and low maintenance cost9. Around the 20th week of SVAS, deterioration of systolic
performance and HF10-13 begin. This model is partially similar
to SVAS in men11.
Experiments in our lab with rats with SVAS assessed morphological and functional cardiac aspects, by means of echocardiogram (ECHO), in different periods of CR, finding out supranormal systolic function in 6th or 8th week4,9,12,
diastolic dysfunction as of the 12nd week9 and deterioration
of systolic performance in the 21st week. This last group of
animals also had signs of heart failure9. Some authors, using
hemodynamic evaluation, verified increase in left ventricular end-diastolic pressure after the 6th week – in contrast,
evaluation of diastolic function by means of ECHO has been found inaltered13. Litwin et al8 assessed rats with SVAS by
means of ECHO during 6th, 12th and 18th weeks, and observed
diastolic dysfunction as of the 6th week and deterioration of
systolic performance in the 18th week.
morphological and functional modifications during CR in rats with SVAS targeting on identifying the most sensitive index for detecting the moment when left ventricular diastolic and systolic dysfunction first appeared.
Method
Experimental procedures were approved by the Ethics Committee on Animal Research of the Medicine School of Botucatu - UNESP, on October 19th, 2005, under no.
506/2005.
Animals and experimental protocol
37 Wistar male young rats were used, obtained from the Animal Room of the Medical Clinic Department of Medicine School of UNESP – Botucatu, State of São Paulo, which were divided into two groups: control group (CG,n=13) and supravalvar aortic stenosis group (SVASG , n=24). The SVASG was subject to surgery with implantation of a clip in aorta artery for induction of SVA. The CG was subject to the same surgery, albeit with no implantation of clip. Five animals were kept in each box, at ambient temperature of 23°C, with 12-hour light cycles, fed with standard animal food Purina®
and ad libitum water.
Animals were studied in 3rd, 6th, 12th and 18th
post-surgical weeks. These periods are suitable to observing morphological and functional alterations in rats with SVA and precede appearance of HF, which takes place around the 20th week9,10,13.
By the end of the experiment, HF signs were sought, and the presence of tachypnea was considered an exclusion criterion when associated to one of the following signs: oedema, ascites, pleuro-pericardial effusion, thrombus in left atrium (LA) and right ventricular (RV) hypertrophy14.
By the end of the 18th week, animals were anesthetized
with sodium pentobarbital, (50 mg/kg), intraperitoneal, and beheaded. Then, a cardiac morphological analysis was performed.
Induction of supravalvar aortic stenosis
The SVAS was inducted according to method used in our lab4,12. Animals, weighing from 70 to 90 g, after anesthetized
with ketamine chloride (60 mg/kg) and xylazine chloride (10 mg/kg), intraperitoneal, were subject to median thoracotomy. The ascending aorta was dissected and a silver clip, with 0.6 mm of internal diameter, was placed approximately 3 mm apart from the aortic root. The CG’s animals were subject to the same surgery, albeit with no implantation of clip.
Echocardiographic Assessment
Heart’s function and structure were analyzed by means of ECHO according to methodology used in our lab4,9,10,14.
Animals were anesthetized with ketamine chloride (50 mg/kg) and xylazine chloride (1 mg/kg), intraperitoneal. A M-mode echocardiograph (Philips, HDI 5000 model) was used,
equipped with a 12 MHz electronic transducer. The following LV morphological parameters were assessed: left ventricular diastolic diameter (LVDD) and left ventricular systolic diameter
(LVSD), posterior wall diastolic thickness and posterior wall systolic thickness (PWDT and PWST); interventricular septum diastolic thickness and interventricular septum systolic thickness (IVSDT and IVSST); and left ventricular mass (LV MASS). The LV mass index (LVMI) was determined by normalizing LV mass in view of the body weight (BW). The LV relative wall thickness (LVRWT) was obtained using the formula (2x PWDT)/LVDD.
The LV systolic function was determined by the percent of
endocardial shortening (∆D endo) and the midwall fractional shortening (∆D mid), and the speed of shortening of the LV
posterior wall (LVPW), cardiac output (CO) and cardiac index
(CI). The ∆D mid was calculated using the formula ({[(LVDD +
½ PWDT + ½ IVSDT) – (LVSD + ½ PWST + ½ IVSST)]/(LVDD + ½ PWDT + ½ IVSDT )}); the LVPW was determined by the maximum tangent of the posterior wall systolic movement; the CO using the formula [(LVDD ³ - LVSD³) x heart rate; and the CI by means of the ratio between the CO and the BW .
The diastolic function was assessed by E-waves and A, ratio between E-waves and A-wave (E/A), E-wave deceleration times (WDT) and the LV isovolumetric relaxation time (LV-IVRT)15,16.
Morphological analysis
Morphological variables to characterize animals were: final body weights (FBW) of LV, RV, atria (AT’s) and the ratios LV/FBW, RV/FBW and AT’s/FBW.
Statistical analysis
Morphological parameters were analyzed using the Student’s t-test, when the variable has shown adherence to the normal probability distribution, and using the Mann-Whitney test, when this characteristic was absent. For group comparisons in evolutive process, the analysis of variance (ANOVA) method of recurrent measures in two independent groups, supplemented by Bonferroni multiple comparison procedure. For the A-wave variable, the statistical procedure considered the non-parametric technique. In their turn, other variables were analyzed using the parametric technique17. For
all tests, 5% (p<0.05) was the significance level fixed. Graphs show average results and standard error. Statistical calculations where made using statistical analysis software SigmaStat 3.5 for Windows version (Copyright© 2006, Systat Software Inc.).
Results
By the end of the experiment, out of 24 SVASG’s rats, 10 died (41.6%) and 2 developed HF (14.28%), and were excluded from the study. There were 2 deaths in the CG (15.4%). Thus, studied groups consisted of 11 animals in the CG and 12 in the SVASG. Mortality found is similar to rates found by other authors, who found rates ranging from 30 to 49%5,7,12,13.
General characteristics
Initial weight of rats did not change: 82±5 g for the CG and 85±5 g for the SVASG. Body weight evolutive analysis has shown that the CG has had higher rate than the SVASG only in the 12th week, with a tendency to being superior in
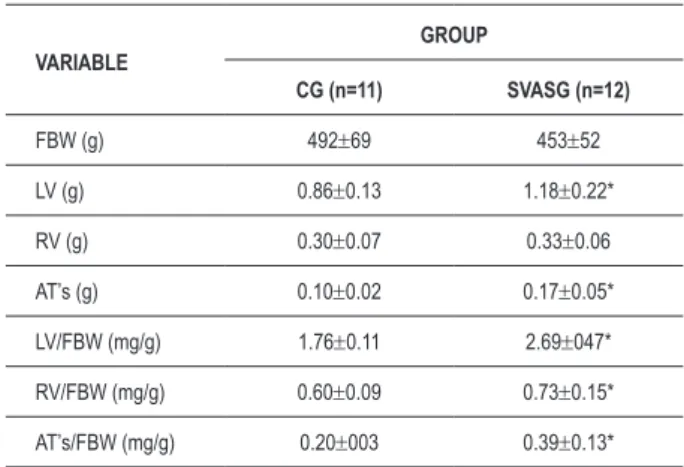
Table 1 – General characteristics of rats by the end of the experimental period
VARIABLE
GROUP
CG (n=11) SVASG (n=12)
FBW (g) 492±69 453±52
LV (g) 0.86±0.13 1.18±0.22*
RV (g) 0.30±0.07 0.33±0.06
AT’s (g) 0.10±0.02 0.17±0.05*
LV/FBW (mg/g) 1.76±0.11 2.69±047*
RV/FBW (mg/g) 0.60±0.09 0.73±0.15*
AT’s/FBW (mg/g) 0.20±003 0.39±0.13*
Average values±standard deviation. CG - control group; SVASG - aortic stenosis
group; FBW - inal body weight; LV - left ventricle; RV - right ventricle; AT’s - atria; n - number of animals. Student’s t-test for single samples; * p<0.05 vs CG.
the end of the experiment are shown in Table 1. The LV’s and AT’s weights and the ratios LV/FBW, RV/FBW and AT’s/FBW have increased in SVASG.
Echocardiographic assessment of the heart’s structural parameters
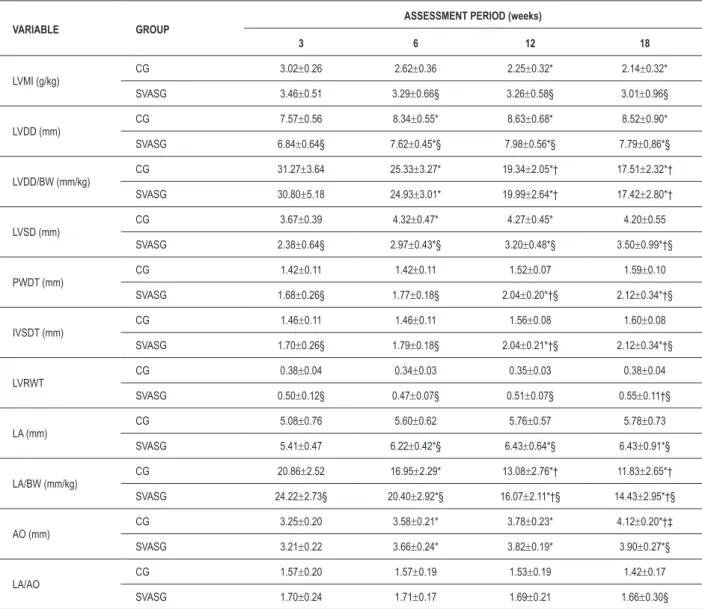
Table 2 shows the heart’s sequential structural assessment by ECHO. The LVMI has decreased in the CG’s animals in 12th and 18th weeks, compared to the 3rd week, and has not
changed in the SVASG. The highest index has been found in the SVASG vis-à-vis the CG as of the 6th week, although,
already in the 3rd week, there were tendency to be increased
in the SVASG (p=0.058). The LVDD was equal in the 6th,
12th and 18th weeks, higher to the diameter found in the 3rd
week in both groups. This variable was smaller in the SVASG when compared to the CG. The ratio LVDD/BW in the CG and in the SVASG was higher during the 3rd week versus the
other weeks. 12th and 18th weeks had a ratio inferior to the
6th week’s one. No difference was found between the groups.
The LVSD was higher in the 6th and 12th weeks versus the 3rd
in the CG. In its turn, the LVSD increased during 6th, 12th and
18th weeks in the SVASG compared to the 3rd week. The 18th
week was different from the 6th week. The LVSD was smaller
in the SVASG compared to the CG.
The PWDT and IVSDT did not present changes in the CG over the experiment’s period; they changed in moments 12 and 18 in relation to moments 3 and 6 in the SVASG’s animals. These parameters were higher in the SVASG versus the CG at all times. The LVRWT did not change in the CG. The 18th
week was different from the 6th week in the SVASG. This
variable was higher in the SVASG compared to the CG in all weeks. There was no change of LA in the CG, although there was tendency to be higher in the 12th (p=0.075) and 18th
(p=0.063) weeks versus the 3rd week. In the SVASG, the LA
was higher as of week 6, and there was no posterior change. The LA presented higher values in the SVASG than in the CG as of the 6th week. The ration LA/BW was smaller in the 6th, 12th
and 18th weeks – smaller than in week 6 in both groups when
compared to the 3rd, and to the 12th and 18th weeks. This ratio
was higher in the SVASG than in the CG in all periods. The AO in the CG over the 6th and 12th weeks was different from the
3rd week. The 18th week was different from all others. In the
SVASG, the 6th, 12th and 18th weeks were higher than the 3rd
week. This variable was smaller in the SVASG versus the CG over the 18th week. There was no variation in the LA/AO ratio
between the different moments in both groups. Although the SVASG had presented increase of the LA/AO ratio vis-à-vis the CG, there was tendency of the SVASG’s values to the higher than the GC’s ones (0.07>p<0.13) only in the 18th week.
AO’s absolute and relative data have shown that this chamber underwent significant remodeling as of the 6th week.
Echocardiographic assessment of the left ventricle systolic and diastolic functions
Tables 3 and 4 describe, respectively, the CF and the parameters for the LV systolic and diastolic function assessment. Differences in the CF between groups and moments have not
been found. There was no difference in ∆D endo and ∆D mid in view of the time in the CG. In the SVASG, the ∆D endo of
the 12th week was smaller than the 3rd week’s one and higher
than the 18th week’s one, smaller that the 3rd and 6th weeks. The ∆D mid in the SVASG was smaller in the 18th week versus
3rd and 6th. The ∆D endo and ∆D mid were higher in the
SVASG than in the CG at all times, except for the 18th week, in which the ∆D mid was equal in both groups (Table 3). In Figures 1 and 2, it may be seen that, while the ∆D endo and ∆D mid did not change in the CG, there was drop in these two
indexes in the SVASG during the process evolution, becoming significant after the 12th week in the ∆D endo, and in the ∆D
mid during the 18th week.
The LVPW, when assessed between groups, has been found significantly higher in the 18th week versus 3rd and 6th weeks
in the CG, and unaltered in the SVASG. There was reduction of LVPW in the SVASG compared to the CG during the 18th
week. CO increased in the 12th and 18th weeks versus the 3rd one in the CG, with tendency to be higher in the 6th week
versus the 3rd one (p=0.083). In the SVASG, the 6th, 12th
and 18th weeks were higher than the 3rd week. There was difference of CO between the groups only in the 18th week,
and this was smaller in the SVASG. The CI decreased in the 12th and 18th weeks in the CG versus the previous weeks. In
the SVASG, the 18th week had smaller values than the 3rd
and 6th weeks’ ones. There was tendency of the 12th week to
have smaller values that the 6th week’s ones (p=0.069). No
difference was found between the groups (Table 3).
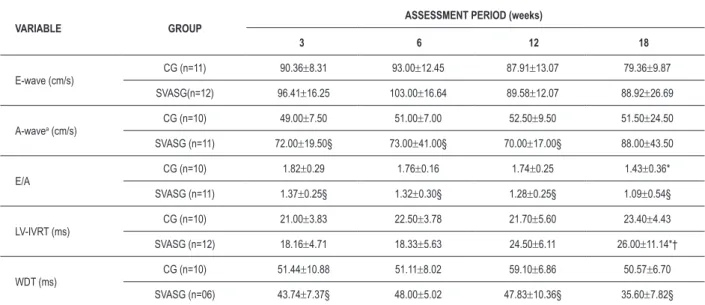
In the CG and SVASG (Table 4), E-wave and A-wave have not presented alterations in different periods of the assessment. While the E-wave was equal in group comparison, the A-wave was higher in the SVASG than in the CG at all periods. The E/A ration presented decrease in the CG during the 18th week
versus the 3rd one, with tendency to be smaller in the 18th
week versus the 6th (p=0.067) and the 12th (p=0.095) weeks.
In the SVASG, difference between moments was not found, with tendency to difference between the 3rd and 18th weeks
Table 2 – Echocardiographic assessment of the heart’s structural parameters
VARIABLE GROUP
ASSESSMENT PERIOD (weeks)
3 6 12 18
LVMI (g/kg)
CG 3.02±0.26 2.62±0.36 2.25±0.32* 2.14±0.32*
SVASG 3.46±0.51 3.29±0.66§ 3.26±0.58§ 3.01±0.96§
LVDD (mm)
CG 7.57±0.56 8.34±0.55* 8.63±0.68* 8.52±0.90*
SVASG 6.84±0.64§ 7.62±0.45*§ 7.98±0.56*§ 7.79±0,86*§
LVDD/BW (mm/kg)
CG 31.27±3.64 25.33±3.27* 19.34±2.05*† 17.51±2.32*†
SVASG 30.80±5.18 24.93±3.01* 19.99±2.64*† 17.42±2.80*†
LVSD (mm)
CG 3.67±0.39 4.32±0.47* 4.27±0.45* 4.20±0.55
SVASG 2.38±0.64§ 2.97±0.43*§ 3.20±0.48*§ 3.50±0.99*†§
PWDT (mm)
CG 1.42±0.11 1.42±0.11 1.52±0.07 1.59±0.10
SVASG 1.68±0.26§ 1.77±0.18§ 2.04±0.20*†§ 2.12±0.34*†§
IVSDT (mm)
CG 1.46±0.11 1.46±0.11 1.56±0.08 1.60±0.08
SVASG 1.70±0.26§ 1.79±0.18§ 2.04±0.21*†§ 2.12±0.34*†§
LVRWT
CG 0.38±0.04 0.34±0.03 0.35±0.03 0.38±0.04
SVASG 0.50±0.12§ 0.47±0.07§ 0.51±0.07§ 0.55±0.11†§
LA (mm)
CG 5.08±0.76 5.60±0.62 5.76±0.57 5.78±0.73
SVASG 5.41±0.47 6.22±0.42*§ 6.43±0.64*§ 6.43±0.91*§
LA/BW (mm/kg)
CG 20.86±2.52 16.95±2.29* 13.08±2.76*† 11.83±2.65*†
SVASG 24.22±2.73§ 20.40±2.92*§ 16.07±2.11*†§ 14.43±2.95*†§
AO (mm)
CG 3.25±0.20 3.58±0.21* 3.78±0.23* 4.12±0.20*†‡
SVASG 3.21±0.22 3.66±0.24* 3.82±0.19* 3.90±0.27*§
LA/AO
CG 1.57±0.20 1.57±0.19 1.53±0.19 1.42±0.17
SVASG 1.70±0.24 1.71±0.17 1.69±0.21 1.66±0.30§
Average values±standard deviation. CG (n=11): control group; SVASG (n=12): aortic stenosis group; LV: left ventricle; LVMI: mass index; LVDD and LVSD: systolic and
diastolic diameters; BW: body weight; PWDT: posterior wall diastolic thickness; LVRWT: relative thickness; IVSDT: interventricular septum diastolic thickness; AO: aortic diameter; LA: left atrium diameter. Signiicant differences - *: vs week 3; †: vs week 6; ‡: vs week 12; §: vs CG; ANOVA supplemented by Bonferroni’s test; p<0.05.
in the 18th week versus the 3rd and 6th weeks. No difference
was found between the groups. The WDT was similar in the CG. In the SVASG, there was tendency to difference between the 6th and 18th weeks (pp=0.058) and between the 12th and
18th weeks (p=0.063). The WDT was smaller in the SVASG
during moments 3, 12 and 18 versus the CG.
Discussion
Cardiac morphology and function were assessed in this study during the remodeling process in rats subject to SVAS. Remodeling occurs as a response to this aggression and may cause ventricular dysfunction. The main criterion for diagnosis of this functional alteration in experimental studies have been the LV end diastolic pressure, assessed using hemodynamic method18. However, determining this
pressure requires an invasive process, a fact that jeopardizes long-term studies. Besides this, the LV’s characterization may bring damages to aortic valve or affect the cardiac performance19.
The ECHO represents an alternative for the ventricular function study and may provide important information on the rodent’s cardiac performance19. It allows to assess the cardiac
morphology and function8,19-21, the evolution of the ventricular
dysfunction caused by different types of aggression22 and
the effects of different interventions13,23. It is a versatile, safe,
painless, non-invasive method, which is also important to in vivo serial analysis24.
Table 3 – Echocardiographic assessment of the left ventricle systolic function
VARIABLE GROUP
ASSESSMENT PERIOD (weeks)
3 6 12 18
HR (bpm)
CG 328±49 311±34 284±28 327±66
SVASG 340±47 327±46 300±25 345±48
∆D endo (%) CG 51.66±2.13 48.20±4.17 50.44±4.17 50.35±3.00
SVASG 65.41±7.81§ 61.05±5.04§ 59.83±5.74*§ 55.65±9.20*†§
∆D mid (%) CG 31.29±2.43 29.71±3.51 31.08±3.81 31.41±2.35
SVASG 37.52±5.08§ 37.07±2.64§ 34.60±3.40§ 31.60±4.75*†
LVPW (mm/s)
CG 38.26±4.35 39.57±3.58 42.95±7.70 45.87±5.56*†
SVASG 38.29±7.72 38.97±6.70 40.05±8.31 39.94±9.75§
CO (ml/min)
CG 125.81±21.64 156.01±30.67 160.62±32.19* 185.01±40.26*
SVASG 104.45±27.42 136.99±29.87* 142.69±23.52* 147.84±40.91*§
CI (ml/min.g-1)
CG 0.52±0.08 0.47±0.09 0.36±0.06*† 0.38±0.07*†
SVASG 0.47±0.15 0.45±0.11 0.36±0.06* 0.33±0.09*†
Average values±standard deviation. CG (n=11) - control group; SVASG (n=12) - aortic stenosis group; HR - heart rate; LV - left ventricle; ∆D endo - percent of endocardial
shortening; ∆D mid - midwall fractional shortening; LVPW - posterior wall shortening speed; CO - cardiac output; CI - cardiac index. Signiicant differences - *: vs week 3; †: vs week 6; §: vs CG; ANOVA supplemented by Bonferroni’s test; p<0.05.
Table 4 – Echocardiographic assessment of the left ventricle diastolic function
VARIABLE GROUP
ASSESSMENT PERIOD (weeks)
3 6 12 18
E-wave (cm/s)
CG (n=11) 90.36±8.31 93.00±12.45 87.91±13.07 79.36±9.87
SVASG(n=12) 96.41±16.25 103.00±16.64 89.58±12.07 88.92±26.69
A-wavea (cm/s)
CG (n=10) 49.00±7.50 51.00±7.00 52.50±9.50 51.50±24.50
SVASG (n=11) 72.00±19.50§ 73.00±41.00§ 70.00±17.00§ 88.00±43.50
E/A
CG (n=10) 1.82±0.29 1.76±0.16 1.74±0.25 1.43±0.36*
SVASG (n=11) 1.37±0.25§ 1.32±0.30§ 1.28±0.25§ 1.09±0.54§
LV-IVRT (ms)
CG (n=10) 21.00±3.83 22.50±3.78 21.70±5.60 23.40±4.43
SVASG (n=12) 18.16±4.71 18.33±5.63 24.50±6.11 26.00±11.14*†
WDT (ms)
CG (n=10) 51.44±10.88 51.11±8.02 59.10±6.86 50.57±6.70
SVASG (n=06) 43.74±7.37§ 48.00±5.02 47.83±10.36§ 35.60±7.82§
Average values±standard deviation; CG (n=11): control group; SVASG (n=12): aortic stenosis group; E/A: ratio between peaks of speed of the initial illing low (E-wave) and
of the atrial contraction (A-wave) of the transmitral low; LV-IVRT: LV ‘s isovolumetric relaxation time; WDT: E-wave deceleration time. Signiicant differences - *: vs week 3; †: vs week 6; §: vs CG; ANOVA supplemented by Bonferroni’s test; a median±total semi-amplitude, Friedman for recurrent measures and Mann-Whitney; p<0.05.
the 12th week due to the increase of the rats’ body weight.
The LVMI kept stable in the SVASG. Insomuch as this parameter is not directly proportional to the body weight, the normalized values increase or decrease if there is weight loss or gain, respectively. Several parameters which indicate hypertrophy, such as PWDT, IVSDT and LVRWT, have
altered as of the 3rd week. The LVMI changed after the 6th
30 50 70
3 6 12 18
Weeks
E
ndoc
ardi
al
s
horteni
ng (%)
GC SVASG
*
* *†
*†‡
Figure 1 – Behavior of the percent of endocardial shortening (∆D endo) during
the assessment period. CG: control group; SVASG: aortic stenosis group. *:
vs CG ; †: vs week 3; ‡: vs week 6; ANOVA and Bonferroni’s test; p<0.05.
Average and standard error values.
50
40
30
20
M
id
w
a
ll
fr
a
c
ti
o
n
a
l
s
h
o
rt
e
n
in
g
(%
)
CG SVASG *
*
*
†
3 6 12 18
Weeks
Figure 2 – Behavior of the midwall fractional shortening (∆D mid) during
the assessment period. CG - control group; SVASG - aortic stenosis group.
* vs GC; †: vs week 3; ANOVA and Bonferroni’s test; p<0.05. Average and
standard error values.
Figure 3 – Behavior of the E/A ratio during the assessment period. CG - control
group (n=10); SVASG - aortic stenosis group (n=11). *: vs CG ; †: vs week 3; ANOVA and Bonferroni’s test; p<0.05. Average and standard error values.
0 0,5 1 1,5 2 2,5
E
/A
CG SVASG *
* *
*†
3 6 12 18
Weeks
In addition to the left ventricle hypertrophy, results show that the SVASG’s rats, in the event of being sacrificed, presented a hypertrophy of the right ventricle, assessed by means of ratio RV/BW. In spite of the heart failure diagnosis has been made by associating two clinical/morphological signs in this experiment, as described previously, the single ascertainment of increase in this ration does not mean the SVASG’s rats suffered from heart failure. However, atrium weight increase and the increase of this weight with the body weight have shown that the rats presented left ventricular dysfunction when they were being sacrificed.
The LV structural data, determined by ECHO or post-sacrifice, are similar to data of a number of studies which detected ventricular hypertrophy in different stages of CR post-induction of SVAS4,6,8,11,12. Values observed in the LVSD
different from those of the area’s bibliography, which has not found alteration of this variable in the SVASG after the 6th
week of SVAS induction4,19.
Development of left ventricular hypertrophy was an adaptative response to the intraventricular pressure elevation with the SVAS, as the increase of the wall thickness and the reduction of the cavity’s size may normalize the parietal stress and, consequently, the ventricular function. The concentric hypertrophy is a result of the increase of the myocytes’ diameter with little or no change in the cellular size26. Concomitantly, there are changes in the
proportions of myocardial interstitial components, including accumulation of collagen in ventricular musculature27,28.
Stimulus to CR happens due to mechanical and biochemical factors that act on receptors, ion channels and integrins present in sarcolemal membrane which, by activating biochemical citosolic signalizers, trigger increase of protein synthesis and alterations in gene expression2,12.
The analysis of LV systolic function showed improvement
of ∆D endo and ∆D mid in the SVASG versus the CG,
which underwent deterioration during remodeling process.
Significant drop of ∆D endo in the SVASG took place as of
the 12th week. In its turn, decrease of ∆D mid was significant
in the 18th week (Figures 1 and 2). In spite of these indexes
decrease along the time, they kept higher in the SVASG, except for the 18th week, in which ∆D mid was equal for both groups.
Although CO has been increased in these two groups between 3rd and 18th weeks, the elevation was smaller in the SVASG
than in the CG only in the 18th week. Another parameter
which helps to analyze the heart’s ejection fraction, taking into account the body weight for that purpose, obtaining CI scenario similar in both groups. Analysis of different indexes show that the most sensitive for detecting systolic dysfunction
was the ∆D endo, which detected a significant drop during
the 12th week. Other indicators were able to detect it only
later on, during the 18th week.
Studies assessing the LV systolic function sequentially, over the same periods of this experiment, (3rd, 6th, 12th and 18th
weeks) could not be found. Authors analyzing cardiac function in rats with SVAS after 6th, 12th and 18th weeks have found supranormal ∆D endo during the 6th week and smaller ∆D mid in all periods in relation to the CG. While the ∆D endo decreased, the ∆D mid remained stable between the 6th and
and 21st weeks has found drop in the percent of shortening
during the 21st week9.
Improvement of systolic function in the SVASG versus the CG must be linked to the development of concentric hypertrophy, normalization of systolic tension and maintenance of physiological limits of oxygen consumption of myocardial fibers2,16,19,29. Progressive loss of systolic function may be
connected with: 1) adverse geometrical remodeling of the cavity30,31; 2) alterations in the composition of the heart
muscle, with increase of the extracellular matrix and decrease in the number of myocytes,due to necrosis or apoptosis16,31;
3) compromising of the capacity to contract32 or 4) the
combination of these factors2,19,28.
Assessment of the diastolic performance showed the occurrence of early dysfunction in the SVASG compared to the CG. As of the 3rd week post-induction of the SVAS, there was increase of A-wave, reduction of E/A ratio and of E-wave deceleration time in the group with pressure overload (Table 4 and Figure 3). This piece of data shows that the drop in diastolic function precedes the drop in systolic function, which took place in the 12th week.
Experiments observing the diastolic function in the same periods of this research were not found. Litwin et al8
found out increase of E-wave in 6th, 12th and 18th weeks
and decrease of A-wave in the 18th week in the SVASG,
compared to the CG. E/A ratio was higher in the SVASG than in the CG in 12th and 18th weeks. Authors conclude that the
SVAS caused a restrictive diastolic dysfunction as of the 6th
week. Ribeiro et al9 verified increase of the E/A ratio as of
the 12th week in animals with SVAS. Comparative analysis
between reference studies and this experiment shows that, although diastolic dysfunction was a consistent and early factor for both, the behavior of the E/A ratio was different. While the E/A ratio decreased in this research, other authors found increase of this variable. Perhaps, this difference in results may be attributable to technical difficulties while obtaining good images for analysis of the Doppler effect and to the high heart rate of these animals, which tend to mix E and A waves, rendering diastolic function measurement difficult33,34.
In spite of the differences in the E/A ratio compared to the reference studies, the LA diameter alone has shown increase as of the 6th week and, when normalized by body
weight, has been found higher than the CG’s LA diameter since the 3rd week; the LA/AO ratio indicated tendency to
be higher in the SVASG as of the 3rd week (0.07<p>0.13).
Thus, remodeling of the LA during the 3rd or 6th week is
a result of the LV’s diastolic dysfunction, as the systolic performance has shown improvement in the SVASG compared to the CG in these two moments. These data is in accordance with the authors’ findings4,11 which ascertained
increase in this variable.
The worsening of the diastolic function found in this study may be connected with alteration of elastic properties and disturbances in intracellular calcium handling. Experimental studies have associated the increase of the myocardial rigidity in the SVAS with the increase of collagen fiber deposition29,35.
Alterations in proteins linked to intracellular calcium recovery, mainly the sarcoplasmic reticulum calcium pump, have also been related to the drop in diastolic performance in presence of SVAS29.
The study of the LV’s diastolic function is rather relevant as the alterations in filling of this cavity may precede systolic dysfunction36. Currently, the most viable and feasible way
to assess diastolic function is by analyzing transmitral flow speed during the initial stage of left ventricle’s diastolic filling, represented by E-wave, and of the ventricular filling during atrial contraction, expressed by A-wave. Values related to the E/A ration, the E-wave deceleration time and to the isovolumetric relaxation time (LV-IVRT)25 may be
found in a similar way. Upon observation of smaller E-wave and E/A ratio values, compared to the control group, there is suggestion of presence of diastolic dysfunction37. Another
way to determine the severity of diastolic dysfunction is by assessing the left atrium by means of echocardiograph38.
During ventricular diastole, the LA is directly exposed to intraventricular pressures through open mitral valve. Occasional rise in ventricular filling pressures may cause increase in volume and in atrial pressure38 and consequent
atrial remodeling.
Conclusion
After data found is examined, this study concludes that: 1) the left ventricle of rats with the SVAS, during remodeling process, presents concentric hypertrophy, early diastolic dysfunction and improvement of systolic function, with posterior performance deterioration; 2) the most sensitive echocardiographic indexes for detecting systolic and diastolic dysfunction are, respectively, the E/A ratio and the percent of endocardial shortening.
Potential Conflict of Interest
No potential conflict of interest relevant to this article was reported.
Sources of Funding
There were no external funding sources for this study.
Study Association
References
1. Cohn JN, Ferrarri R, Sharpe N. Cardiac remodeling-concepts and clinical implications: a consensus paper from an international forum on cardiac remodeling. J Am Coll Cardiol. 2000; 35: 562-82.
2. Cicogna AC, Okoshi MP, Okoshi K. História natural da remodelação miocárdica: da agressão aos sintomas. Rev Soc Cardiol Estado de São Paulo. 2000; 10: 8-16.
3. Olivetti G, Cigola E, Maestri R, Lagrasta C, Corradi D, Quaini F. Recent advances in cardiac hypertrophy. Cardiovasc Res. 2000; 45: 68-75.
4. Gonçalves G, Zornoff LAM, Ribeiro HB, Okoshi MP, Cordaro FRS, Okoshi K, et al. O bloqueio do sistema renina-angiotensina atenua a remodelação cardíaca de ratos submetidos a estenose aórtica.Arq Bras Cardiol. 2005; 84: 304-8.
5. Kaplan NM. Systemic hypertension: mechanisms and diagnosis. In: Braunwald E, Zipes DP, Libby P. eds. Heart disease: a textbook of cardiovascular medicine. Philadelphia: Saunders Company; 2001 p. 941-71.
6. Weinberg EO, Schoen FJ, George D, Kagaya Y, Douglas PS, Litwin SE, et al. Angiotensin-converting enzyme inhibition prolongs survival and modifies the transition to heart failure with pressure overload hypertrophy due ascending aortic stenosis. Circulation. 1994; 90: 1410-22.
7. Bruckschlegel G, Holmer SR, Jandeleit K, Grimm D, Muders F, Kromer EP, et al. Blockade of the renin-angiotensin system in cardiac pressure-overload hypertrophy in rats. Hypertension. 1995 ;25: 250-9.
8. Litwin SE, Katz SE, Weinberg EO, Lorell HB, Aurigemma GP, Douglas PS, et al. Serial echocardiographic-Doppler assessment of left ventricular geometry and function in rats with pressure overload hypertrophy chronic angiotensin-converting enzyme inhibition attenuates the transition to heart failure. Circulation. 1995; 91: 2642-54.
9. Ribeiro HB, Okoshi K, Cicogna AC, Bregagnollo EA, Rodrigues MAM, Padovani CR, et al. Estudo evolutivo da morfologia e função cardíaca em ratos submetidos a estenose aórtica supravalvar. Arq Bras Cardiol. 2003; 81: 562-8.
10. Moreira VO, Castro AVB, Yaegaschi MY, Cicogna AC, Okoshi MP, Pereira CA, et al. Critérios ecocardiográficos para definição de graus de disfunção ventricular em ratos portadores de estenose aórtica. Arq Bras Cardiol. 2006; 86: 432-8.
11. Mestrinel MA. Avaliação morfológica, bioquímica e funcional do remodelamento cardíaco desencadeado por sobrecarga pressórica em ratos com e sem insuficiência cardíaca congestiva. [dissertação]. Botucatu: Faculdade Medicina, Universidade Estadual Paulista; 2003.
12. Okoshi K, Ribeiro HB, Okoshi MP, Matsubara BB, Gonçalves G, Barros R, et al. Improved systolic ventricular function with normal myocardial mechanics in compensated cardiac hypertrophy. Jpn Heart J. 2004; 45: 647-56.
13. Bregagnollo EA, Okoshi K, Bregagnollo IF, Okoshi MP, Padovani CR, Cicogna AC. Effects of the prolonged inhibition of the angiotensin-converting enzyme on the morphological and functional characteristics of left ventricular hypertrophy in rats with persistent pressure overload.Arq Bras Cardiol. 2005; 84: 225-32.
14. Bregagnollo EA, Zornoff LAM, Okoshi K, Sugizaki M, Mestrinel MA, Padovani CR, et al. Myocardial contractile dysfunction contributes to the development of heart failure in rats with aortic stenosis. Int J Cardiol. 2006; 113: 188-93.
15. Momken I, Kahapip J, Bahi L, Badoual T, Hittinger l, Ventura-Clapier R, et al. Does angiotensin-converting enzyme inhibition improve the energetic status cardiac and skeletal muscles in heart failure induced by aortic stenosis in rats? J Mol Cell Cardiol. 2003; 33: 399-407.
16. Boluyt MO, O’Neil L, Meredith AL, Bing OHL, Brooks WW, Conrad CH, et al. Alterations in cardiac gene expression during the transition from stable hypertrophy to heart failure: marked upregulation of genes encoding extracellular matrix proteins. Circ Res. 1994;75:23-32.
17. Zar JH. Biostatistical analysis. 4th ed. New York: Prentice-Hall; 1995.
18. Tanaka N, Dalton N, Mao L, Rockman HA, Peterson KL, Gott-shall KR, et al. Tanaka N, Dalton N, Mao L, Rockman HA, Peterson KL, Gott-shall KR, et al.Tanaka N, Dalton N, Mao L, Rockman HA, Peterson KL, Gott-shall KR, et al. Transthoracic echocardiography in models of cardiac disease in the mouse. Circulation. 1996; 94: 1109-17.
19. Cantor EJF, Babick AP, Vasanji Z, Dhalla NS, Netticadan T. A comparative Cantor EJF, Babick AP, Vasanji Z, Dhalla NS, Netticadan T. A comparativeCantor EJF, Babick AP, Vasanji Z, Dhalla NS, Netticadan T. A comparative serial echocardiographic analysis of cardiac structure and function in rats subjected to pressure or volume overload. J Mol Cel Cardiol. 2005; 38: 777-86.
20. Paiva SAR, Zornoff LAM, Okoshi MP, Okoshi K, Matsubara LS, Matsubara BB, et al. Ventricular remodeling induced by retinoic acid supplementationVentricular remodeling induced by retinoic acid supplementation in adult rat. Am J Physiol Heart Circ Physiol. 2003; 284: H2242-6.
21. Bregagnollo EA, Mestrinel MA, Okoshi K, Carvalho FC, Bregagnollo IF,Bregagnollo EA, Mestrinel MA, Okoshi K, Carvalho FC, Bregagnollo IF, Padovani CR, et al. Papel relativo da remodelação geométrica do ventrículo esquerdo, morfológica e funcional do miocárdio na transição da hipertrofia compensada para a falência cardíaca em ratos com estenose aórtica supravalvar. Arq Bras Cardiol. 2007; 88: 225-33.
22. Satoh S, Ueda Y, Suematsu N, Oyama J, Kadokami T, Sugano M, et al. Beneficial effects of angiotensin–converting enzyme inhibition onBeneficial effects of angiotensin–converting enzyme inhibition on sarcoplasmatic reticulum function in the failing heart of the Dahl rat. Circ J. 2003; 67: 705-11.
23. Ono K, Masuyama T, Yamamoto K, Doi R, Sakata Y, Nishikawa N, et al. Echo Doppler assessment of left ventricular function in rats with hypertensive hypertrophy. J Am Soc Echocardiogr. 2002; 15: 109-17.
24. Saha DC, Saha AC, Malik G, Astiz ME, Rackow EC. Comparison of cardiovascular effects of tiletamine-zolazepam, pentobarbital, and ketamine-xylazine in male rats. J Am Assoc Lab Anim Sci. 2007; 46: 74-80.
25. Yang X, Liu Y, Rhaleb N, Kurihara N, Kim HE, Carretero, OA. Echocardiographic assessment of cardiac function in conscious and anesthetized mice. Am J Physiol Heart Cir Physiol. 1999; 277: 1967-74.
26. Rakusan K. Left ventricular hypertrophy alterations in myocite number, size, shape and struture. In: Scheridan DJ. (ed.) Left ventricular hypertrophy. London: Churchill Livingstone; 1998. p. 23-8.
27. Buccino RA, Haris S, Spann JF. Response of myocardial tissue to development of experimental hypertrophy. Am J Physiol. 1969; 216: 425-8.
28. Weber KT, Pick R, Jalil JE, Janicki JS, Carroll EP. Patterns of myocardial fibrosis.Weber KT, Pick R, Jalil JE, Janicki JS, Carroll EP. Patterns of myocardial fibrosis. J Mol Cell Cardiol. 1989; 21: 121-31.
29. Boluyt MO, Robinson KG, Meredith AL, Sem S, Lakatta EG, Crow MT, et Boluyt MO, Robinson KG, Meredith AL, Sem S, Lakatta EG, Crow MT, etBoluyt MO, Robinson KG, Meredith AL, Sem S, Lakatta EG, Crow MT, et al. Heart failure after long-term supravalvar aortic constriction in rats. Am J Hypertens. 2005; 18: 202-12.
30. Norton GR, Woodiwiss AJ, Gaash WH, Mela T, Chung ES, Aurigemma GP, et al. Heart failure in pressure overload hypertrophy: the relative roles of ventricular remodeling and myocardial dysfunction. J Am Coll Cardiol. 2002; 39: 664-71.
31. Mann DL. Mechanism and models in heart failure: a combinatorial approach. Circulation. 1999; 100: 999-1008.
32. Houser SR, Margulies KB. Is depressed myocite contractile centrally involved in heart failure? Circ Res. 2003; 92: 350-8.
33. Pritchett AM, Jacobsen SJ, Mahoney DW, Rodeheffer RJ, Bailey KR, Redfield MM. Left atrial volume as an index of left atrial size: a population-based study. J Am Coll Cardiol. 2003; 41: 1036-43.
34. Gelape CL, Sanches MD, Torres RM, Couto CA, Paixão PC, Melo JRC. Análise ecocardiográfica da função diastólica do ventrículo esquerdo após infarto do miocárdio em ratos. Rev Bras Cir Cardiovasc. 2005; 20: 63-8.
35. Jalil JE, Christian WD, Janick JS, Pick R, Shroff SG, Weber KT. Fibrillar collagen and myocardial stiffness in the intact hypertrophied rat left ventricle. Circ Res.1989; 64: 1041-50.
36. Jessup M, Brozena S. Heart failure. N Engl J Med. 2003; 348: 2007-18.
37. Mady C, Salemi VMC, Ianni BM, Ramires FJA, Arteaga E. Capacidade funcional máxima, fração de ejeção e classe funcional na cardiomiopatia chagásica: existe relação entre estes índices? Arq Bras Cardiol. 2005; 84: 152-5.