THE PURSUIT OF PRESTIGE:
THE DISTRIBUTION OF TALENTED
STUDENTS IN CHILE’S UNIVERSITIES
Carlos H. Wörner*
Recebido: ago. 2010 Aprovado dez. 2010
*Doctor en Física. Profesor Titular de la Facultad de Ciencias, Pontiicia Universidad Católica de Valparaíso.
Chile. E-mail cworner@ucv.cl
Resumo: Prestígio é um capital valorizado por instituições acadêmicas. Embora seja difícil de medir ou mesmo de estabelecer os seus componentes, não há dúvidas de que um corpus de estudantes talentosos é um dos ativos das instituições de ensino superior. Para a admissão dos alunos nas universidades do Chile, um sistema de avaliação nacional é utilizado e, portanto, as universidades concorrem
para captar os melhores alunos. Além disso, existem subsídios inanceiros estatais associados a esse atributo. O uso deste indicador de transferência inanceira como um meio de medir esta parte
da "riqueza" acadêmica das instituições é proposto. Ao utilizar o conhecido índice de Gini, a sua distribuição é analisada. Para efeito de comparação, também propõe-se o uso de outro indicador de
"riqueza" com base nos resultados oiciais de um processo de acreditação nacional. Os resultados
mostram um sistema claramente tendencioso medido pelos dois parâmetros mencionados, sem
qualquer correlação signiicativa entre si. Possíveis causas desse comportamento são discutidos
Palavras-chave: Educação Superior no Chile. Índice de Acreditação, Indice de Gini.
A BUSCA PELO PRESTÍGIO: A DISTRIBUIÇÃO DE ESTUDANTES TALENTOSOS NAS UNIVERSIDADES DO CHILE
Abstract: Prestige is a valued capital for academic institutions. Although it is dificult to measure it or even to
establish its components, there are no doubts that a talented corpus of students is one of the assets of higher education institutions. For students’ admission in Chilean universities, a national grading system is used and therefore, universities compete in capturing the best students. In addition, there
are state inanced subsidies associated to this attribute. The use of this inancial transfer indicator as
a mean to measure this portion of academic “wealth” of the institutions is proposed. By using the well known Gini index, its distribution is analyzed. For the sake of comparison, we also propose
the use of another “wealth” indicator based on the oficial results of a national accreditation process.
The results show a clearly biased system measured by the two before mentioned parameters with
no signiicant correlation within them. Possible causes for this behavior are discussed.
Key words: Chilean higher education. Accreditation index. Gini index.
INTRODUCTION
convoca y forma los talentos jóvenes más brillantes”1. This declarative objec-tive sometimes does not appear explicitly expressed in some university formal documents, but certainly it is an appreciated attribute of this type of institutions. Certainly, a subset of the category we call “prestige”, is the academic assets of its incoming students. It is not our purpose to discuss in this note the whole theme of excellence or prestige. A recent paper of Cyrene and Grant (2009) proposes a methodology that pretends to describe and quantify the factors that
inluence the prestige using as a case Canadian universities. With this declared
restriction, we will study the distribution of students’ academic wealth accord-ing to the capture of state subsidies associated to this attribute.
For the sake of introduction, let us mention the more cited index of income inequality, that is, the Gini index (GINI, 1921) widely applied to the distribu-tion of economic wealth. This distribudistribu-tion measured in different countries is a subject matter closely related to equality (or inequality) into each one of these societies. Obviously, it is not only an academic topic. It touches current society’s issues such as poverty, prosperity and in a last term, the society’s sustainability. In similar terms, apart from economy, the determination of the degree of concentration of a variable also appears in ecology, transport engi-neering, geography, etc.
On the educational side, Gini index has been used to describe class barriers in higher education (LYNCH; O’RIORDAN, 1998) and also it has been em-ployed to measure educational inequality, mainly by mean of years of scholarly
(THOMAS; WANG; FAN, 2001; DIGDOWISEISO, 2010).
In this work, a variable directly related to the “quality” of the incoming students is proposed to measure this aspect of academic wealth. For this ef-fect, we will use the amount of government’s money distributed according to
the captured student’s scores of the national grading test. Using this indicator
we can measure the degree of concentration of this academic capital. Also, for the purpose of comparison we built a new indicator based on the results of the national accreditation process.
We will restrict our considerations to universities in Chile. As it has been
recently remarked, Chile is one of the more liberal countries in higher education
(BERNASCONI; ROJAS, 2004; BRUNNER et al, 2005; BRUNNER, 2008,
2009), and therefore an analysis of this variable can illuminate controversial issues related to the transition from a regulated to unregulated market. Inci-dentally, the above mentioned papers cleverly expose the present situation on the Chilean system of higher education.
As an introduction, we will begin this paper with a brief description of the Chilean system of higher education. Afterward, we will present the results of our analysis and compare the data with another parameter based on the ac-creditation results. Finally, we will discuss some hypothesis on the observed “academic” inequality in the Chilean higher education system. An appendix is added with the essential statistical meaning of the Gini index.
THE CHILEAN SYSTEM OF HIGHER EDUCATION
The Chilean system of higher education is composed of technical centers (CFT by its Spanish initials, roughly equivalent to two-year colleges), profes-sional institutes (IP, four-year profesprofes-sional colleges) and universities. One type
of classiication, useful for our present purposes, is to use the degree of state inancial support to each university budget. A subset of universities, labeled
“traditional”, receives direct support and the others do not receive direct state support (these last ones are usually called “private”). It is interesting to note that
this classiication does not refer to the property of the institutions. Furthermore,
Chile is a unitary country and the relationship between the higher education system and the government is mediated by the Ministry of Education. There is a special association between the traditional universities and the government
through the Council of University Presidents (CRUCH: Consejo de Rectores de Universidades Chilenas). For different types of classiication of Chilean
universities, it is possible to consult the above mentioned paper of Brunner et al
(2005) and a report of the Central Bank of Chile (RAPAPORT; BENAVENTE;
MILLER, 2004). Recently, OECD delivered a sound report on Chilean higher
education (THE WORLD BANK, 2009).
The universities belonging to CRUCH prepare each year a national ex -amination for high school candidates to gain admittance to the universities in
a manner similar to the SAT-test in USA. The results of this examination are
mandatory, and must be considered for admittance in a university belonging
to the CRUCH. Also, they are not mandatory but they are usually considered
for access to the other Chilean universities.
In the time span this paper considers, two different questionnaires were
applied in different time intervals. The irst national test (until 2003) was
named Aptitude Scholar Test (PAA by its Spanish initials). From 2004 on, a
new measurement test is applied, named Selection University Test (PSU by its
Spanish initials). These two examinations differ in a deep qualitative approach:
to measure acquired high school knowledge. According, we will present our results following these two calendar epochs.
Going to inancial matters, the state directly subsidies all universities be
-longing to the CRUCH (it is a subsidy to the supply, see i.e. WÖRNER, 2009) and also the government uses a inancial incentive to the demand. This last
one is named the “indirect state support”2 (AFI in Spanish). It consists of an amount of money transferred to all the universities (not only the traditional ones) according to its capacity to capture the best students ranked by the PAA
(until 2003) and PSU (from 2004 on). The rationale under this procedure is
that the best students (that is, the students with better scores in these tests) will choose the best universities. Therefore, this subsidy is directly related to the quality of the university as subjectively perceived by the customers (incoming students and/or their families).
Although it is controversial that this incentive is effectively a quality index,
AFI-PSU subsidies are a fair index: it covers all institutions and it has been
maintained for a long period of time. The unquestionable point is that all Chilean universities want to attract this subsidy by inducing the students to postulate to the corresponding university. The reason for these universities’ behavior is not only the obvious quantity of money the students can carry to their budgets but also (and this is, in no way, a minor point) the amount of prestige this system brings. In the market of higher education, the institutions do not matriculate all demanding people, instead, as Kirp cleverly points out, “…the “sellers” in this peculiar market, the universities, seek out the most attractive “buyers”- that is,
students” (KIRP, 2003).
The estimation for the inancial market Chilean universities spans between 1.8 to 2.0 US$ billion (as conjectured by a weekly magazine (DE LA FUENTE; LOPEZ, 2010)) to about 3.0 US$ billions. We based our last estimate in data from Brunner 2008 and the Consejo Superior de Educación 2010.
The amount of money the AFI distributed in year 2009 was about US$ 37 million, an amount practically constant during the last decade. From this amount, 98.6% was captured by universities (77.1% for CRUCH universities, 21.5% corresponds to “private” universities) and the remaining amount to other
institutions belonging to the higher education system. The system rewards
higher education’s institutions which recruit the 27 500 students with the high
-est PAA-PSU scores. These students are ordered into ive quintiles. The irst quintile deines a per capita “unit”. This amount grows in factors of 3, 6, 9 and
12 for the remaining quintiles. Therefore, there are different amounts of money
per student according to his/her relative position in the national exam. It is to
be noted that although the total amount and the number of beneiciaries of this
subsidy has been invariable, the stock of students have grown dramatically
(THE WORLD BANK, 2009).
From the above mentioned inancial amounts, it absolutely clear that the
dispute of these talented students is not directly related to money. Prestige is the game.
In the present note, we propose to use the AFI amount of money captured by each university, as a quantitative index of wealth of each institution. Of course, we stress again that the indicators we are using do not pretend to express all the true academic wealth but it would be arguable that it describes this attribute
from the student’s point of view. We will use it in this described restricted sense. With these preventions, by means of this indicator, we will use well established
statistical methods to determine the degree of concentration of academic wealth on the whole Chilean university system.
RESULTS
The OECD report (2009) establishes that: “The AFI was intended to promote quality by encouraging competition for the best students. In practice it directs public funding to the institutions with established high reputations whose stu-dents are most likely to come from better-off families”. In this report and other studies there are ample evidence that this subside operates as a mechanism that
increase income inequality in prospective university students: better PAA-PSU
scores comes mainly from wealthy families students.
We use the statistical data provided by the Ministry of Education in Chile (2010). We start our analysis with the year 1995. Prior to this date some of the present traditional universities did not achieve their present status. We cover eight years of practice with the PAA-test and ive years with the PSU-test. Our
data excludes CFT, IP and Army academies, institutions also eligible for this state support. In fact, these last institutions receive only around 1% of the total amount of money and therefore their contribution can be neglected. This choice has the advantage that we compare institutions theoretically comparable.
We depict our results in the form of the Lorenz curve during the considered
Figure 1 – a) AFI fraction (Red points: 1995-2003. Black points: 2004-2009), linear scale; b) logarithmic scale
The previous results clearly show that the analysis of equity-inequity based
in the behavior of the Gini index, using the AFI-PSU assignations as indicators
of income, is invariant in time or, at least, it shows a very slow variation. In other words the established behavior –whatever it means- is permanent in time.
The second conclusion is that the Chilean university system is highly con-centrated with a clear bias to “richer” universities. Although it could be ques-tionable the analogy, and only for the sake of comparison, let us quote from
the econometric literature related to income distribution, that a Gini coeficient of about 0.2 is characteristic to egalitarian societies (i.e. Finland). USA has an
index of about 0.4 and the country with the worse distribution has an index
of about 0.6 (THE WORLD BANK, 2005). A recent report of PNUD (PNUD,
2010) informs that in Latin American and Caribbean countries the Gini index
ranges between 0.45 and 0.6.
Similarity, let us mention that -although different in purpose to this paper-
Gini index has been used to measure educational inequality. Thomas, Wang
and Fan. (2001) report that Korea has a Gini index of 0.22 and India, 0.69 (data from 1990).
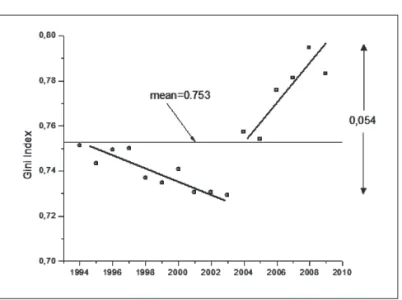
Fig. 2 shows a (small) decrement in the Gini index for the PAA-period and a
(small) increment for the PSU-period. Although surprising, the possible reason
for this effect could be the fact that in the recent years, there are been an incre-ment in the number of institutions. The newer ones by obvious reasons are not able to capture this subsidy, so increasing the number of institutions inside the
Figure 2 - Gini-index. Solid lines show the tendencies
Clearly, an egalitarian wealth distribution is a fair goal for a society with high income (to be equal in poverty is not an ideal state). Is this utopia a valid one for a national system of universities? To our knowledge there is not a univocal answer to these questions. To put it in an ideological context, a liberal scholar would argue that, thanks to the market forces, differentiation between institu-tions will inevitably appear and, after some transient time, things will evolve to reach a steady state. From the opposite side, it is possible to argue that the government (or some other agency) must assure the quality of the universities; after all, these institutions operate under a common condition (and they use the same name, as established by the Chilean law). Historical conditions suggest that the European system of universities show a more equalitarian situation that their American counterparts. However, times are changing, and the European model is evolving to a liberal one.
Tangentially, although not of minor importance, the fact is that “private”
universities do not obtain a signiicant share of the AFI contribution, thus show -ing a feeble participation in the total amount of academic wealth.
It is possible to ind other measures of “academic wealth”. In the Chilean
system of higher education there is a national system of institutional accredita-tion for this kind of instituaccredita-tions (for a detailed account, see CNA-Chile, 2010).
of years. That is, at the end of each of this process it is obtained two numbers: one gives the temporal extent of accreditation, call it m (years,
0
≤ ≤
n
7
) andthe other gives the number of accredited areas, say, m (
0
≤ ≤
m
5
). There aretwo mandatory areas (management and undergraduate curriculum) and the organizations may (or may not) apply to other areas as described.
Therefore it is possible to build a composed index: number of years multi-plied by number of areas, which may describe the strengths and/or the weakness of each institution (in the nomenclature of the former paragraph:
0
≤
mn
≤
35
).In what follow we name this composite index as the “mn index”. It is possible to hypothesize that the greater this index, the greater is the “academic wealth”
of the university, as perceived by the oficial accreditation agency. In this way
it is possible to correlate this number with the numbers resulting from the AFI
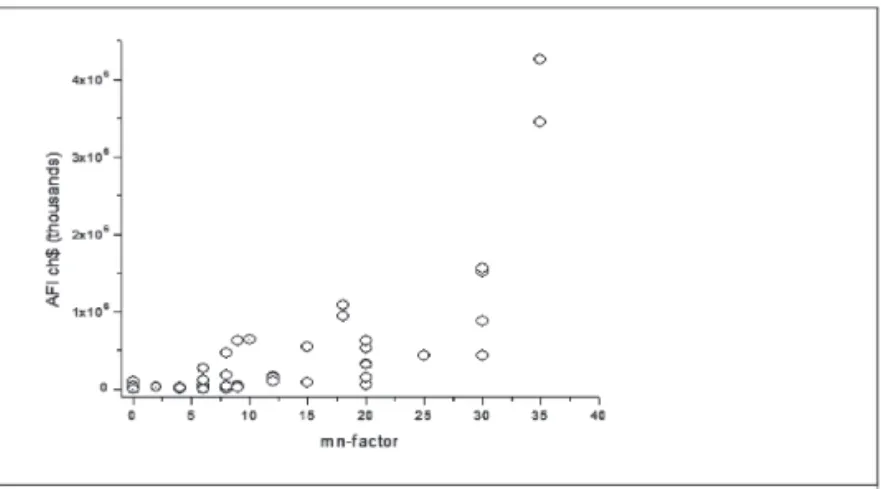
distribution. We will use the data provided by Rodríguez (2010) for the year 2009.A simple view of the results depicted in Fig. 3 show that although there
is a positive correlation between these two set data, this indicator only show a feeble relationship between these two indexes (the linear regression gives
2
0.53
R = ).
Figure 3 - AFI assignations 2009 correlated with “mn” factor
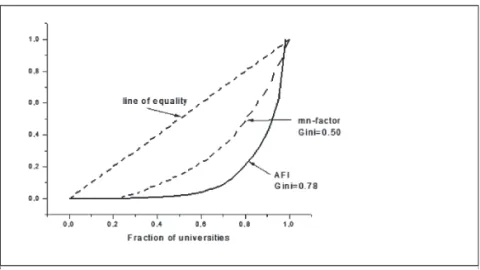
Fig. 4 shows the Lorenz curves for AFI and mn data (2009). Note that Gini
index is signiicantly greater (0.78) than the corresponding mn-factor (0.50).
Clearly although the two indicators show a biased system, the students’
Figure 4 - Lorenz curves for mn-index and AFI, year 2009
AN UNBALANCED SYSTEM
With the two indicators we are dealing with, the system is unbalanced. But,
why is the system so imbalanced? Although our following arguments will be clearly of a hypothetical nature, they can used as a starting point for further analysis.
a) Size effect
Is this difference in quality a result of the drastic increase in university students during the years this work considers? It is a notable fact that the year
1996 there was 243 082 students inscribed in universities and in 2009 this number increments to an impressive total of 533 348 according to the oficial data of the Consejo Nacional de Educación (2009) (National Council for
Education, Chile). An astonishing rate of 119%! Studies show that opening of quasi free market for secondary education increments the covertures but it do not improve the quality (for the high school Chilean case see i.e., McEwan and
Carnoy 2000; Hsieh and Urquiola 2006). On the other had, a simple relexion:
b) Marketing
Currently, the marketing departments of the upper level institutions develop a series of marketing actions in order to capture and negotiate these intellectual “stars”. In this game, institutions are “buyers” and students are “sellers”. A very peculiar situation indeed!
Although the capture of talented students is a person-to person link, it is undoubting that this micromarketing is based on the prestige of the university “mark” itself. The share market high schools and universities encloses, ranks
number third (2007) and ifth (2008) in the total marketing investment in the
country (ACHAP-Megatime report, 2009). It would be presumed that the great volume of this marketing activity is aimed to prospective university students.
c) Geographical location
Continental Chile is very peculiar geographical country. It is a long (2 880
mi) and narrow country (265 mi in its widest width), with a deserted North and
an almost Antarctic South. Perhaps this fact favors the extreme concentration in population this country has. In metropolitan Santiago (the capital city) inhabits about 40.2 % of the total country population (datum from 2009, INE-Chile).
This concentration is relected in all aspects of the political geography, including
of course the higher education sector. The number of students inscribed for the
2010 PSU-test was a total of 285 325, and 40.2% belongs to the metropolitan
Santiago region (DEMRE, 2010). Some data on concentration appears in Table 1. These results show that Santiago universities, in fact, cover an ample portion of the students. Furthemore, they capture more than its regional percentage.
Table 1 - Geographical higher education concentration at metropolitan Santiago
Santiago Inhabitants/total country (2009), %
Registered Santiago PSU students/total
country (2010), %
Students living in Santiago with AFI assignation/total country (2010), %
AFI captured by Santiago’ universities/total
country, %
40.3 40.0 50.8 57.9
d) Peer effect
Peer effect is cited in the literature (see i.e. Andrade; MOITA; SILVA, 2009)
stu-dents. There seems that in this market, brain concentration is a sound capital for the institutions. It is almost an example on the concentration of capital in unregulated markets.
This brief vision of the possible causes of this academic inequality clearly must be analyzed by a deeper research.
FINAL REMARKS
Let us emphasize a last point. On the ample battery of state subsidies to educational systems, it appears a type of money transfer named “vouchers” in the specialized literature. It is a subsidy to the demand: the favored persons (more strictly his/her family) own the funding and therefore can choose his/
her supplier of education. On a general discussion on the public inancing of the education, see i.e., Lott (1987), Wigger and Von Weiszäcker (2001) and
Zhang (2009).
However, the AFI subsidy we are dealing with belongs to a different class of rationale. It is supposed that all prospective students has the potential to compete for this reward, and in this sense it is an expression of the (pseudo) “equality in opportunities”, but in fact, only the more wealthy students (in in-come and cultural capital) are the subset that can obtain this stimulus. Different to a voucher, this reward is located to a certain fraction of students and they can
negotiate his/her admission to the most prestigious universities. Universities
that –mutatis mutanda- buy this talented capital3.
Summing up, we have show that the Chilean system of universities shows a high degree of concentration of perceived academic wealth (measured by AFI assignations) consistently in the same group of universities. This characteristic is (almost) constant in time. Also, we have sketched some hypothetical reasons to explain this fact and we build another indicator based the results of the ac-creditation of the universities. This new indicator itself show inequality (Gini
index, 0,52) and could represent the perception of the quality of the institutions as viewed by the oficial and regulated system of state controls. Notably, it
shows a low correlation with the AFI results.
The implications of these facts are open to an analysis of public policies: Is it preferable to have a broad range quality between institutions (high Gini’s index) or a quasi equalitarian system (low Gini index)? Surely, the answer must be some “in between” state but at the end, this ideal condition is open to debate.
3 In fact, this mechanism is strongly similar to the procedure some USA’s universities enforce to captivate
ACKNOWLEDGEMENTS
The author acknowledges the help and comments of Fabiola Cabrera. Also, the data base management of Lynda Contreras.
REFERENCES
ACHAP-Megatime Report. 2009. Inversión 2008. Inversión Publicitaria. (2008 Marketing Investment). Disponible en: <www.achap.cl/documentos/
INV_2008.ppt>. Aceso en: jun. 2010.
ANDRADE, E.; MOITA, R. M.; SILVA, C. E. L.Peer effect and
competition in higher education.2009. Disponible en: <virtualbib.fgv.br/
ocs/index.php/sbe/EBE09/paper/viewFile/1004/318>. Aceso en: jun. 2010.
BERNASCONI A.; ROJAS, F. Informe sobre la Educación Superior en Chile: 1980-2003 (Report on Chilean Higher Education: 1980-2003).
Santiago, Chile: Editorial Universitaria, 2004.
BRUNNER J. J., G. ELACQUA, A. TILLET, J. BONNEFOY, S.
GONZÁLEZ, P. PACHECO; F. SALAZAR. Guiar el Mercado: Informe
sobre la Educación Superior en Chile (Guiding the Market: Report on Chilean Higher Education). Santiago, Chile: Universidad Adolfo Ibáñez, 2005. Disponible en: <mt.educarchile.cl/archives 2005/08/chilean_higher. html>. Aceso en: jun. 2010.
BRUNNER J. J. El sistema de educación superior en Chile: un enfoque
de economía política comparada (The higher education system in Chile: a comparative political economy approach). Avaliação, Campinas, Sorocaba, v.13, n. 2, p. 451-486, jul. 2008.
BRUNNER J. J. Mercados, instituciones y políticas en la eduación superior
chilena (Markets, institutions and policies in Chilean higher education). Temas, n. 57, p. 52-59, 2009.
CNA - Comisión Nacional de Acreditación. 2010. Disponible en: <www. cnachile.cl>.Aceso en: jun. 2010.
CNE - Consejo Nacional de Educación. 2010. Disponible en: <www. consejo.cl/public/Secciones/seccionestadisticas/estadisticas_home.aspx>.
CYRENNE P.; GRANT, H. University decision making and prestige: An
empirical study. Economics of Education Review, Columbia, v. 28, p. 237-248, 2009.
DE LA FUENTE, A., LOPEZ, M.J. Universidades: un mercado bullente (Universities: a boiling market). QuePasa, London, v. 38, p. 47-50, 2010.
DIGDOWISEISO, K. Measuring Gini coeficient of education: the
Indonesian case. 2010. Disponible en: <http://mpra.ub.uni-muenchen. de/18965>. Aceso en: jun. 2010.
HSIEH C-T.; URQUILOLA, M. The effects of generalized school choice on achievement and stratiication: Evidence from Chile’s voucher program.
Journal of Public Economics, Berkeley, v. 90, p. 1477– 1503, 2006.
INE - Instituto Nacional de Estadísticas. Compendio Estadístico. 2009.
Disponible en: <http://www.ine.cl/canales/menu/publicaciones/compendio_ estadistico/pdf/2009/1_2_estadisticas_demograicas.pdf>. Aceso en: jun. 2010.
LOTH, L. R. Why is education publicly provided? A critical survey. Cato Journal, Washington, v.7,p.475-501, 1987.
LYNCH K.; O’RIORDAN, C. Inequality in Higher education: a study of class barriers. British Journal of Sociology of Education,Cambridge, v. 19, p. 445-478, 1998.
KIRP, D. Shakespeare, Einstein and the Bottom Line: the marketing of
higher education. Cambridge, Massachusetts: Harvard University, 2003. MCEWAN P. J.; CARNOY, M. The effectiveness and eficiency of private
schools in Chile’s voucher. Educational Evaluation and Policy Analysis,
Washington,v. 22, p. 213-239, 2000.
PNUD. Programa de las Naciones Unidas para el Desarrollo. Informe Regional sobre Desarrollo Humano en América Latina y el Caribe. 2010.
Disponible en: <www.idhalc-actuarsobreelfuturo.org>. Aceso en: jun. 2010. RAPPAPORT D., BENAVENTE, J. M.; MELLER, P. Rankings de universidades chilenas según los ingresos de sus titulados (Ranking of Chilean universities according to their graduates’ income). Central Bank of
RODRÍGUEZ, E. Rendición de Cuenta Pública de la Comisión Nacional de Acreditación. 2009 (Public Report of the Chilean Accreditation Agency).
Santiago, Chile: Comisión Nacional de Acreditación, 2009.
CHILE. MINISTERIO DE EDUCACIÓN DE CHILE. 2005. Disponible en: <http://ww.mineduc.cl/superior>. Aceso en: jun. 2010.
THE WORLD BANK. OECD and the International Bank Reconstruction and Development. 2009. Reviews of National Policies for Education:
Tertiary Education in Chile.Disponible en: <www.oecd.org/document/57/0,3 343,en_2649_39263238_42223801_1_1_1_1,00.html>. Aceso en: jun. 2010. THE WORLD BANK. 2005. Disponible en: <www.worldbank.org/data>. THOMAS, V.; WANG, Y.; FAN, X. Measuring coeficients of inequality:
Gini coeficients of education, Policy Research Working Papers. No. 2525, 2001. World Bank Institute. Disponible en: <citeseerx.ist.psu.edu/viewdoc/ download?doi=10.1.1.17.3253&rep=rep1&type=pdf>. Aceso en: jun. 2010. UNIVERSIDAD DE CHILE. Departamento de Evaluación, Registro y
Medición (DEMRE). 2010. Compendio Estadístico. Proceso de Admisión
2010 (Statistics. Admission process 2010). Disponible en: <www.demre.cl/
text/pdf/p2010/Compendio%202010.pdf>. Aceso en: jun. 2010.
WIGGER B. J; VON WEITZSÄCKER, R. K. Risk, Resources, and
education: public versus private inance of higher education. Working paper of the International Monetary Fund, WP/99/174, 1999, n.48, p. 547-560, 2001.
WÖRNER C. H. El aporte iscal directo (1993-2008) para las universidades del Consejo de Rectores de Universidades Chilenas (Direct state subsidy (1993-2008) for universities belonging to the Consejo de Rectores de Universidades Chilenas. Calidad en la Educación, Santiago, n .8, p. 179-186, jul. 2009.
ZHANG L. A value-added estimate of higher education quality of US states.
APPENDIx
Some Statistical Preliminaries on the Gini index
The degree of inequality of a certain variable (AFI money in the present case) is described by the Lorenz curve. If we have an ordered vector X=(x1, x2, …,xN) in a N-dimensional space, the Lorenz curve (strictly a polygon)
is deined by the set of points (h/N, Lh/LN), where h=0,1,2,…,N; L0=0; and
∑
=
=
h
i i
h x
L
1 . By deinition, this polygon goes from the origin to the point (1,1).
In this diagram we can also draw the locus of the points(i,i); i∈(0,1). This
last line is called the “line of perfect equality”. The comparison between the Lorenz curve and the line of equality gives us a measure of the degree of concentration of the corresponding variable.
In order to have a single parameter for the degree of inequality, the so called,
Gini coeficient is used (Gini, 1921) . For this purpose, the difference between the area covered by the 45 degree line (line of equality) and the area under the
Lorenz curve is calculated. The ratio between this difference and the whole
area of the 45 degree triangle, gives the Gini coeficient. The Gini coeficient