A
rti
c
le
0103 - 5053 $6.00+0.00
*e-mail: [email protected]
IR, Raman and SERS Spectra of 2-(Methoxycarbonylmethylsulfanyl)-3,5-dinitrobenzene
Carboxylic Acid
Asha Raj,a K.Raju,b Hema Tresa Varghese,c Carlos M. Granadeiro,d Helena I. S. Nogueirad
and C. Yohannan Panicker*,e
aDepartment of Physics, Government Polytechnic College, Attingal, Kerala, India
bDepartment of Physics, University College, Trivandrum, Kerala, India
cDepartment of Physics, Fatima Mata National College, Kollam, Kerala, India
dDepartment of Chemistry, CICECO, University of Aveiro, 3810-193 Aveiro, Portugal
eDepartment of Physics, TKM College of Arts and Science, Kollam, Kerala, India
O ácido carboxílico 2-(metoxicarbonilmetilsulfanil)-3,5-dinitrobenzeno foi preparado por substituição nucleofílica. Seus espectros de infravermelho e Raman com transformada de Fourier foram obtidos e analisados. O espalhamento Raman intensificado pela superfície (SERS) foi obtido sobre prata coloidal. Os números de onda vibracionais foram computados pela teoria do funcional de densidade (DFT) com a base híbrida B3LYP/6-31G* e foram comparados com valores experimentais com boa concordância. Interações metal-molécula significativas foram substanciadas por um sinal Ag-O intenso nos espectros SERS, indicando a proximidade dos grupos nitro e carbonila à superfície de prata. Estudos SERS sugerem uma orientação inclinada da molécula sobre a superfície metálica.
2-(Methoxycarbonylmethylsulfanyl)-3,5-dinitrobenzenecarboxylic acid was prepared by nucleophilic substitution. FT-IR and FT-Raman spectra of 2-(methoxycarbonylmethylsulfanyl)-3,5-dinitrobenzenecarboxylic acid were recorded and analyzed. Surface enhanced Raman scattering (SERS) spectrum was recorded on a silver colloid. The vibrational wavenumbers were computed by density functional theoretical (DFT) computations at the B3LYP/6-31G* level and they were found to be in good agreement with the experimental values. Significant metal-molecule interaction has been substantiated by the appearance of intense Ag-O mode in the SERS spectrum and this is indicative of the nearness of nitro and carbonyl group to the silver surface. SERS studies suggest a tilted orientation of the molecule at the metal surface.
Keywords: nitro, FT-IR, FT-Raman, SERS, DFT, methoxy carbonyl
Introduction
The main characteristic of the surface enhanced Raman scattering (SERS) is the enormous enhancement of the Raman signal of a molecule when the spectrum is recorded in the neighbourhood of a metallic rough surface.1,2 The
nucleophilic substitution of o-nitrochlorobenzenes with substituted methanethiolates, catalyzed with triethylamine or pyridine, has been used to prepare a series of appropriately substituted methyl-o-nitrophenylsulfides.3 Sulfenyl
carbonyl compounds are an interesting family of molecules
related to important biological systems and the anomeric and mesomeric effects in methoxycarbonylsulfenyl chloride is reported by Erben et al.4 Vallejos et al.5 reported the experimental investigation of the structure and vibrational properties of methoxycarbonylsulfenyl isocyanate. Nitro derivatives of salicylic acids as a donor in solid state coordination compounds have been studied by Lajumen et al.6 and the study of metal complexes with
3,5-dinitrosalicylic acid is also reported.7,8 Structural
confirmation of the 3,5-dinitrosalicylate anion coordination ability to metal ions have been reported by Valigura et al.9,10 and they have reported the characterization of
EPR spectra. 3,5-Dinitrosalicylic acid is an example of a proton donor having both carboxyl and hydroxyl groups, and provides one of the best chemical synthons for the construction of hydrogen-bonded structural motifs.11
The acid has provided examples of polymorphism in which associations with solvent molecules such as water, dioxane and tert-butyl alcohol give a variety of hydrogen-bonded molecular assemblies.12,13 Panicker
et al.14 reported the IR, Raman and SERS spectra of methyl(2-methyl-4,6-dinitrophenylsulfanyl)ethanoate. Ab initio quantum mechanical method is at present widely used for simulating IR spectrum. Such simulations are indispensable tools to perform normal coordinate analysis so that modern vibrational spectroscopy is unimaginable without involving them. So far, there is no report of the vibrational spectral analysis of the title compound. In the present study, the IR, Raman and surface enhanced Raman scattering spectra of 2-(methoxycarbonyl methylsulfanyl)-3,5-dinitrobenzenecarboxylic acid were investigated to get an idea regarding the orientation of the molecule on the silver surface. Theoretical calculations of the vibrational wavenumbers were made using Gaussian03 software package on a personal computer.15
Experimental
The title compound was prepared by the protocol given by Dudova et al.3 Methyl sulfanylethanoate (4.46 g, 0.042 mol)
was added drop wise to a stirred solution of 2-chloro-3,5-dinitrobenzoic acid (9.86 g, 0.04 mol) in 1,2-dimethoxy ethane (25 mL) to a 100 mL flask at room temperature under an inert atmosphere of Ar. Triethylamine (4.05 g, 0.04 mol) was added at once to neutralize the carboxy group. More triethylamine (4.05 g, 0.04 mol) was then added drop wise with stirring over a period of ca. 30 min. The mixture was stirred for an additional 10 min and then poured into dilute aqueous hydrochloric acid (1:1, 30 mL). The product was extracted with chloroform (3 × 50 mL), the organic phase was dried over Na2SO4 and the solvent was removed under reduced pressure. The residue was recrystallized from chloroform yielding 7.8 g (62%) of the product, mp 109-111 °C. The elemental analysis is: solvent for crystallization, chloroform; calculated/found (%) C 37.98/37.99, H 2.55/2.56, N 8.86/9.13, S 10.14/10.16. Chemical shifts (d): solvent, DMSO-d6 : H7 8.69, H10 8.94 (d, J 2.5 Hz), CH2 3.92 s, OCH3 3.60 s, 13C NMR
(d): solvent DMSO- d 6 ; Ar-S-; 155.42 (C4), 147.91 (C6) 141.48 (C3), 134.26 (C1), 127.35 (C5), 121.61 (C5), COOH group: (169.27) (CO), 38.6 CH2, 166.1, CO of COOCH3, 53.44 CH3. The 1H and 13C NMR spectra were measured
at 25 °C with an AMX 360 Bruker spectrometer at the
wavenumber of 360.14 and 90.57 MHz, respectively. For the measurements the substances were dissolved in CDCl3 or (CD3)2 SO (5% solutions). The d1H chemical shifts are
referred to the signal of HMDSO in CDCl3 solutions (d1H:
0.05) and to the solvent signal in (CD3)2 SO solutions (d1H:
2.55). The d13C chemical shifts are referred to the signals
of the two solvents (d13C : 77.0 and 39.6, respectively).
The analysis of the proton spectra was carried out according to the rules for the first-order splitting with the help of the integral intensities. The 13C NMR spectra were measured
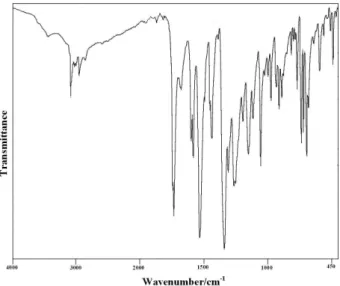
with full decoupling from the protons, and the signals were assigned with the help of SCS. The quaternary carbon atoms and CH groups were differentiated by means of the APT pulse sequence. The elemental analyses were carried out on an automatic analyser EA 1108 (Fisons). The FT-IR spectrum (Figure 1) was recorded using a Perkin-Elmer spectrum one FT-IR spectrometer in the region 450-4000 cm-1 with the sample in standard KBr pellet technique. The
spectral resolution was 2 cm-1. Raman spectra (Figures 2
and 3) were recorded on a Bruker RFS 100/s FT instrument (Nd:YAG laser, 1064 nm excitation). The aqueous silver colloid used in the SERS experiments was prepared by reduction of silver nitrate by sodium citrate, using the Lee-Meisel method.16 SERS of the title compound was obtained
as previously described,17 summarized next. Solution of the
compound were made up in ethanol (0.1 mmol in 1 cm3 of
solvent) and transferred by a micro syringe into the silver colloid (10 µL in 1 mL of the colloid) such that the over all concentration was 10-3 mol L-1. Colloid aggregation
was induced by addition of an aqueous solution of MgCl2 (1 drop of a 2 mol L-1 solution). Polyvinylpyrrolidone was
then used to stabilize the colloid (1 drop of 0.1 g/10 mL aqueous solution). The final colloid mixture was placed in a glass tube and the Raman spectrum registered.
Computational details
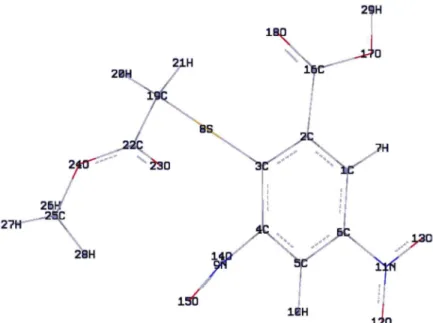
The density Functional Theory (DFT) computations were performed at the B3LYP/6-31G* level theory to get optimized geometry (Figure 4) and vibrational wavenumbers of normal modes of the title compound. DFT calculations were carried out with Becke’s three parameters hybrid model using the Lee-Yang-Parr correlation functional (B3LYP) method. Molecular geometries were fully optimized by Berny’s optimization algorithm using redundant internal coordinates. Harmonic vibratrional wavaenumbers were calculated using analytic second derivatives to confirm the convergence to minima in the potential surface. At the optimized structure of the examined species, no imaginary wavenumber modes were obtained, proving that a true minimum on the potential surface was found. The optimum geometry (Table S1, Supplementary Information) was determined by minimizing the energy with respect to all geometrical parameters without imposing molecular symmetry constraints. The DFT hybrid B3LYP functional
tends also to overestimate the fundamental modes, therefore scaling factors have to be used for obtaining a considerable better agreement with experimental data.18,19
Thus, a scaling factor of 0.9613 has been uniformly applied to the B3LYP calculated wavenumbers.18 The observed
disagreement between the theory and the experiment could be a consequence of the anharmonicity and of the general tendency of the quantum chemical methods to overestimate the force constants at the exact equilibrium geometry.20 The
assignment of the calculated wavenumbers is aided by the animation option of MOLEKEL program, which gives a visual presentation of the vibrational modes.21,22
Results and Discussion
The observed Raman and IR bands with their relative intensities, calculated values and assignments are given in Table 1. The Raman of the solid and the SERS spectrum of 2-(methoxycarbonylmethylsulfanyl)-3,5-dinitrobenzenecarboxylic acid are presented in Figures 2 and 3, respectively.
Carboxylic group vibrations
Carboxylic acids are best characterized by the OH stretch, the C=O stretch and the OH out-of-plane deformation. The C=O stretching vibration in the spectra of carboxylic acids23 give rise to a band in the region 1725 ±
65 cm-1. In the present case, we have observed a band at
1750 cm-1 in the IR spectrum and 1756 cm-1 theoretically.
Two bands arising from the C-O stretching and OH bending appear in the spectra of carboxylic acids near 1320-1210 cm-1 and 1440-1395 cm-1, respectively.24 Both
of these bands involve some interaction between C-O stretching and in-plane C-O-H bending. The n(C-O)c mode
Figure 2. Normal Raman spectrum.
Figure 3. SERS spectrum.
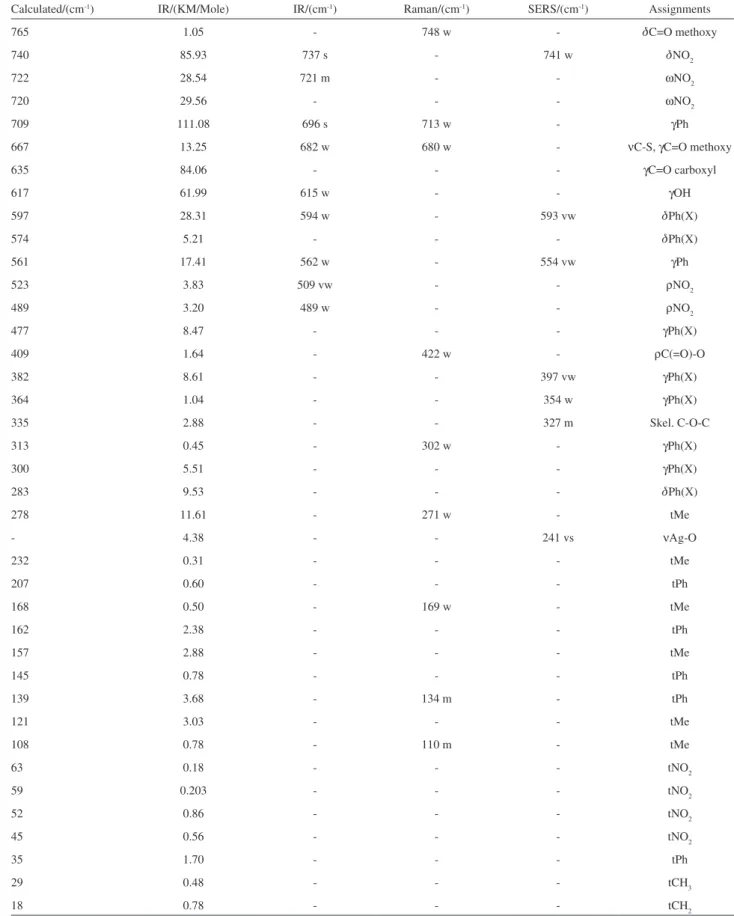
Table 1. Infrared, Raman and SERS spectral data (wavenumbers in cm-1), calculated data and band assignments for 2-(methoxycarbonylmethylsulfanyl)-3,5-nitrobenzenecarboxylicacid
Calculated/(cm-1) IR/(KM/Mole) IR/(cm-1) Raman/(cm-1) SERS/(cm-1) Assignments
3553 104.96 - - - nOH
3150 13.03 - - - nCH
3138 14.74 - - 3139 vw nCH
3075 16.51 3086 m 3087 w - nasCH2
3068 15.06 - 3060 m - nasMe
3038 4.72 3042 vw - - nasMe
2997 3.92 3000 vw - - nsCH2
2962 24.40 2955 w 2958 m 2933 w nsMe
1756 294.05 1750 sh - - nC=O carboxyl
1744 201.61 1733 vs 1741 w - nC=O methoxy
1609 183.04 1599 s 1600 s 1635 vw nasNO2, nPh
1592 164.05 1583 s 1583 vs - nasNO2
1568 35.73 - - 1567 w nasNO2, nPh
1546 130.61 1533 vvs 1531 m - nasNO2
1464 6.43 - - 1465 vw dasMe
1456 6.39 1453 m - 1448 vw dasMe, nPh
1440 25.49 1439 m - 1427 vw dsMe
1431 5.06 - - - dCH2
1410 37.62 - - - dOH
1373 1.53 - - 1383 vw nPh
1365 92.86 - - - nsNO2
1344 363.64 1341 vs 1345 sh 1332 s nsNO2
1330 144.82 - 1336 vs - nC-O carboxyl
1285 153.10 1308 s 1303 m - ωCH2
1278 235.82 1265 s - 1254 vw nC(=O)O
1209 37.85 1195 m 1228 s - ωCH2
1179 118.03 - - 1188 vw dCH,
1173 4.68 - - 1171 vw dCH
1173 86.95 1152 s 1156 m - ρMe
1142 0.95 - 1145 m - ρMe
1121 148.83 1115 m - - τCH2
1107 192.66 - - - τCH2
1092 156.39 1056 s 1058 s 1041 m dCH
1025 43.33 - 1004 s - Ring breathing
999 27.44 998 w 977 w - nO-C(Me)
928 10.53 933 w 935 vw 938 vw γCH
922 4.65 - - - γCH
913 22.62 912 w - - nC-N
906 22.83 - - - γCH
877 11.89 890 w - - nC-N, nCC carboxyl
832 3.39 816 vw 819 w - ρCH2
775 16.29 800 vw 784 w 804 m dNO2
Calculated/(cm-1) IR/(KM/Mole) IR/(cm-1) Raman/(cm-1) SERS/(cm-1) Assignments
765 1.05 - 748 w - dC=O methoxy
740 85.93 737 s - 741 w dNO2
722 28.54 721 m - - ωNO2
720 29.56 - - - ωNO2
709 111.08 696 s 713 w - γPh
667 13.25 682 w 680 w - nC-S, γC=O methoxy
635 84.06 - - - γC=O carboxyl
617 61.99 615 w - - γOH
597 28.31 594 w - 593 vw dPh(X)
574 5.21 - - - dPh(X)
561 17.41 562 w - 554 vw γPh
523 3.83 509 vw - - ρNO2
489 3.20 489 w - - ρNO2
477 8.47 - - - γPh(X)
409 1.64 - 422 w - ρC(=O)-O
382 8.61 - - 397 vw γPh(X)
364 1.04 - - 354 w γPh(X)
335 2.88 - - 327 m Skel. C-O-C
313 0.45 - 302 w - γPh(X)
300 5.51 - - - γPh(X)
283 9.53 - - - dPh(X)
278 11.61 - 271 w - tMe
- 4.38 - - 241 vs nΑg-O
232 0.31 - - - tMe
207 0.60 - - - tPh
168 0.50 - 169 w - tMe
162 2.38 - - - tPh
157 2.88 - - - tMe
145 0.78 - - - tPh
139 3.68 - 134 m - tPh
121 3.03 - - - tMe
108 0.78 - 110 m - tMe
63 0.18 - - - tNO2
59 0.203 - - - tNO2
52 0.86 - - - tNO2
45 0.56 - - - tNO2
35 1.70 - - - tPh
29 0.48 - - - tCH3
18 0.78 - - - tCH2
n-stretching; d-in-plane deformation; γ-out-of-plane deformation; ρ-rocking; τ-twisting; ω-wagging; t-torsion; s-strong; b-broad; v-very; w-weak; Me-methyl; Ph-phenyl; X-substituent sensitive; m-medium.
is reported at 1377 cm-1 for sodium salicylate,25 at 1391 cm-1
for 4-aminosalicylic acid26 and at 1375 (IR), 1382 cm-1 (HF)
for 3,5-dinitrosalicylic acid.27 For the title compound, the
band observed at 1330 cm-1(DFT) and 1336 cm-1 (Raman)
is assigned as n(C-O)c mode.
Methoxycarbonyl group vibrations
In the spectra of methyl esters the overlap of the regions in which both asymmetric stretching23 n
asMe absorb with
a weak to strongly (3020 ± 30 and 2990 ± 40 cm-1) is not
large and regularly seen above 3000 cm-1. The computed
wavenumbers of modes corresponding to the nasMe
group are 3068 and 3038 cm-1. For the title compound,
bands observed at 3060 cm-1 in the Raman spectrum and
3042 cm-1 in the IR spectrum are assigned as asymmetric
methyl stretching vibrations. The symmetric stretching mode nsMe is expected in the range 2920 ± 80 cm-1 in which all the
CH bonds extend and contract in phase.23 The bands at 2955
(IR), 2958 (Raman) and 2962 cm-1 (DFT) are assigned as
this mode. Panicker et al.14 reported the stretching vibrations of methyl group at 3068, 3038, 2963 (DFT), 2961 (IR) and 2962 cm-1 (Raman) for methyl stretching vibrations. The
stretching vibrations of the methyl group are reported at 3016, 2967, 2857 cm-1 (IR), 3046, 2962, 2842 cm-1 (Raman),
3171, 3137, 3058 cm-1 (DFT) for methoxycarbonylsulfenyl
isocyanate5 and at 3014, 2966, 2850 cm-1 (IR), 3039, 2959,
2840 cm-1 (Raman), 3191, 3159, 3073 cm-1 (DFT) for
methoxycarbonylsulfenyl chloride.4
Two bending vibrations can occur within a methyl group. The first of these, the symmetric bending vibration
dsMe involves the in-phase bending of the C-H bonds. The second, the asymmetrical bending mode dasMe involves
out-of-phase bending of the C-H bonds.24 The asymmetric
bending vibrations of the methoxy group23 normally
appears in the regions 1460 ± 25 and 1450 ± 15 cm-1 and the
symmetric vibrations mostly displayed in the range 1435 ± 15 cm-1. The intensity of these vibrations is only weak to
moderate. In the spectra of H2NC(=O)OMe and Cl2NC(=O) OMe, the symmetric deformation dsMe is reported at 1369 and 1386 cm-1, respectively.23 The DFT calculations give
1464, 1456 and 1440 cm-1 as d
asMe and dsMe, respectively,
for the title compound. The bands observed at 1453 and 1439 cm-1 in the IR spectrum are assigned to these
modes. For methyl (2-methyl-4,6-dinitrophenyl sulfanyl) ethanoate14 the bending vibrations of the methyl group are
reported at 1464, 1455, 1375 (DFT), 1376 (Raman) and 1371 cm-1 (IR). For methoxycarbonylsulfenyl compounds,
the bending modes of the methyl group are reported at 1465, 1454, 1453, 1450, 1437, 1436, 1435, 1428, 1302 cm-1 in IR,
1452, 1329 cm-1 in Raman, 1499, 1488, 1470 cm-1 (DFT)4
and at 1443, 1436, 1368 cm-1 in IR, 1450, 1410 cm-1 in
Raman, 1495, 1484, 1468 cm-1 (DFT).5
The methyl rock ρMe has been observed at 1185 ± 35 cm-1 often as a shoulder on the low wavenumber wing
of nC(=O)O absorption.23 In i-PrC(=O)O-OMe this mode
(1194 cm-1) is next to nC(=O)O (1202 cm-1) but t-
BuC(=O)-OMe both absorptions23 coincide at 1193 cm-1. The second
methyl rock23 absorbs at 1155 ± 35 cm-1. The bands calculated
at 1173 and 1142 cm-1 are assigned as rocking modes of
the methyl group. Experimentally the bands observed at 1152 cm-1 in the IR spectrum and at 1156, 1145 cm-1
in the Raman spectrum are assigned rocking modes of the methyl group. The methyl rocking modes are reported at 1195, 1171 cm-1 in IR, 1193, 1148 cm-1 in Raman, 1212,
1181, 1167 cm-1 (DFT)5 and at 1194, 1190 cm-1 in IR,
1196 cm-1 in Raman, 1211 cm-1 (DFT).4
The most characteristic bands of esters arising from the C=O stretching vibration occurring at 1750 ± 50 cm-1
with a strong to very strong intensity.23 Methyl esters
of α-unsaturated and aromatic carboxylic acids23 show
the nC=O at 1725 ± 25 cm-1. Seth Paul and Van Duyse28
identified the region 1730 ± 15 cm-1 for mono- and
di-substituted methyl benzoates and Nyquist29 proposed
1733 ± 5 cm-1 for o-phtalic esters. The intensity of the
carbonyl stretching band can increase owing to conjugation, or formation of hydrogen bonds. The increase in conjugation, therefore leads the intensification of the Raman lines and increase IR band intensities. The stretching modes of the carbonyl group of the ester part may be lowered to around 1720 cm-1 in the presence of conjugation.30 In
the present study the nC=O mode is seen at 1733 cm-1 in
IR, 1741 cm-1 in Raman and 1744 cm-1 theoretically. For
methoxycarbonylsulfenyl compounds, nC=O is reported at 1772 (DFT), 1779 (IR), 1756 cm-1 (Raman)4 and at 1788
(DFT), 1750 (IR), 1734 cm-1 (Raman).5
The C(=O)O stretching vibration, often considered as the C-O-C asymmetric stretch, appears strongly at 1255 ± 60 cm-1, a region in good agreement with that of the
nC-O in carboxylic acids (1250 ± 80 cm-1).23 The band at
1265 cm-1 in IR spectrum is assigned as the nC-O-C mode
and the calculated value of this mode is 1278 cm-1. The O-C
stretching vibration of the O-CH3 group, coupled with the methyl rock, appears in the wide region 975 ± 125 cm-1 with
an intensity varying from weak to strong.23 This vibration is
often called the symmetric COC stretching vibration. The band at 999 cm-1 given by DFT calculation is assigned as this
mode. Erban et al.4 reported the nOC stretching mode at 963 (DFT), 977 cm-1 (IR), 937 cm-1 (Raman) and Vallejos et al.5
reported this mode at 940 (Raman), 959 cm-1 (DFT).
The dC=O deformation23 has been found in the region
(DFT) is assigned as this mode. The γC=O absorption23 is
in the range 625 ± 75 cm-1 and the DFT calculation give
this mode at 667 cm-1. The C-C(=O)-O deformation23 rock
absorbs weakly to moderately in the region 435 ± 95 cm-1.
For most of the methyl esters give the region 445 ± 60 cm-1
for this rock. Methyl acetate absorbs at 435 cm-1 and methyl
propanoate at 440 cm-1.23 Saunders et al.31 found 445 ±
10 cm-1 as C-C(=O)-O deformation for a series of fourteen
aliphatic methyl esters. The DFT calculations give this mode at 409 cm-1 and a weak band is observed at 422 cm-1
in the Raman spectrum. The skeletal C-O-C deformation23
appears in the region 325 ± 40 cm-1. For methyl formate
and methyl acetate this mode is at 330 and 318 cm-1,
respectively.23 Saunders et al.31 found 330 ± 15 cm-1 for a
series of aliphatic methyl esters. For the title compound this C-O-C deformation is found at 335 cm-1.
Nitro group vibrations
The most characteristic bands in the spectra of nitro compounds are due to the NO2 stretching vibrations, which are the two most useful group wavenumbers, not only because of their spectral positions but also for their strong intensities.23 Nitrobenzene derivatives display n
asNO2 in
the regions 1535 ± 30 cm-1 and 3-nitropyridines at 1530 ±
20 cm-1.23,32 The authors have reported bands at 1604,
1583, 1538 cm-1 (Raman), 1604, 1582, 1532 (IR) and
1605, 1588, 1565, 1544 cm-1 (DFT) as n
asNO2 modes.14
The bands seen at 1583, 1531 cm-1 in the Raman spectrum
and 1599, 1583, 1533 cm-1 in the IR spectrum are assigned
as nasNO2 for the title compound. The calculated values
for these modes are 1609, 1592, 1568 and 1546 cm-1. In
substituted nitrobenzenes23,32 n
sNO2 appears strongly at
1345 ± 30 cm-1, in 3-nitropyridine at 1350 ± 20 cm-1, and
in conjugated nitroalkenes33 at 1345 ± 15 cm-1. Panicker et
al.14 reported 1346(Raman) , 1344 (IR) and 1348, 1339 cm-1
(DFT) as nsNO2 modes .The band at 1341 cm-1 in IR
spectrum, 1345 cm-1 in Raman spectrum and 1365,
1344 cm-1 (calculated) are assigned as n
sNO2 modes. The
NO2 scissors occur at higher wavaenumbers (850 ± 60 cm-1)
when conjugated to C=C or aromatic molecules.34,35 In
aromatic compounds the wagging mode ωNO2 is assigned at 740 ± 50 cm-1 with a moderate to strong intensity.23 The
bands at 784 cm-1 in the Raman spectrum, 800, 737 cm-1 in
the IR spectrum and 775, 740 cm-1 (DFT) are assigned as the
deformation bands of nitro groups. The DFT calculations give the wagging modes ωNO2 at 722 and 720 cm-1. The
rocking mode ρNO2 is active in the region 540 ± 70 cm-1
in aromatic nitro compounds.23 Varsanyi etal.36 found 70 ±
20 cm-1 and Suryanarayana et al.37 found 65 ± 10 cm-1 as
the torsion of the NO2 for aromatic compounds.
CH2 group vibrations
The vibrations of the CH2 group, the asymmetric stretch nasCH2, symmetric stretch nsCH2, scissoring vibration
dCH2 and wagging vibration ωCH2 appear in the regions
3000 ± 50, 2965 ± 30, 1455 ± 55 and 1350± 85 cm-1,
respectively.23,38 The DFT calculation give n
asCH2 at 3075
and nsCH2 at 2997 cm-1. The CH
2 deformation band which
comes near 1463 cm-1 in alkenes39 is lowered to about
1440 cm-1 when the CH
2 group is next to a double or triple
bond. A carbonyl, nitrile or nitro group each lowers the wavenumber of the adjacent CH2 group38 to about 1425 cm-1.
For the title compound the DFT calculation give 1431, 1209, 1121 and 1107 cm-1 as the deformation bands of
CH2 group. The rocking mode23 ρCH
2 is expected in the
range 895 ± 85 cm-1 and the band at 832 (DFT), 816 (IR)
and 819 cm-1 (Raman) are assigned as ρCH
2 modes. The
torsional modes of methyl, CH2 and nitro group are seen in the low wavenumber region.23
Phenyl ring and other vibrations
In poly substituted benzenes, the aromatic CH stretching vibrations23,40 absorb weakly to moderately between 3000
and 3120 cm-1. The DFT calculations give bands at 3150
and 3138 cm-1. The aromatic CH out-of-plane deformation23
are observed in the range 720-1000 cm-1. The spectral
positions of the weaker γCH near 900 cm-1 correlates well
with electron donating or electron attracting properties of the substituent. The CH in-plane deformations dCH are obtained at 1056 cm-1 in the IR spectrum and at 1058 cm-1
in the Raman spectrum. The DFT calculation gave 1179, 1173 and 1092 cm-1 as these modes. The out-of-plane
deformations and in-plane deformation of the phenyl ring23
are observed below 1000 cm-1 and these modes are not pure
but contain a significant contribution from other modes and are substituent sensitive. The ring breathing mode appears as a weak band near 1000 cm-1, in mono-, 1,3-di- and 1,3,5-tri
substituted benzenes.23 In the otherwise substituted benzenes
however, this vibration is substituent sensitive and difficult to distinguish from the ring in-plane deformation.23 For the
title compound the ring breathing mode appears as a strong band at 1004 cm-1 in the Raman spectrum, and at 1025 cm-1
theoretically. Aromatic nitro compounds show a C-N stretching vibration24,41 near 870 cm-1. In the present study,
the nCN is 890 and 912 cm-1 in the IR spectrum.
(DFT), 1.199 Å (MP2)4 and C
22-O24 = 1.3249 (XRD),
1.341(DFT), 1.34 Å (MP2) and C22-O24 = 1.4587 (XRD), 1.449 Å (DFT, MP2).4 For the title compound, the bond
angles O23-C22-O24, C22-O24-C25 are 124.5 and 115.3°, respectively, while the reported values are 127.3 and 115.8°, respectively.4 In the present case, the carbon-sulfur bond
lengths C3-S8 = 1.7949 and C19-S8 = 1.8493 Å while the reported values are 1.7846 (XRD), 1.792 (MP2) 1.811 Å (DFT)4 and 1.771 (XRD), 1.803 (DFT), 1.783 Å (MP2).5
The carbon-oxygen distances unambiguously define the single and double bonds in the carboxylate group (C16-O17 = 1.3546 and C16-O18 = 1.2119 Å) and are in agreement with the values given by Ng et al.42 The aromatic ring of the title
compound is somewhat irregular and the spread of bond distances is 1.3865-1.4199 Å, which is similar to the spread reported by Smith et al.12
The DFT calculation gives shortening of angle C4-C3-S8 by 1.6° and increase of angle C2-C3-S8 by 5° from 120° at C3 position and this asymmetry of exocyclic angles reveal the repulsion between carboxylic group and the phenyl ring.43
The reduction in the angle C19-C22-O24 to 111.8° from 120° is associated with repulsive interactions, repulsion between methyl and O23, which is evident from the enlargement in the angle O23-C22-O24 by 4.5°. Similar repulsion leads to enlargement of C19-C22-O23 by 3.6°. The angle C22-O24-C25 is reduced by 4.7° due to the repulsion between the two lone pairs of O24 and the neighboring atoms. DFT calculations give the shortening of the angle C5-C4-N9 by 4.8° and the increase of angle C3-C4-N9 by 1.1° from 120° at C4 position and this asymmetry of exocyclic angle, reveal the hydrogen bonding with H10, which is evident from the enlargement in the angle C5-C4-C3 by 3.8°. At C6 position the exocylic angles are nearly the same. For a molecule containing a methoxy group, electronic charge is back-donated from the
lone pair of oxygen atom to the σ* orbital of C-H bonds,
causing a weakening of the C-H bonds.44 This is followed
by the increase in C-H bond distance and the decrease in C-H force constants and can result in the enhancement of IR band intensities of the C-H stretching modes.45 Another
electronic effect, induction, produces stronger polarization of C-H bonds along with an increase in C-H force constant and charge on the hydrogen atom and with a decrease in C-H bond length.45 In the title compound, the methoxy
hydrogen atoms are subjected to induction, which cause a decrease in the C-H bond length.
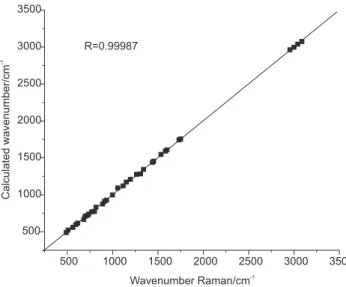
In order to investigate the performance and vibrational wavenumbers of the title compound, root mean square (RMS) and correlation coefficient between calculated (Figure 5) and observed vibrational wavenumbers were
calculated. RMS values of wavenumbers were calculated using the following expression.46
The RMS errors between the observed and scaled wavenumbers are found to be 12.41 and 13.19 for IR and Raman wavenumbers. The small differences between experimental and calculated vibrational modes are observed. It must be due to the fact that hydrogen bond vibrations present in the crystal lead to strong perturbation of the infrared wavenumbers and intensities of many other modes. Also, we state that experimental results belong to solid phase and theoretical calculations belong to gaseous phase.
SERS spectrum
The relative intensities from SERS spectra are expected to differ significantly from normal Raman spectrum
owing to specific surface selection rules.47 The surface
selection rule suggest that for a molecule adsorbed flat on the silver surface, its out-of-plane bending modes will be more enhanced when compared with its in-plane bending modes and vice-versa when it is adsorbed perpendicular to the surface.47,48 It is further seen that vibrations involving
atoms that are close to the silver surface will be enhanced. When the wavenumber difference between Raman bands in the normal and SERS spectra is not more than 5 cm-1, then the molecular plane will be perpendicular to
the silver surface.49 In the case of the SERS spectrum of
methyl(2-methyl-4,6-dinitro phenylsulfanyl)ethanoate14 the
CH stretching mode of the methyl group in the methoxy carbonyl group appears at 2936 cm-1 shifted from 2962 cm-1
in the normal Raman spectrum. In the present study the methyl stretching vibration is observed at 2933 cm-1 in the
SERS spectrum as a broad band shifted from 2958 cm-1
from the normal Raman spectrum. It should be related to the closeness of the methyl group to the silver surface. This is justifiable because the modes in groups directly interacting with the metal surface will be prominent in the SERS spectrum and undergo a wavenumber shift.50
Further, the methyl bands at 1465, 1448, 1427 cm-1 are
also observed in the SERS spectrum thereby supporting the above argument. In our previous studies14 the symmetric
stretching mode of NO2 is reported at 1346 cm-1 in the
normal Raman spectrum and at 1319 cm-1 in the SERS
spectrum. For 2-amino,5-nitropyrimidine51 the symmetric
NO2 stretching mode corresponds to the most intense band, which appears broad and significantly downshifted from 1344 cm-1 (Raman) to 1326 cm-1 (SERS), suggesting a
binding to silver surface through the lone pairs of oxygen atom. Carrasco et al.52 observed nasNO2 band in the SERS spectrum at ca. 1500 cm-1 with medium intensity which
demonstrates the importance of nitro group in regard to the interaction with the metal. Further, they observed the enhancement of nPh modes revealing that the molecule is oriented perpendicular to the metal surface where as the changes that occur in the nitro group indicates that the interaction occurs through O atoms of the nitro moiety. The interaction induces a π electronic redistribution primarily around both the nitro group and the aromatic portion in the vicinity of substituent site. Also Gao and Weaver53
observed broadening and downshift of the corresponding band of nitrobenzene, adsorbed on gold via nitro group. For the title compound, the symmetric stretching mode of nitro group seen at 1345 cm-1 in the normal Raman
spectrum appears at 1332 cm-1 in the SERS spectrum. A
charge transfer from the oxygen atoms of the nitro group to the metal is evidenced by the marked downshift of the symmetric stretching mode of the nitro group as detected
by SERS.51-53 Interaction through the nitro group was also
supported by the presence of modes at 1635, 1567, 804, 741 cm-1 in the SERS spectrum. According to surface
selection rules, vibrations involving atoms that are close to the silver surface will be enhanced.47,48
It has been well established that the presence or absence of the benzene ring CH stretching vibration is a reliable probe for the perpendicular or parallel orientation, respectively, of the benzene ring with respect to the metal surface.54,55 In the SERS spectrum of the title compound
the aromatic CH stretching vibration is observed as a weak broad band at 3139 cm-1 which is absent in the normal
Raman spectrum, which suggests that the phenyl ring may be in a position close to the perpendicular to the silver surface49,54,55 possibly a tilted position since it is a weak band.
It has also been documented in literature56 when a benzene
ring moiety interacts directly with a metal surface, the ring breathing mode has to be red shifted by ca. 10 cm-1 along
with substantial band broadening in the SERS spectrum. Neither a substantial red shift nor significant band broadening was identified in the SERS spectrum of the title compound implying that the possibility of a direct ring π-orbital to metal interaction should be low, in accordance to a tilted position of the ring. Also, the in-plane CH vibrations of the phenyl ring are present in the SERS spectrum at 1188, 1171 cm-1 as
very weak bands and at 1041 cm-1 as a medium band. The
out-of-plane CH mode is also present at 938 cm-1 in the SERS
spectrum. This suggests that the benzene ring is oriented in a tilted position. The nPh vibrational modes corresponding to the bands at 1635, 1567, 1448, 1383 cm-1 are weak in
intensity in the SERS spectrum. Correspondingly, in the normal Raman spectrum, only a single strong band is observed at 1600 cm-1. This indicates an interaction between
the phenyl ring and the metal surface. The presence of a sensitive substituent in-plane and out-of-plane modes, at 593, 554, 397, 354 cm-1 supports the tilted orientation of the
molecule on the metal surface.
The C=O stretching band is absent in the SERS spectrum while the band of nC(=O)O is present at 1254 cm-1
in the SERS spectrum. The presence of methyl group modes in the SERS spectrum indicates the closeness of the methyl group with the metal surface and a possible interaction of the silver surface with the carbonyl group. This is supported by the strong band at 241 cm-1 which may be due to
Ag-O stretching vibration.50,57,58 This band may be due to
Ag-O/Ag-S stretching vibration. But in the SERS spectrum, nitro and carbonyl group vibrations are affected and the absence of the sulfur group vibration indicates that the 241 cm-1 band is due to Ag-O stretch. We have reported
similar strong band at ca. 240 cm-1 for the Ag-O stretching
Conclusions
SERS spectroscopy is a good technique for studying adsorption of molecules on metal surface. From the SERS spectrum we have deduced that the title compound has a tilted orientation on the silver surface. Significant metal-molecule interaction has been substantiated by the appearance of intense Ag-O mode in the SERS spectrum and this is indicative of the nearness of nitro and carbonyl group to the silver surface. The presence of methyl modes in the SERS spectrum shows the nearness of the methyl group to the metal surface and it affects the orientation and metal molecule interaction. The calculated vibrational wavenumbers obtained on theoretical method are in good agreement with the experimental values obtained for the investigated molecule.
Supplementary Information
Supplementary data, optimized geometry of the molecule are available free of charge at http://jbcs.sbq. org.br, as PDF file.
References
1. Fleischmann, M.; Hendra, P. J.; McQuillan, A. J.; Chem. Phys. Lett.1974, 26, 163.
2. JeanMaire, D. L.; Van Duyne, R. R.; J. Electroanal. Chem. 1977, 84, 1.
3. Dudova, K.; Castek, F.; Machacek, V.; Simunek, P.; Molecules 2002, 7, 7.
4. Erben, M. F.; Della Vedova, C. O.; Romano, R. M.; Boese, R.; Oberhammer, H.; Willner, H.; Sala, O.; Inorg. Chem. 2002, 41, 1064.
5. Vallejos, S. T.; Erben, M. F.; Willner, H.; Boese, R.; Della Vedova, C. O.; J. Org. Chem. 2007, 72, 9074.
6. Lajumen, L. H. J.; Kokkonen, P.; Nissi, A.; Ruotsalainen, H.;
Thermochim. Acta1984, 72, 219.
7. Anjaneyulu, Y.; Rao, N. V. S.; Rao, P. R.; Murthy, L. N.; Pisipati, V. G. K. M.; Indian J. Pure Appl. Phys. 1986, 24, 256.
8. Ranford, J. D.; Sadler, P. J.; Tocher, D. A.; J. Chem. Soc., Dalton Trans. 1993, 22, 3393.
9. Valigura, D.; Melnik, M.; Komen, M.; Martiska, L.; Korabik, M.; Mrozinsky, J.; Glowiak, T.; Polyhedron2004, 23, 2447.
10. Valigura, D.; Melnik, M.; Komen, M.; Martiska, L.; Korabik, M.; Glowiak, T.; Inorg. Chem. Commun. 2004, 7,
548.
11. Smith, G.; Wermuth, U. D.; White, J. M.; Acta Crystallogr. 2001, E57, 1036.
12. Smith, G.; Lyncy, D. E.; Byriel, K. A.; Kennard, C. H. L.; Aust. J. Chem. 1995, 48, 1133.
13. Kumar, V. S. S.; Kuduva, S. S.; Desiraju, G.R.; J. Chem. Soc., Perkin Trans. 1999, 2, 1069.
14. Panicker, C. Y.; Varghese, H. T.; Philip, D.; Nogueira, H. I. S.; Castkova. K.; Spectrochim. Acta Part A2007, 67, 1313.
15. Frisch, M. J.; Trucks, G. W.; Schlegel, H. B.; Scuseria, G. E.; Robb, M. A.; Cheeseman, J. R.; Montgomery, Jr. J. A.; Vreven, T.; Kudin, K. N.; Burant, J. C.; Millam, J. M.; Iyengar, S. S.; Tomasi, J.; Barone, V.; Mennucci, B.; Cossi, M.; Scalmani, G.; Rega, N.; Petersson, G. A.; Nakatsuji, H.; Hada, M.; Ehara, M.; Toyota, K.; Fukuda, R.; Hasegawa, J.; Ishida, M.; Nakajima, T.; Honda, Y.; Kitao, O.; Nakai, H.; Klene, M.; Li, X.; Knox, J. E.; Hratchian, H. P.; Cross, J. B.; Adamo, C.; Jaramillo, J.; Gomperts, R.; Stratmann, R. E.; Yazyev, O.; Austin, A. J.; Cammi, R.; Pomelli, C.; Ochterski, J. W.; Ayala, P. Y.; Morokuma, K.; Voth, G. A.; Salvador, P.; Dannenberg, J. J.; Zakrzewski, V. G.; Dapprich, S.; Daniels, A. D.; Strain, M. C.; Farkas, O.; Malick, D. K.; Rabuck, A. D.; Raghavachari, K.; Foresman, J. B.; Ortiz, J. V.; Cui, Q.; Baboul, A. G.; Clifford, S.; Cioslowski, J.; Stefanov, B. B.; Liu, G.; Liashenko, A.; Piskorz, P.; Komaromi, I.; Martin, R. L.; Fox, D. J.; Keith, T.; Al-Laham, M. A.; Peng, C. Y.; Nanayakkara, A.; Challacombe, M.; Gill, P. M. W.; Johnson, B.; Chen, W.; Wong, M. W.; Gonzalez, C.; Pople, J. A.; Gaussian 03, Revision C.02
Gaussian, Inc.: Wallingford, CT, 2004.
16. Lee, P. C.; Meisel, D. J.; J. Phys. Chem. 1982,86, 3391.
17. Nogueira, H. I. S.; Spectrochim. Acta Part A1998, 54, 1461. 18. Foresman, J. B.; Frisch, E.; Exploring Chemistry with Electronic
Structure Methods: A Guide to using Gaussian; Gaussian Inc: Pittsburg, PA, 1996.
19. Scott, A. P.; Radom, L.; J. Phys. Chem. A1996,100, 16502. 20. Rauhut, G.; Pulay, P.; J. Phys. Chem. 1995, 99, 3093.
21. Flukiger, P.; Luthi, H. P.; Portmann S, Weber, J.; MOLEKEL 4.3; Swiss Centre for Scientific Computing, Manno, Switzerland, 2000-2002.
22. Portmann, S.; Luthi, H. P.; Chimia2000, 54, 766.
23. Roeges, N. P. G.; A Guide to the Complete Interpretation of Infrared Spectra of Organic Structures, Wiley: New York,
1994.
24. Silverstein, R. M.; Bassler, G. C.; Morril, T. C.; Spectrometic Identification of Organic Compounds, 5th ed., John Wiley and Sons Inc.: Singapore, 1991.
25. Philip, D.; John, A.; Panicker, C. Y.; Varghese, H. T.;
Spectrochim. Acta Part A2001, 57, 1561.
26. Panicker, C. Y.; Varghese, H. T.; John, A.; Philip, D.; Istvan, K.; Keresztury, G.; Spectrochim. Acta Part A2002, 58, 281.
27. Varghese, H. T.; Panicker, C. Y.; Philip, D.; Chowdhury, J.; Ghosh, M.; J. Raman Spectrosc. 2007, 38, 323.
28. Seth Paul, W. A.; Van Duyse, A.; Spectrochim. Acta Part A1972,
28, 211.
29. Nyquist, R. A.; Appl. Spectrosc. 1972, 26, 81.
31. Saunders, J. E.; Lucier, J. J.; Bentley, F. F.; Appl. Spectrosc.
1968, 22, 697.
32. Prejessy, A.; Rasala, D.; Tomasik, P.; Gawinecki, R.; Collect. Czech. Chem. Commun. 1985, 50, 2443.
33. Brown Jr, J. F.; J. Am. Chem. Soc. 1955, 77, 6341.
34. Exner, O.; Kovac, S.; Solcaniovas, E.; Collect. Czech. Chem. Commun. 1972, 37, 2156.
35. Ranga Rao, D. S.; Thyagarajan, G.; Indian J. Pure Appl. Phys. 1978, 16, 941.
36. Varsanyi, G.; Molner-Paal, E.; Kosa, K.; Keresztury, G.; Acta Chim. Acad. Sci. Hung. 1979, 106, 481.
37. Suryanaranaya ,V.; Kumar, A. P.; Rao, G. R.; Pandey, G. C.;
Spectrochim Acta Part A1992, 48, 1481.
38. Colthup, N. B.; Daly, L. H.; Wiberly, S. E.; Introduction to Infrared and Raman Spectroscopy, 2nd ed., Academic Press: New York, 1985.
39. McMurry, H. L.; Thornton, V.; Anal. Chem.1952,24, 318. 40. Varsanyi. G.; Assignments of Vibrational Spectra of Seven
Hundred Benzene Derivatives, Wiley: New York, 1974. 41. Socrates. G.; Infrared and Raman characteristic Group
frequencies, Wiley: Middlesex, UK, 2001.
42. Ng, S. W.; Naumov, P.; Drew, M. G. B.; Wojciechowski, G.; Brzezinski, B.; J. Mol. Struct. 2001, 595, 29.
43. Bujak, M.; Zaleski, J.; Preszhdo, V.; Uspienskij, B.; Acta Crystallogr. 2002, 58C, 76.
44. Rumi, M.; Zerbi, G.; J. Mol. Struct. 1999, 509, 11.
45. Kurtz, S. K.; Perry, T. T.; J. Appl. Phys. 1968, 39, 3798.
46. Krishnakumar, V.; Dheivamalar, S.; Xavier, R. J.; Balachandran, V.; Spectrochim. Acta Part A 2006, 65, 147.
47. Creighton, J. A.; Spectroscopy of Surfaces - Advances in Spectroscopy, Wiley: New York, 1988, vol. 16, p. 37 (Chapter 2).
48. Gao, X.; Davies, J. P.; Weaver, M. J.; J. Phys. Chem. A1990,
94, 6858.
49. Levi, G.; Patigny, J.; Massault, J. A.; Aubard J.; 13th International
Conference on Raman Spectroscopy, Wurzburg, 1992, p. 652.
50. Kai, S.; Chaozhi, W.; Guangzhi, X.; Spectrochim. Acta Part A 1989,45, 1029.
51. Muniz-Miranda, M.; Vib. Spectrosc. 2002, 29, 229.
52. Carrasco, E. A.; Campos-Vallett, M.; Leyton, P.; Diaz, G.; Clavijo, R. E.; Garcia-Ramos, J. V.; Inostroza, N.; Domingo, C.; Sanchez-Cortes, S.; Koch, R.; J. Phys. Chem. A2003, 107,
9611.
53. Gao, P.; Weaver, M. J.; J. Phys. Chem. 1985, 89, 5040.
54. Suh, J. S.; Moskovits, M.; J. Am. Chem. Soc. 1986, 108, 4711.
55. Creighton, J. A.; Surf. Sci. 1983, 124, 209.
56. Gao, P.; Weaver, M. J.; J. Phys. Chem. A1989, 93, 6205.
57. Panicker, C. Y.; Varghese, H. T.; Philip, D.; Nogueira, H. I. S.;
Spectrochim. Acta2006, 64A, 744.
58. Greaves, S. J.; Griffith, W. P.; J. Raman Spectrosc. 1988, 19, 503.
Received: August 12, 2008
S
u
p
p
le
m
e
nta
ry
Inf
o
rm
a
ti
o
n
0103 - 5053 $6.00+0.00
*e-mail: [email protected]
IR, Raman and SERS Spectra of 2-(Methoxycarbonylmethylsulfanyl)-3,5-dinitrobenzene
Carboxylic Acid
Asha Raj,a K.Raju,b Hema Tresa Varghese,c Carlos M. Granadeiro,d Helena I. S. Nogueirad
and C.Yohannan Panicker*,e
aDepartment of Physics, Government Polytechnic College, Attingal, Kerala, India
bDepartment of Physics, University College, Trivandrum, Kerala, India
cDepartment of Physics, Fatima Mata National College, Kollam, Kerala, India
dDepartment of Chemistry, CICECO, University of Aveiro, 3810-193 Aveiro, Portugal
eDepartment of Physics, TKM College of Arts and Science, Kollam, Kerala, India
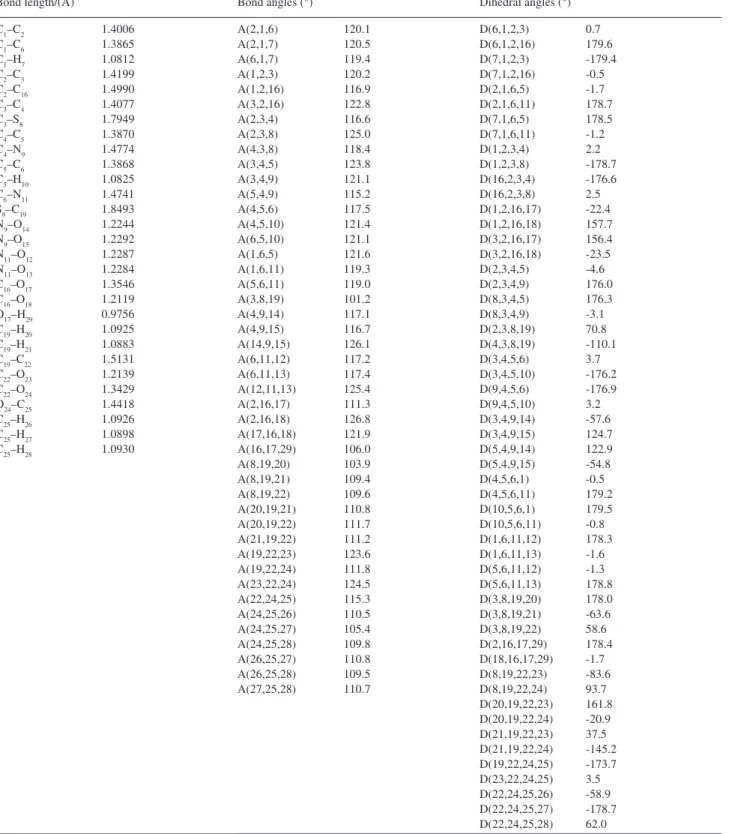
Table S1. Optimized geometrical parameters of 2-(methoxycarbonylmethylsulfanyl)-3,5-nitrobenzenecarboxylicacid, atom labeling is according to
Figure 4.
Bond length/(Å) Bond angles (°) Dihedral angles (°)
C1–C2 1.4006
C1–C6 1.3865
C1–H7 1.0812
C2–C3 1.4199
C2–C16 1.4990
C3–C4 1.4077
C3–S8 1.7949
C4–C5 1.3870
C4–N9 1.4774
C5–C6 1.3868
C5–H10 1.0825
C6–N11 1.4741 S8–C19 1.8493 N9–O14 1.2244
N9–O15 1.2292
N11–O12 1.2287 N11–O13 1.2284 C16–O17 1.3546 C16–O18 1.2119 O17–H29 0.9756 C19–H20 1.0925 C19–H21 1.0883 C19–C22 1.5131 C22–O23 1.2139 C22–O24 1.3429 O24–C25 1.4418 C25–H26 1.0926 C25–H27 1.0898 C25–H28 1.0930
A(2,1,6) 120.1
A(2,1,7) 120.5
A(6,1,7) 119.4
A(1,2,3) 120.2
A(1,2,16) 116.9 A(3,2,16) 122.8
A(2,3,4) 116.6
A(2,3,8) 125.0
A(4,3,8) 118.4
A(3,4,5) 123.8
A(3,4,9) 121.1
A(5,4,9) 115.2
A(4,5,6) 117.5
A(4,5,10) 121.4 A(6,5,10) 121.1
A(1,6,5) 121.6
A(1,6,11) 119.3 A(5,6,11) 119.0 A(3,8,19) 101.2 A(4,9,14) 117.1 A(4,9,15) 116.7 A(14,9,15) 126.1 A(6,11,12) 117.2 A(6,11,13) 117.4 A(12,11,13) 125.4 A(2,16,17) 111.3 A(2,16,18) 126.8 A(17,16,18) 121.9 A(16,17,29) 106.0 A(8,19,20) 103.9 A(8,19,21) 109.4 A(8,19,22) 109.6 A(20,19,21) 110.8 A(20,19,22) 111.7 A(21,19,22) 111.2 A(19,22,23) 123.6 A(19,22,24) 111.8 A(23,22,24) 124.5 A(22,24,25) 115.3 A(24,25,26) 110.5 A(24,25,27) 105.4 A(24,25,28) 109.8 A(26,25,27) 110.8 A(26,25,28) 109.5 A(27,25,28) 110.7