Article
TOPOGRAPHIC EFFECT ON SPECTRAL VEGETATION INDICES
FROM LANDSAT TM DATA: IS TOPOGRAPHIC CORRECTION
NECESSARY?
Efeito topográfico sobre índices de vegetação obtidos com dados Landsat TM: é
necessário correção topográfica?
Eder Paulo Moreira*
Márcio de Morisson Valeriano
Ieda Del Arco Sanches
Antonio Roberto Formaggio
Instituto Nacional de Pesquisas Espaciais – INPE, Av. dos Astronautas, 1758, Jardim da Granja, CEP 12227-010, São José dos Campos – SP, Brasil. E-mails:
[email protected];[email protected];[email protected];[email protected] *Corresponding Author: Eder Paulo Moreira; Cell Phone: (12) 982425118.
Abstract:
The full potentiality of spectral vegetation indices (VIs) can only be evaluated after removing topographic, atmospheric and soil background effects from radiometric data. Concerning the former effect, the topographic effect was barely investigated in the context of VIs, despite the current availability correction methods and Digital elevation Model (DEM). In this study, we performed topographic correction on Landsat 5 TM spectral bands and evaluated the topographic effect on four VIs: NDVI, RVI, EVI and SAVI. The evaluation was based on analyses of mean and standard deviation of VIs and TM band 4 (near-infrared), and on linear regression analyses between these variables and the cosine of the solar incidence angle on terrain surface (cos i). The results indicated that VIs are less sensitive to topographic effect than the uncorrected spectral band. Among VIs, NDVI and RVI were less sensitive to topographic effect than EVI and SAVI. All VIs showed to be fully independent of topographic effect only after correction. It can be concluded that the topographic correction is required for a consistent reduction of the topographic effect on the VIs from rugged terrain.
Keywords: radiometric effect; land cover; Digital Elevation Model; NDVI; SRTM.
Resumo:
somente após a correção topográfica é que todos IVs mostraram-se independentes do efeito topográfico. Conclui-se que é necessária a correção topográfica para uma consistente redução do efeito topográfico nos IVs de áreas com topografia irregular.
Keywords: dados radiométricos; cobertura da terra; Modelo Digital de Elevação; NDVI; SRTM.
1. Introduction
Remote sensing data have become an important source of information for studying vegetation on regional, continental and global scale. Vegetation indices (VIs) calculated from remote sensing data are widely used to either estimate biophysical attributes such as biomass, leaf area index (LAI) and the photosynthetic activity (Lehmann et al., 2012; Dube and Mutanga, 2015) or for monitoring and mapping land cover and land cover change (Kolios and Stylios, 2013; Sexton et al., 2013). Most VIs are based on the red and near infrared spectral information, since green vegetation usually decreases the spectral response in the red due to chlorophyll absorption and increases the spectral response in the near infrared.
However, in rugged mountainous areas the use of remote sensing data can be limited by the topographic effect (Horn, 1981). The topographic (or illumination) effect consists in variations of radiance levels of spectral data caused by differences in surface slope angle and aspect of the terrain, in combination with solar zenith and azimuth angles (Holben and Justice, 1980). Consequently, a certain land cover/use type may not have the same spectral response at different topographic positions (Figure 1). The topographic effect is responsible for a large part of the spectral variation of the land cover in rugged terrain (Civco, 1989; Hantson and Chuvieco, 2011).
It is assumed that topographic effect is considerably reduced in band ratio compared to single spectral bands (Holben and Justice, 1981). Based on this rationale, most studies consider that band ratio VIs (for example, the Normalized Difference Vegetation Index - NDVI) can overcome topographic effects on radiometric levels (Lee and Kaufman, 1986; Ekstrand, 1996; Huete at al., 1999). However, some studies showed that topography significantly affects VIs in rugged mountainous area (Verbyla et al., 2008; Veraverbeke et al., 2010; Wang et al., 2012). For example, Deng et al. (2007) observed that the NDVI and the Normalized Difference Infrared Index (NDII) showed a significant correlation (r2) (p = 0.001) with topography variables such as slope and the cosine of the aspect.
Figure 1: A schematic diagram illustrating the variation of reflectance on Landsat spectral data as function of topography and illumination effects. A: Slope facing away from the sun (weakly illuminated area); B: Slope facing to the sun (well-illuminated area). Source: Modified from
Moreira (2014).
The influence of topographic effect on VIs and the correction performance varies according to the applied vegetation index, spectral and topographic data, study area, methodology of correction, among other factors (Teillet et al., 1997; Vanonckelen et al., 2013). Despite the broad availability of Digital Elevation Models (DEM) data and the development of correction methods, there are still few studies about topographic effects on VIs addressing topographic correction (Matsushita et al., 2007). Thus, the objective of this study was to assess the topographic effect on four widely used VIs, through the examination of uncorrected and topography-corrected Landsat 5 TM data: the NDVI (Rouse et al., 1974), the Ratio Vegetation Index (RVI) (Pearson and Miller, 1972), the Enhanced Vegetation Index (EVI) (Liu and Huete, 1995) and the Soil Adjusted Vegetation Index (SAVI) (Huete, 1988).
2. MATERIAL AND METHODS
2.1 Study area and processing resources
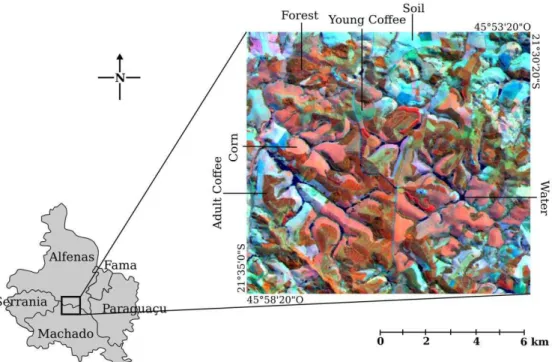
Figure 2: Location of the test site in south of Minas Gerais State, Brazil. Landsat 5 TM 453 (RGB) composition with the identification of the land cover types.
According to the used topographic data, the slope average is 7.5° with a maximum of 35° and altitude ranges from 765 to 1030 meters. Figure 3 presents the momentary variation among pixel values of cos i at the time of the optical image acquisition and the occurring values of slope and aspect within the test site. These plots show a continuous and relatively homogeneous distribution of the variables, without significant gaps that could disturb result analysis due to poly-modal effects. Slope values were concentrated below 15°, in an indication of a relatively gentle terrain (Figure 3-b). Indeed, there was no negative value of cos i in the area, what would indicate pixels with no direct solar illumination due to extreme shadowing (Figure 3-c).
Figure 3: Aspect (a), slope (b) and cos i (c) distributions for the test site. The cos i was calculated considering parameters of the solar geometry at the local and time of the Landsat
image acquisition: solar zenith angle equal to 54.32°; and solar azimuth angle equal to 37.01°(NE).
angle of 54.32° and solar azimuth angle of 37.01° (NE). Aspect and slope layers (Figure 3 a and b) corresponding to study site were downloaded from Topodata Project, available on the website www.dsr.inpe.br/topodata (Valeriano and Rossetti, 2012). High-resolution image from Google Earth, acquired in 2011, were consulted for verification of land cover in the control sample positions. All processing steps were performed using the R programming language, version 3.0 (R, 2013).
2.2 Methodology
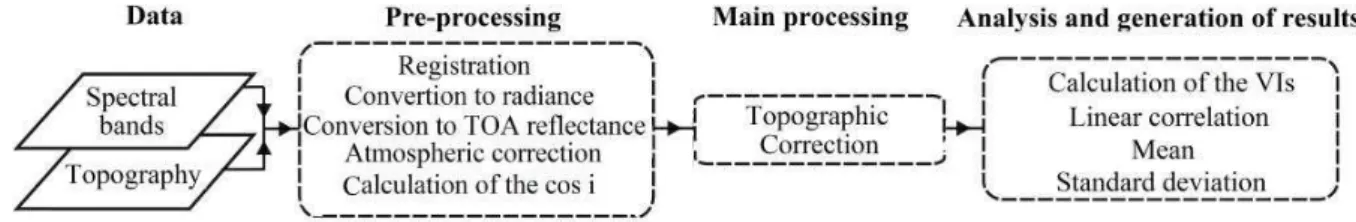
Figure 4 shows the data flow and the processes of this research. As an initial phase of processing, we performed the registration and preparation of the data in the geographic coordinate system (non-projected), with WGS 1984 as geodetic datum. The original data were already georeferenced and, to maximize co-registration, a simple displacement of the spectral data based on distinctive corner points with sharp contrast to their surroundings observed on all datasets was necessary to match spectral and topographic data. The notable features in both sources were drainage junctions, which were promptly contrasting in optical images. For topographic data, the sharp positioning of the drainage features required the use of second-derivative thalweg delineation (based on plan curvature), also available among Topodata products (Valeriano et al., 2006). In order to align pixels between data, the pixel positions were structured with the nearest neighbour resampling method.
Figure 4: Data flow and processes performed in this research.
According to the methodology described by Chander et al. (2009) the digital numbers of the image were converted to radiance and then to top of atmosphere (TOA) reflectance. Atmospheric correction was performed using the DOS (Dark Object Subtraction) technique proposed by Chavez (1988) based on the analysis of histogram frequency of the spectral bands. Subsequently, we calculated the cosine of the solar incidence angle on surface (cos i), which was used for the correction of topographic effect.
Based on a previous study (Moreira and Valeriano, 2014) the c-correction method proposed by Teillet et al. (1982) was chosen to be applied in this study:
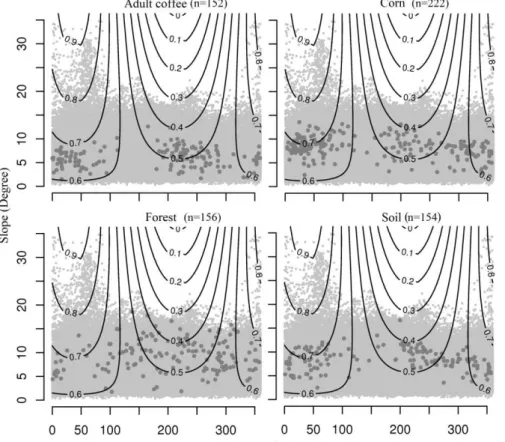
The estimation of cλ parameter was based on samples and calculated for each land cover class. The classes used in this study were the predominant in the study area, which were coffee, corn, forest and soil. Figure 5 shows the distribution of slope values, aspect and cos i for the samples. Land cover samples were distributed in a wide range of slope, aspect and cos i, what is important for the estimation of cλ parameter (Reese and Olsson, 2011) and for the correction evaluation. Samples of land cover were classified by illumination (cos i) classes, where cos i higher than 0.58 (median of cos i) are well-illuminated samples and cos i equal or lower than 0.58 are weakly illuminated. The criterion to define weakly or well-illuminated pixels is illustrated in Figure 3 (c). This classification was carried out only to evaluate the differences in the VIs between these two illumination classes.
Figure 5: Sample distribution (dark grey points) of the land cover types in relation to slope, aspect and cos i (isoline). The points in light grey represent values of the whole test site.
Standard deviation (SD) was also used in this study to evaluate the topographic effect on VIs, before and after correction. SD of radiometric levels theoretically decreases after correction, since the topographic effect, which increases radiometric variations, is removed or minimized (Hantson and Chuvieco, 2011). Finally, the means of VIs of pixels located in weakly illuminated areas and well-illuminated areas were compared. These means are expected to exhibit a statistical difference when calculated from original images, which should be significantly reduced or removed after topographic correction. The t-test was performed to verify whether the two means (from weakly illuminated versus well-illuminated pixels) are statistically different. All evaluations were performed for each vegetation index calculated for each land cover classes. In order to compare single band reflectance with VIs, band 4 also was included in all analyses. It is expected that VIs levels are less sensitive to topographic effect than single band reflectance.
Table 1: Vegetation index analyzed in this study
3. RESULTS AND DISCUSSION
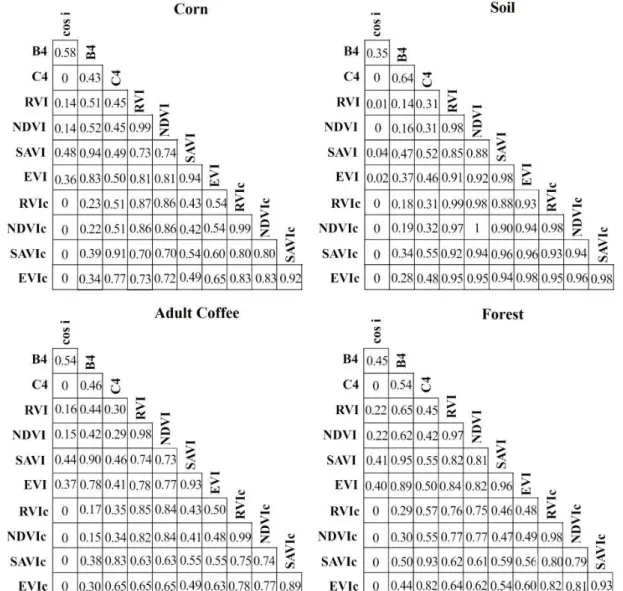
For the topography-uncorrected data, band 4 reflectance showed the highest correlation with cos
Figure 6: Coefficient of determination (r2) of the linear regression between the studied variables for each land cover class. Where, cos i is the cosine of solar incident angle, B4 is the uncorrected
band 4, c (subscript) indicates that data has topographic correction.
The NDVI is highly correlated with the RVI (high r2) and moderately correlated to band 4, thus we assume that NDVI behave as band ratios, which would be the less sensitive formulation to topographic effect (Holben and Justice, 1981). As opposed, SAVI and EVI are moderately correlated to RVI and highly correlated to band 4, that is more sensitivity to topographic effect. According to Matsushita et al. (2007) EVI does not behave like the RVI because of soil adjustment factor "L". The authors concluded that it is the soil adjustment factor in the EVI that makes it much more sensitive to the topographic effect than NDVI.
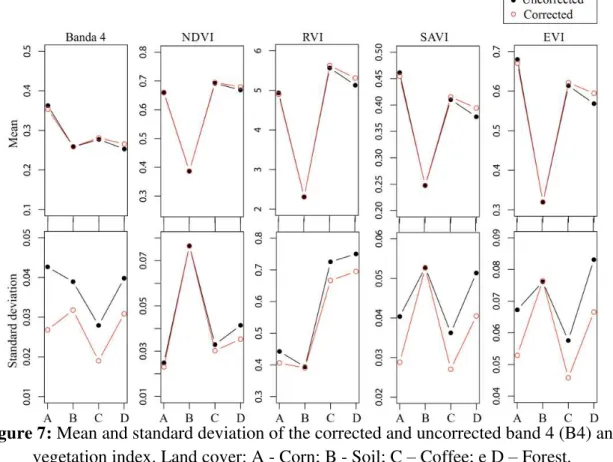
after correction as those of weakly illuminated areas increase. Therefore, the overall mean of the samples should maintain similar after correction. However, this may not happen for a single land cover class which is predominantly located in one illumination condition (for example, weakly illuminated areas). This can explain the greater mean of forest samples after correction, which is the less extent class and predominantly distributed on weakly illuminated areas (Figure 5). The results of r2 and standard deviation for the uncorrected band 4 indicate that data of “corn” and of “soil” classes showed the largest and the smallest presence of topographic effect in the studied area, respectively. This can be explained by the spectral variability of both classes. In the study area, corn is a quite homogeneous class, with little phenological variation and little appearance of self-shadowing, which would increase the spectral variability in and between patches in addition to the topographic effect, as observed on other cover types, like forest and coffee. In the other hand, soil class presents quite a spectral variation among its patches, due to the variety of conditions comprised in this class, including plowed soil, soil with crop residues and degraded pasture, each of these varying in relation to other factors, such as moisture and roughness (Moreira, 2014). Because of this greater spectral variability, the topographic effect is less apparent in the soil class.
Figure 7: Mean and standard deviation of the corrected and uncorrected band 4 (B4) and vegetation index. Land cover: A - Corn; B - Soil; C – Coffee; e D – Forest.
(cos i≤ 0,58 – class II), before and after applying topographic correction
In summary, topography can affect the approached vegetation indices. In addition, it was shown that the applied correction method could fully remove their statistics characteristics related to topographic effect. It is expect that topographic effect reduce the ability of vegetation indices to estimate biophysical parameters of the vegetation or to be used in automatic process of land cover classification, as supported by other studies (Verbyla et al., 2008; Cuo et al., 2010; Vanonckelen et al., 2013; Moreira and Valeriano, 2014). We suggest for further studies that authors address different types of relief, latitude, date of image acquisition and sensors. In addition, it is recommended to evaluate other topographic correction methods, including non-empirical based methods (Shepherd and Dymond, 2003; Zhang and Gao, 2011).
4. CONCLUSIONS
ACKNOWLEDGEMENTS
The authors are scholarship holders of CNPq, the Brazilian Council for Science and Technology, and of CAPES, Coordination for the Improvement of Higher Education Personnel, at National Institute for Space Research (INPE). The authors thank the anonymous referees for all comments and suggestions, which led to improvements of this paper.
REFERENCES
Chander, G.; Markham, B. L.; Helder, D. L. Summary of current radiometric calibration coefficients for Landsat MSS, TM, ETM+, and EO-1 ALI sensors. Remote Sensing of
Environment, v. 113, n. 5, p. 893–903, 2009. doi: 10.1016/j.rse.2009.01.007
Civco, D. Topographic Normalization of Landsat Thematic Mapper Imagery. Photogrammetic
Engineering & Remote Sensing, v. 55, n. 9, p. 1303-1309, 1989.
Chavez, P. S. An improved dark-object subtraction technique for atmospheric scattering correction of multispectral data. Remote Sensing of Environment, v. 24, p. 459–479, 1988.
Cuo, L.; Vogler, J. B.; Fox, J. M. Topographic normalization for improving vegetation classification in a mountainous watershed in Northern Thailand. International Journal of Remote
Sensing, v. 31, p. 3037–3050, 2010.
Deng, Y.; Chen, X.; Chuvieco, E.; Warner, T.; Wilson, J. P. Multi-scale linkages between topographic attributes and vegetation indices in a mountainous landscape. Remote Sensing of
Environment, v. 111, p. 122–134, 2007.
Dubayah, R.; Rich, P. M. Topographic solar radiation models for GIS. International Journal of
Geographical Information Systems, v. 9, n. 4, p. 405–419, 1995.
Dube, T.; Mutanga, O. Evaluating the utility of the medium-spatial resolution Landsat 8 multispectral sensor in quantifying aboveground biomass in uMgeni catchment, South Africa.
ISPRS Journal of Photogrammetry and Remote Sensing, v. 101, p. 36–46, 2015. doi: 10.1016/j.isprsjprs.2014.11.001
Ekstrand, S. Landsat TM-Based Forest Damage Assessment: Correction for Topographic Effects. Photogrammetric Engineering & Remote Sensing, v. 62, n. 2, p. 151–161, 1996.
Hantson, S.; Chuvieco, E. Evaluation of different topographic correction methods for Landsat imagery. International Journal of Applied Earth Observation and Geoinformation, v. 13, n. 5, p. 691–700, 2011. doi: 10.1016/j.jag.2011.05.001
Holben, B.; Justice, C. The topographic effect on spectral response from nadir-pointing.
Photogrammetic Engineering and Remote Sensing, v. 46, n. 9, p. 1191–1200, 1980.
Holben, B.; Justice, C. An examination of spectral band ratioing to reduce the topographic effect on remotely sensed data. International Journal of Remote Sensing, v. 2, n. 2, p. 115–133, 1981. doi: 10.1080/01431168108948349
Huete, A. R.; Justice, C.; Leeuwen, W. V. Modis Vegetation Index Algorithm Theoretical Basis. Report, 120p., 1999.
IBGE. Produção agrícola municipal, Tabela 1612 – Área plantada, área colhida, quantidade
produzida e valor da produção da lavoura temporária. 2013.
Kobayashi, S.; Sanga-Ngoie, K. A comparative study of radiometric correction methods for optical remote sensing imagery: the IRC vs. other image-based C-correction methods.
International Journal of Remote Sensing, v. 30, p. 285–314, 2009.
Kolios, S.; Stylios, C. D. Identification of land cover/land use changes in the greater area of the Preveza peninsula in Greece using Landsat satellite data. Applied Geography, v. 40, p. 150–160, 2013. doi:10.1016/j.apgeog.2013.02.005
Lee, T. Y. L. T. Y.; Kaufman, Y. J. Non-Lambertian Effects on Remote Sensing of Surface Reflectance and Vegetation Index. IEEE Transactions on Geoscience and Remote Sensing, v. 24, n. 5, p. 699–708, 1986.
Lehmann, E. A.; Wallace, J. F.; Caccetta, P. A.; Furby, S. L.; Zdunic, K. Forest cover trends from time series Landsat data for the Australian continent. International Journal of Applied
Earth Observation and Geoinformation, v. 21, p. 453–462, 2012. doi: 10.1016/j.jag.2012.06.005
Liu, H. Q.; Huete, A. R. A feedback based modification of the NDV I to minimize canopy background and atmospheric noise. IEEE Transactions on Geoscience and Remote Sensing, v. 33, p. 457-465, 1995.
Matsushita, B.; Yang, W.; Chen, J.; Onda, Y.; Qiu, G. Sensitivity of the Enhanced Vegetation Index (EVI) and Normalized Difference Vegetation Index (NDVI) to Topographic Effects: A Case Study in High-density Cypress Forest. Sensors, v. 7, p. 2636–2651, 2007.
Mcdonald, E. R.; Wu, X.; Caccetta, P.; Campbell, N. Illumination correction of Landsat TM data in South East NSW. Proceedings of the 10th Australasian Remote Sensing Conference, 2000, p. 1–13.
Meyer, P.; Itten, K. I.; Kellenberger, T.; Sandmeier, S.; Sandmeier, R. Radiometric corrections of topographically induced effects on Landsat TM data in an alpine environment. ISPRS Journal
of Photogrammetry and Remote Sensing, v. 48, n. 4, p. 17–28, 1993.
Moreira, E. P. Correção radiométrica do efeito de iluminação solar induzido pela topografia, 2014. Dissertação de mestrado em Sensoriamento Remoto, Instituto Nacional de Pesquisas Espaciais - INPE. Accessed 30/10/2014. <http://urlib.net/8JMKD3MGP7W/3FHCR62>
Moreira, E. P.; Valeriano, M. M. Application and evaluation of topographic correction methods to improve land cover mapping using object-based classification. International Journal of
Applied Earth Observation and Geoinformation, v. 32, p. 208–217, 2014. doi: 10.1016/j.jag.2014.04.006
Pearson, R. L.; Miller, L. D. Remote mapping of standing crop biomass for estimation of the productivity of shortgrass prairie, Pawnee National Grasslands, Colorado. Proceedings of the 8th
International Symposium on Remote Sensing of the Environment. Anais... . 1972. Ann Arbor, MI. p.1355–1379.
Reese, H.; Olsson, H. C-correction of optical satellite data over alpine vegetation areas: a comparison of sampling strategies for determining the empirical c-parameter. Remote Sens.
Environ. 115, 1400–1987, 2001. doi: 10.1016/j.rse.2011.01.019.
Rouse, J. W.; Haas, R. H.; Schell, J. A.; Deering, D. W. Monitoring vegetation system in the great plains with ERTS. Proceedings of the Third Earth Resources Technology Satellite-1 Symposium. Anais... . 1974. Greenbelt, USA: NASA SP-351. p. 3010–3017
Sellers, W. D. Physical climatology. Chicago: University of Chicago Press, 272p. 1965.
Sexton, J. O.; Urban, D. L.; Donohue, M. J.; Song, C. Long-term land cover dynamics by multi-temporal classification across the Landsat-5 record. Remote Sensing of Environment, v. 128, p. 246–258, 2013. doi: 10.1016/j.rse.2012.10.010.
Shepherd, J. D.; Dymond, J. R. Correcting satellite imagery for the variance of reflectance and illumination with topography. International Journal of Remote Sensing, v. 24, p. 3503–3514, 2003.
Smith, J. A.; Lin, T. L.; Ranson, K. L. The Lambertian assumption and Landsat data. ISPRS
Journal of Photogrammetry and Remote Sensing, v. 46, n. 9, p. 1980, 1980.
Teillet, P. M.; Guindon, B.; Goodenough, D. G. On the slope-aspect correction of multispectral scanner data. Canadian Journal of Remote Sensing, v. 8, p. 84–106, 1982.
Teillet, P. M.; Staenz, K.; William, D. J. Effects of spectral, spatial, and radiometric characteristics on remote sensing vegetation indices of forested regions. Remote Sensing of
Environment, v. 61, p. 139–149, 1997.
Valeriano, M. M.; Kuplich, T. M.; Storino, M.; Amaral, B. D.; Mendes, J. N.; Lima, D. J. Modeling small watersheds in Brazilian Amazonia with shuttle radar topographic mission-90 m data. Computers and Geosciences, v. 32, p. 1169–1181, 2006.
Valeriano, M. M.; Rossetti, D. F. Topodata: Brazilian full coverage refinement of SRTM data.
Applied Geography, v. 32, n. 2, p. 300–309, 2012. doi: 10.1016/j.apgeog.2011.05.004
Vanonckelen, S.; Lhermitte, S.; Rompaey, A. Van. The effect of atmospheric and topographic correction methods on land cover classification accuracy. International Journal of Applied Earth
Observation and Geoinformation, v. 24, p. 9–21, 2013. doi: 10.1016/j.jag.2013.02.003
Veraverbeke, S.; Verstraeten, W. W.; Lhermitte, S.; Goossens, R. Illumination effects on the differenced Normalized Burn Ratio’s optimality for assessing fire severity. International Journal of Applied Earth Observation and Geoinformation, v. 12, p. 60–70, 2010.
Verbyla, D. L.; Kasischke, E. S.; Hoy, E. E. Seasonal and topographic effects on estimating fire severity from Landsat TM/ETM+ data. International Journal of Wildland Fire, v. 17, n. 2006, p. 527–534, 2008.
Wang, Y.; Hou, X.; Wang, M.; Wang, M.; Wu, L.; Ying, L.; Feng, Y. Topographic controls on vegetation index in a hilly landscape: a case study in the Jiaodong Peninsula, eastern China.
Environmental Earth Sciences, v. 70, p. 625–634, 2012. doi: 10.1007/s12665-012-2146-5
Zhang, W.; Gao, Y. Topographic correction algorithm for remotely sensed data accounting for indirect irradiance. International Journal of Remote Sensing, v. 32, p. 1807–1824, 2011.