From the Institutes of Orthopedics and Traumatology, University of São Paulo School of Medicine, São Paulo – Brazil.
EXPERIMENTAL DETERMINATION OF BONE
CORTEX HOLDING POWER OF ORTHOPEDIC
SCREW
Raul Bolliger Neto, João D. M. B. Alvarenga Rossi and Tomaz Puga Leivas
RHCFAP/2989
BOLLIGER Neto, R. - Experimental determination of bone cortex holding power of orthopedic screw. Rev. Hosp. Clín. Fac. Med. S. Paulo 54 (6): 181-186, 1999.
SUMMARY: Cylindrical specimens of bone measuring 15 mm in diameter were obtained from the lateral cortical layer of 10 pairs of femurs and tibias. A central hole 3.2 mm in diameter was drilled in each specimen. The hole was tapped, and a 4.5 mm cortical bone screw was inserted from the outer surface. The montage was submitted to push-out testing up to a complete strip of the bone threads. The cortical thickness and rupture load were measured, and the shear stress was calculated. The results were grouped according to the bone segment from which the specimen was obtained. The results showed that bone cortex screw holding power is dependent on the bone site. Additionally, the diaphyseal cortical bone tissue is both quantitatively and qualitatively more resistant to screw extraction than the metaphyseal tissue.
DESCRIPTORS: Bone and bones. Biomechanics. Bone screw. Tension resistance.
Several traditional methods for in-ternal osteosynthesis use screws or plates to fix bone fragments. With the development of new surgical tech-niques and new implant materials, vari-ous investigations have been performed to improve different osteosynthesis methods. The effects of screw size and implant techniques of orthopedic screws in cortical bones on the shear-ing resistance have been investigated for this purpose.
The current literature reports that required screw extraction strength is linear to bone thickness.3 Extraction
strength is dependent on implant loca-tion site,2 and it is remarkably
depen-dent on the screw diameter.6 In vivo
studies have shown that extraction re-sistance increases up to 1.5 to 1.9 times at the 6th post-implant week, then it
de-creases to 1.2 to 1.6 times at the 12th post-implant week.6 This reduction is
thought to be caused by movement-in-duced bone resorption around the
screw7. Uhthoff has shown in histology
studies that the screw-to-bone surface contact is greater with self-tapping screws as opposed to non-self-tapping screws8. Despite this difference, the
bone holding power for these different screws was not statistically signifi-cant3,9.
Reports in the literature recom-mend the use of wide screws4 with a
core diameter of at least 3 mm1.
Investigations of screw holding power should control for the following variables: the bone into which the screw is implanted, the variability of the bone tissue at the implant location, and bone mechanical properties.
The objective of this study was to analyze the variations in the
mechani-cal resistance of the metaphyseal and diaphyseal cortical bone tissue in the femur and tibia to push-out forces on an orthopedic screw.
MATERIAL AND METHOD
A bench drilling machine was used to drill a longitudinally-centered 3.2 mm diameter hole in each bone sample. The cortical bone thickness at the level of the hole was measured with a micrometer. The internal surface of the hole was fitted with a 4.5 mm di-ameter tap. A cortical spherical-head AO kind screw (Arbeitsgemeinschaft für den Ostheosynthesenfragen) with an internal six-faced slot, with external and core diameter of 4.5 mm and 3.0 mm, respectively, and having a 1.75 mm long thread and screw length of 35 mm was employed. The screw head was on the external cortical surface.
This testing unit was inserted into a metallic tube with a slightly conical internal surface (tube one) with the screw head facing down. Testing unit placement inside tube one served to prevent cortical layer rupture during push-out testing. A second tube (tube two) was placed upwards inside tube one to support the testing unit from the external surface, leaving a free passage for the screw. A third tube (tube three) was placed from the top, surrounding the screw end. This entire montage was centered under the loading anvil of a Kratos 5002 model machine with a load CCT of 10 TF (Fig. 2). A push-out load at 20 mm/minute was applied on the screw end. A 790 BBC Goerz Metrawatt Servogor graphic recorder plotted the maximal shearing resistance or maximal cortical layer stripping force.
Shearing tension was calculated for each testing unit using the following formula:
Shearing tension = rupture load/ [(thickness) x (screw external diam-eter) x π].
The testing units were positioned taking into account the distances from the articular surface to their centres. In order to overcome size differences among the bones, relative distances, calculated using the expression below, were used.
Relative distance = [(real distance) x (average bicondylar diameter)]/(bone bicondylar diameter)]
(obs. average bicondylar diameter for femora or for tibiae separately).
Each bone was divided in five dis-tinct 5 cm segments corrected for the articular surface. Each segment was numbered (1 to 5) from the first seg-ment that was marked at 5 cm from the articular surface. The epiphysial seg-ments were not included (Table 1).
The testing units were grouped cording to the bone of origin and ac-cording to the relative distance from the articular surface.
Cortical layer thickness, rupture load (extraction force for maximal shearing resistance) and shearing ten-sion from the left and right femur and tibia segments were analyzed.
Student’s t test and Tukey’s
vari-ance analysis test were employed. A significance level of 5% (p<0.05) was chosen for all tests.
RESULTS
Average thickness, rupture load, and shearing tension and respective standard deviation values are shown in Tables 2, 3, and 4 as well as Figs 3, 4, 5, and 6.
Student’s t test analysis for the
three parameters for the respective seg-ments on both sides was significant only for shearing tension in segment one on the left and right femur (p<0.03).
Figure 1 - Bone segmentation in femur and tibia.
Figure 2 - Mechanical assay scheme.
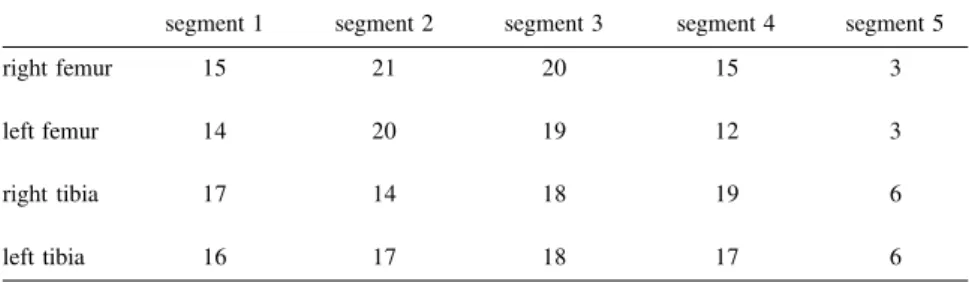
Table 1 - Number of testing units per bone segment.
segment 1 segment 2 segment 3 segment 4 segment 5
right femur 15 21 20 15 3
left femur 14 20 19 12 3
right tibia 17 14 18 19 6
Table 2 - Average thickness values (mm).
segment 1 segment 2 segment 3 segment 4 segment 5 right femur 3.30±0.67 4.14±5.99 5.99±0.73 6.80±1.05 6.34±1.55 left femur 3.02±0.38 4.25±0.71 6.04±0.82 7.15±0.50 7.70±0.80 right tibia 2.46±0.44 3.09±0.63 3.92±0.82 4.33±0.79 4.42±0.65 left tibia 2.40±0.38 2.99±0.58 3.80±0.81 4.28±0.63 4.09±0.58 Analysis of variance: p<0.0001 (*) for all bones.
Tukey’s test: significant difference between segments:
Femur: 1x3, 1x4, 1x5, 2x3, 2x4, 2x5 (both sides) and 3x5 (left side only). Tibia: 1x3, 1x4, 1x5, 2x4 (both sides) and 2x5 (right side only).
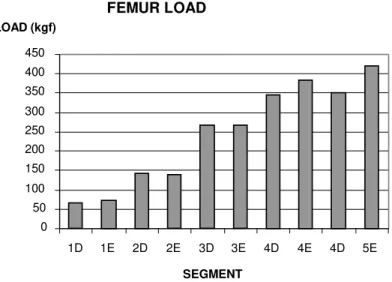
Table 3 - Average rupture load (kgf).
segment 1 segment 2 segment 3 segment 4 segment 5 right femur 65.33±20.90 140.95±47.63 267.00±69.25 354.60±92.50 350.00±70.83 left femur 73.20±22.40 139.20±55.50 267.40±82.80 383.33±17.42 420.00±31.23 right tibia 41.76±10.74 90.36±32.01 144.72±59.64 166.32±44.62 172.50±45.36 left tibia 43.44±22.19 78.24±36.74 133.33±46.53 166.18±53.90 159.17±26.54 Analysis of variance: p<0.0001 (*) for all bones.
Tukey’s test: significant difference between segments:
Femur: 1x3, 1,4, 1x5, 2x4, 2x5 (both sides), 2x3 and 3x5 (left side only). Tibia: 1x3, 1x4, 1x5, 2x5 (both sides) and 3x4 (right side only).
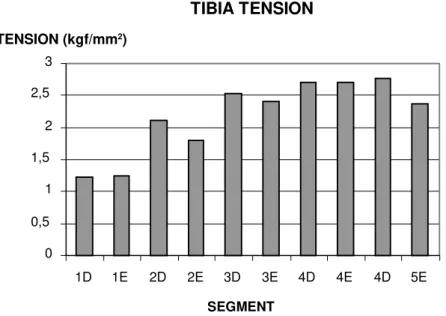
Table 4 - Shearing tension load (kgf/mm2).
segment 1 segment 2 segment 3 segment 4 segment 5 right femur 1.42±0.44 2.38±0.54 3.40±1.07 3.69±0.89 3.91±0.52 left femur 1.70±0.37 2.26±0.65 3.04±0.60 3.41±1.12 3.82±0.24 right tibia 1.23±0.32 2.11±0.55 2.52±0.64 2.70±0.41 2.77±0.63 left tibia 1.25±0.53 1.79±0.68 2.40±0.48 2.70±0.52 2.37±0.95 Analysis of variance: p<0.0001 (*) for all bones.
Tukey’s test: significant difference between segments:
Femur: 1,4, 1x5 (both sides), 1x3 (right side only) and 2x5 (left side only). Tibia: 1x3, 1x4 and 1x5 (both sides).
DISCUSSION
The results of this investigation are strictly concerned with the immediate post-operative period when the stabil-ity of the montage depends exclusively on mechanical factors. Schatzker et al6
reported an increase in mechanical re-sistance to extraction of the screw-bone system in the weeks following implan-tation.
The application of a relative dis-tance as an indicator of the position of the bone sample was necessary to per-mit comparison between bones of dif-ferent lengths. The arbitrary division of the bones included in the analysis into five segments numbered from the metaphysis to the diaphysis permitted the statistical comparison between dif-ferent bone segments with an adequate number of samples in each segment.
The decision to select the lateral surface of the bone cortex as a source for the bone samples was made be-cause this surface is usually chosen for the site of osteosynthesis procedures with plates and screws.
More specifically, the lateral sur-face of the femur has an easier surgi-cal access, and the lateral surface of the tibia has adequate muscle coverage.
The variation recorded for the corti-cal thickness, rupture load, and shearing tension between the segments was statis-tically significant. It shows that there is a progressive increase in the measures from segment 1 through segment 3. This increase tends to attenuate or stabilize for segments 3 through 5 (Tables 1, 2, and 3 and Figs. 3, 4, 5, and 6).
The right- and left-side segments did not show a statistically significant difference for the measures analyzed, except for the shearing tension on seg-ment 1 of the femur. This difference is possibly due to a minor technical prob-lem in this segment where the thick-ness of the cortical layer is on the av-erage smaller than two steps of the screw thread.
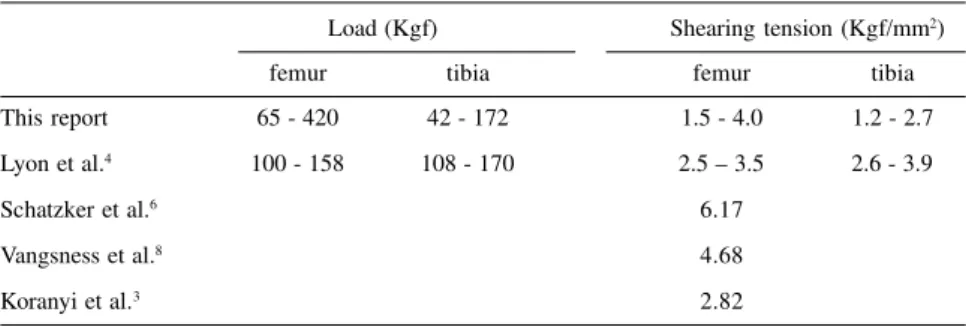
Table 5 – Comparison with data in the literature.
Load (Kgf) Shearing tension (Kgf/mm2)
femur tibia femur tibia
This report 65 - 420 42 - 172 1.5 - 4.0 1.2 - 2.7
Lyon et al.4 100 - 158 108 - 170 2.5 – 3.5 2.6 - 3.9
Schatzker et al.6 6.17
Vangsness et al.8 4.68
These data compares with other re-ports in the literature (Table 5). The values reported by Lyon et al.4 (108 to
158 kgf) and Schatzker et al.6 (218 kgf)
regarding the rupture load for the fe-mur fall between the values obtained in this investigation (65 to 420 kgf). How-ever, the data of Schatzker et al.6 were
obtained in two cortical layers. Regarding the tibia rupture load, the values obtained in this investigation (42-172 kgf) encompass the values yielded by Lyon et al.4 (108 to 170 kgf)
measured in single bone cortex. The femur shearing force range de-termined in this investigation (1.5 to 4.0 kgf/mm2) is greater than that
re-ported by Lyon et al.4 (2.5 to 3.5 kgf/
mm2). Both investigations were
per-formed with a single bone cortex. Schatzker et al.6 and Vangsness et
al.8 recorded 6.17 kgf/mm2 and
4.68kgf/mm2 respectivelyfor two
cor-tical layers. Yet, Koraniy et al3 obtained
2.82 kgf/mm2 for femur shearing
ten-sion. The authors recorded 1.2 to 2.7 kgf/mm2 for tibia shearing, which was
lower than the data reported by Lyon et al4 for a single bone cortex (2.60 to
3.90 kgf/mm2).
Hughes and Jordan2 have
demon-strated that the shearing tension does not depend on the pilot hole as long as the hole diameter is smaller than the external screw diameter. Shearing ten-sion does not depend on the amount of material between the screw threads ei-ther. Shearing tension reflects the in-trinsic quality of the material holding the inserted screw.
We showed both an increase in cor-tex thickness and an increase in resis-tance to shearing, moving from the metaphysis to the diaphysis.
Regarding weight bearing, the thin-ness and reduced resistance presented by the cortical metaphyseal bone is counterbalanced by greater bone eter in this location. The greater diam-eter of the metaphysis is responsible for a larger inertial momentum of the
FEMUR TENSION
0 0,5 1 1,5 2 2,5 3 3,5 4 4,5
1D 1E 2D 2E 3D 3E 4D 4E 4D 5E
SEGMENT TENSION (kgf/mm2)
Figure 5 - Shearing tension distribution in femur segments. TIBIAL LOAD
0 50 100 150 200
1D 1E 2D 2E 3D 3E 4D 4E 4D 5E
SEGMENT LOAD (kgf)
Figure 4 - Rupture load distribution in tibia segments. FEMUR LOAD
0 50 100 150 200 250 300 350 400 450
1D 1E 2D 2E 3D 3E 4D 4E 4D 5E
SEGMENT LOAD (kgf)
bone. The spongy nature of the epiphy-seal and metaphyepiphy-seal bone segments indicates that weight bearing is distrib-uted in the local trabeculae. As the weight bearing is transferred from the metaphysis to the diaphysis, weight bearing becomes more dependent on the cortical layer, which, in turn, be-comes thicker and more resistant.
These functional considerations are in keeping with the finding that the closer to the diaphysis, the thicker and more resistant the cortical layer becomes.
CONCLUSION
The cortical layer thickness, rupture
load, and shearing tension all progres-sively increased from the metaphysis to the diaphysis. This progressively in-creasing pattern corresponds to quan-titative and qualitative changes in bone diameter, cortex thickness, and charac-ter of the local trabeculae along the fe-mur and tibia.
RESUMO RHCFAP/2989
BOLLIGER Neto R e col. – Determinação experimental da retenção do parafuso ortopédico em cortex ósseo. Rev. Hosp. Clín. Fac. Med. S. Paulo 54 (6):181-186,
1999.
Foram retirados corpos de prova ci-líndricos de 15 mm de diâmetro da ca-mada cortical da face lateral de 10 pa-res de fêmupa-res e tíbias oriundos de pe-ças anatômicas. No centro de cada um
destes foi feito um orifício de 3,2 mm e nele inserido, a partir da superfície externa, um parafuso cortical de 4,5 mm de diâmetro após rosqueamento com macho. Este conjunto foi subme-tido a um ensaio mecânico no qual o parafuso foi extraído. A espessura da camada cortical e a carga de ruptura foram medidas e a tensão de cisalha-mento foi calculada. Os resultados fo-ram agrupados de acordo com o seg-mento do osso de onde provinham. Os
ensaios mostraram que a retenção cortical do parafuso varia ao longo do osso e que o tecido ósseo da córtex diafisária é tanto quantitativamente quanto qualitativamente mais resisten-te à extração do parafuso que o resisten-tecido metafisário.
DESCRITORES: Osso e ossos. Biomecânica. Parafusos ósseos. Resistência à tração.
TIBIA TENSION
0 0,5
1 1,5
2 2,5
3
1D 1E 2D 2E 3D 3E 4D 4E 4D 5E
SEGMENT TENSION (kgf?mm2)
REFERENCES
1. ANSEL RH & SCALES JT - A study of some factors which affect the strength of screws and their insertion and holding power in bone. J Biomech 1968; 1: 279-302.
2. HUGHES AW & JORDAN BA - The mechanical properties of surgical bone screws and some aspects of insertions practice. Injury 1972; 4: 25-38.
3. KORANYI E, BOWMAN CE, KNECHT CD & JANSSEN M - The holding power of orthopedic screws in bone. Clin Orthop 1970; 72: 283-286.
4. LYON WF, COCHRAN Jr & SMITH L - Actual holding power of various screws in bone. An Surg 1941; 114-367.
5. MÜLLER ME, ALLGÖWER M, SCHNEIDER R et al. - Manual de Osteosíntesis: Técnica A.O. Berlin, Springer, 1980.
6. SCHATZKER J, SANDERSON R & MURNAGHAM JP - The holding power of orthopedic screws in bone. Clin Orthop 1975; 108: 115-126. 7. SCHATZKER J, HORNE JG & SUMNER-SMITH G - The effect of movement in the holding power of screws in bone. Clin Orthop 1975; 111: 257-263.
8. UHTHOFF HK - Mechanical factors influencing the holding power of screws in compact bone. J Bone Joint Surg 1973; 55B: 633-639. 9. VANGSNESS Jr CT, CARTER DR & FRANKEL V - In vitro evaluation of the loosening characteristics of self-tapped and non self-tapped cortical bone screws. Clin Orthop 1981; 157: 279-286.