Printed in Brazil - ©2006 Sociedade Brasileira de Química 0103 - 5053 $6.00+0.00
Article
* e-mail: [email protected]
Thermodynamic Study of the Solubility of Acetaminophen in Propylene
Glycol + Water Cosolvent Mixtures
Jackson A. Jiménez and Fleming Martínez*
Departamento de Farmacia, Universidad Nacional de Colombia, A.A. 14490, Bogotá D.C., Colombia
Baseado nas equações de van’t Hoff e Gibbs, as funções termodinâmicas energia de Gibbs, entalpia e entropia de solução, mistura e solvatação de acetaminofen em misturas dos solventes propileno glicol + água (PG + W), foram avaliadas por medidas de solubilidade em diversas temperaturas. A solubilidade foi maior para 100% de PG em todas as temperaturas estudadas. A solvatação dessa droga nas misturas aumenta com o aumento da proporção de PG, atingindo um máximo em 70% de PG. De 0% até 20% de PG e de solução 70% até 100% de PG, foi encontrado um domínio da entropia sobre o processo, enquanto de água pura até 10% de PG e de 20% até 70% de PG, foi encontrado domínio da entropia. Estes fatos são explicados em termos de perda da estrutura da água, e uma diminuição na energia requerida para formação da cavidade no solvente, para misturas de 30% até 70% de PG.
Based on van’t Hoff and Gibbs equations the thermodynamic functions Gibbs energy, enthalpy, and entropy of solution, mixing and solvation of acetaminophen in propylene glycol + water (PG + W) cosolvent mixtures, were evaluated from solubility data determined at several temperatures. The solubility was greater at 100% of PG at all temperatures studied. The solvation of this drug in the mixtures increases as the PG proportion is also increased founding a maximum at 70% of PG. From 10% up to 20% of PG and from 70% up to 100% of PG, entropy driving was found, while from pure water up to 10% of PG and from 20% up to 70% of PG, enthalpy driving was found. These facts can be explained in terms of water-structure loss, and a diminishing in the energy required for cavity formation in the solvent, for mixtures from 30% up to 70% of PG.
Keywords: acetaminophen, solubility, solution thermodynamics, activity coefficients
Introduction
Acetaminophen is an analgesic and antipyretic drug widely used in modern therapeutics. This drug is specially indicated in the treatment of several minor diseases presented by pediatric patients.1 In the Colombian market,
it is commercially available as tablets, syrups and concentrates, but it is not available as parenteral products. The later ones have been recently asked for by physicians and by other care practitioners. Injectable homogeneous liquid formulations supply relatively high doses of drug in small volumes. For this reason, some physicochemical properties such as the solubility and the occupied volumes by the drugs and other components in the solution are very important because they facilitate the design process of pharmaceutical dosage forms.2
The solubility behavior of drugs in cosolvent mixtures takes great importance because cosolvent blends are frequently used in purification methods, preformulation studies, and pharmaceutical dosage forms design, among other applications.3 Nowadays several methods to calculate
the solubility are available. However, these methods do not explain totally the mechanism of cosolvent action in mixtures. On the other hand, almost all of these methods in general do not consider the effect of temperature. For these reasons, it is important to determine, systematically, the solubility of drugs, in order to obtain complete information about physicochemical data of pharmaceutical systems. This information facilitates widely the labor of pharmacists associated to development and research of new products in pharmaceutical industry.4 Temperature-solubility
The main objective of this study was to evaluate the effect of the cosolvent composition on solubility and solution thermodynamics of acetaminophen in propylene glycol + water cosolvent mixtures. The analysis was based on van’t Hoff method, including the respective contributions by mixing and solvation of the drug on the solution processes. Ethanol and propylene glycol are probably the more widely used cosolvents in parenteral medications. This investigation expands the concepts developed for this drug in cosolvent systems by Pérez et al.2 in ethanol + water, propylene glycol + water, and
ethanol + propylene glycol mixtures at 25.0 °C, by Grant
et al.6 in water at several temperatures, by Etman and
Naggar7 in sugar aqueous solutions at 20.0 and 37.0 °C,
by Bustamante and coworkers8 in ethanol + water, ethanol
+ ethyl acetate, and dioxane + water mixtures at several temperatures, and Martínez9 in propylene glycol + water
mixtures at 25.0 °C, among others.
Experimental
Materials
Acetaminophen USP (ACP);10 propylene glycol USP
(PG);10 distilled water (W), conductivity < 2 μS,
Laboratory of Pharmaceutics of the Universidad Nacional de Colombia; molecular sieve Merck (numbers 3 and 4); Millipore Corp. Swinnex®-13 filter units.
Equipment
Mettler AE 160 digital analytical balance, sensitivity ± 0.1 mg; Wrist Action, Burrel, model 75 mechanical shaker; Magni Whirl Blue M. Electric Company water baths, temperature control ± 0.05 °C; WTB Binder E28 sterilizer/ drying oven; DMA 45 Anton Paar digital density meter, precision ± 0.0001 g cm–3; Abbe Carlzeiss Jena refractive
meter, precision ± 0.0002; micro pipettes Nichiryo®.
Solubility determinations
An excess of ACP was added to 20 cm3 of each
cosolvent mixture evaluated in glass flasks. The cosolvent mixtures were prepared by mass in quantities
close to 100.0 g varying in 10%, m/m. Solid-liquid mixtures were stirred in a mechanical shaker for 1 hour. Samples were then allowed to stand in water baths kept at the appropriate temperature ± 0.05 ºC. All samples were maintained at least for 48 hours to reach the equilibrium. This equilibrium time was established in a previous investigation11 about the dissolution rate and
solubility of ACP in EtOH, PG and W at 20.0 °C. After this time the supernatant solutions were filtered (at isothermal conditions) to ensure that they were free of particulate matter before sampling. Concentrations were determined by measuring refractive indexes after appropriate dilution and interpolation from previously constructed calibration curves for ACP in each cosolvent mixture.2 All the solubility experiments were repeated
at least three times. In order to make the equivalence between molarity and mole fraction concentration scales, the density of the saturated solutions was determined with a digital density meter.
Results and Discussion
In Table 1, the molecular structure of ACP and some of their physicochemical properties are summa-rized.8,12,13 The melting point and enthalpy of fusion
were reported by Bustamante and coworkers8 while the
enthalpy of sublimation was reported by Williams et al.13 According to Romero et al.14 this drug acts in
solution mainly as a Lewis acid in order to establish hydrogen bonds with proton-acceptor groups in the solvents (oxygen in -OH groups). Dearden15
demons-trated that both functional groups of this drug (-NH and -OH) were involved in complex formation with the carbonyl group of antipyrine. ACP could also act as a proton-acceptor compound by means of its carbonyl and -OH moieties.
Ideal and experimental solubility of ACP
The ideal solubility of a crystalline solute in a liquid solvent can be calculated by equation (1):
(1)
Table 1. Some physicochemical properties of ACP
Molecular structure a Molar mass /g mol–1a Melting point / K b ∆H fus/kJ mol
–1b ∆H
subl/kJ mol –1c
151.16 442.3 26.25 238.85
where Xi 2
d is the ideal solubility of the solute as mole
fraction, ∆Hfus is the molarenthalpy of fusion of the pure solute (at the melting point), Tfusis the absolute melting point, T is the absolute solution temperature, R is the gas constant (8.314 J mol–1 K–1), and ∆C
p is the difference
between the molar heat capacity of the crystalline form and the molar heat capacity of the hypothetical supercooled liquid form, both at the solution temperature.16
Since ∆Cp cannot be easily determined, one of the following assumptions has to be made: (a) ∆Cp is negligible and can be considered zero or (b) ∆Cp may be approximated to the entropy of fusion, ∆Sfus. In this investigation the later consideration is assumed.
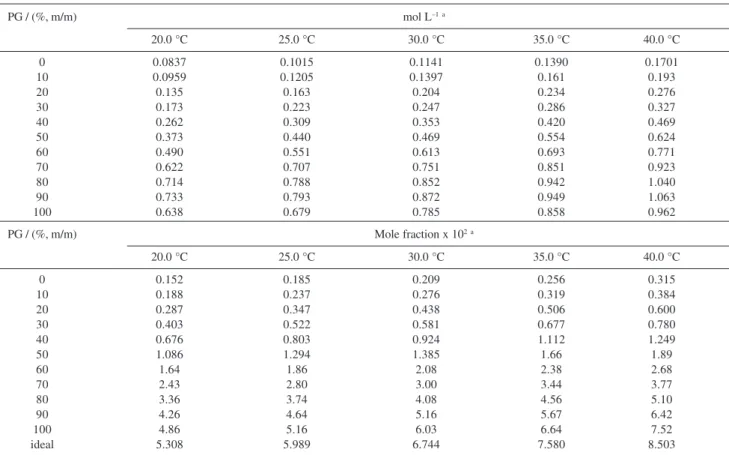
Table 2 summarizes the experimental solubilities of ACP, expressed as molarities and mole fractions, and the ideal solubilities calculated by means of equation (1) from ∆Hfus, and Tfus presented in Table 1. In all cases, the coefficients of variation for solubility were smaller than 2.0%. On the other hand, Figure 1 shows the solubility expressed in mole fraction at all the studied temperatures. In this cosolvent system a maximum in solubility is not obtained in contrast to that found in other cosolvent systems such as ethanol + water (EtOH + W).8
The Hildebrand solubility parameter (δ) obtained for this drug in EtOH + W mixtures was 28.3 MPa1/2 (13.8
cal1/2 cm–3/2) at 25.0 °C.8 This value is outside of δ values
obtained with PG + W mixtures, i.e., from 30.3 MPa1/2
(14.8 cal1/2 cm–3/2) up to 47.9 MPa1/2 (23.0 cal1/2 cm–3/2) .
For this reason, the solubility obtained in EtOH + W mixtures is relatively larger in comparison with PG + W mixtures.9 On the other hand, if molarity is considered,
a maximum in solubility is obtained at 90% of PG at all temperatures.
Table 2. Experimental solubility of ACP in PG + W cosolvent mixtures expressed in mol L-1 and mole fraction including ideal solubility at several
temperatures
PG / (%, m/m) mol L–1a
20.0 °C 25.0 °C 30.0 °C 35.0 °C 40.0 °C
0 0.0837 0.1015 0.1141 0.1390 0.1701
10 0.0959 0.1205 0.1397 0.161 0.193
20 0.135 0.163 0.204 0.234 0.276
30 0.173 0.223 0.247 0.286 0.327
40 0.262 0.309 0.353 0.420 0.469
50 0.373 0.440 0.469 0.554 0.624
60 0.490 0.551 0.613 0.693 0.771
70 0.622 0.707 0.751 0.851 0.923
80 0.714 0.788 0.852 0.942 1.040
90 0.733 0.793 0.872 0.949 1.063
100 0.638 0.679 0.785 0.858 0.962
PG / (%, m/m) Mole fraction x 102a
20.0 °C 25.0 °C 30.0 °C 35.0 °C 40.0 °C
0 0.152 0.185 0.209 0.256 0.315
10 0.188 0.237 0.276 0.319 0.384
20 0.287 0.347 0.438 0.506 0.600
30 0.403 0.522 0.581 0.677 0.780
40 0.676 0.803 0.924 1.112 1.249
50 1.086 1.294 1.385 1.66 1.89
60 1.64 1.86 2.08 2.38 2.68
70 2.43 2.80 3.00 3.44 3.77
80 3.36 3.74 4.08 4.56 5.10
90 4.26 4.64 5.16 5.67 6.42
100 4.86 5.16 6.03 6.64 7.52
ideal 5.308 5.989 6.744 7.580 8.503
a In all cases the coefficients of variation (CV) were smaller than 2.0%.
Thermodynamic functions of solution
The making of weighted graphs based on the logarithm of solubility as a function of reciprocal absolute temperature permits to obtain the apparent enthalpic change of solution (∆H0
s a o p l p
n) by means of van’t Hoff
equation (equation 2):
(2)
In more recent treatments, some corrections have been introduced to equation (2) in order to reduce the propagation of errors, and therefore, to separate the chemical effects from those due only to statistical treatments used in compensation plots. For this reason, the mean harmonic temperature (Thm) is used in van’ Hoff analysis. Thm is calculated as:17
(3)
where n is the number of tested temperatures. In our case the Thm value obtained was just 303 K. The corrected expression more widely used can be written as follows:8
(4)
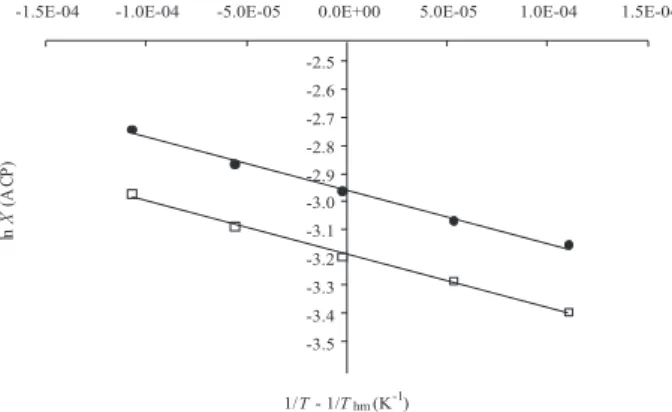
As an example, Figure 2 shows the modified van’t Hoff plot for ACP in mixtures having 80% and 90% of PG. Linear models with good correlation coefficients were obtained in all mixtures studied. For this reason, the equation (4) is useful to estimate the ∆Hs0
o a l p n
p values for
ACP in the PG + W cosolvent system.
For non-ideal solutions, the slope obtained in equation (4) does not give directly the heat of solution. Therefore, it is necessary to consider the variation of solute
thermodynamic activity (a2) with concentration at constant temperature and pressure.8,18 Then, the enthalpic change
of solution is calculated as:
(5)
in which, the second term of the right side is calculated by means of:8,19
(6)
The term “sat” indicates the saturation. In equation (6) the solute volumetric fraction (φ2) is required. This
property is calculated from the apparent specific volume of solute (ASV2) at saturation, and the mixture com-position. ASV2 is calculated by means of:
(7)
where, m2 and m1 are the masses of solute and solvent at saturation, respectively, SV1 is the specific volume of solvent, and ρ is the solution density. Although in a more refined treatment, the partial specific volume of solute instead of ASV2 should be used, the procedure proposed here is also adequate.
Since ACP is a solid, the thermodynamic activity at saturation equals the ideal solubility (X i
2
d )3 and therefore,
it follows that:
(8)
The term (X i 2
d / X s 2
at) in equation (8) is equal to the
solute activity coefficient in the solution (γ2) and it is an
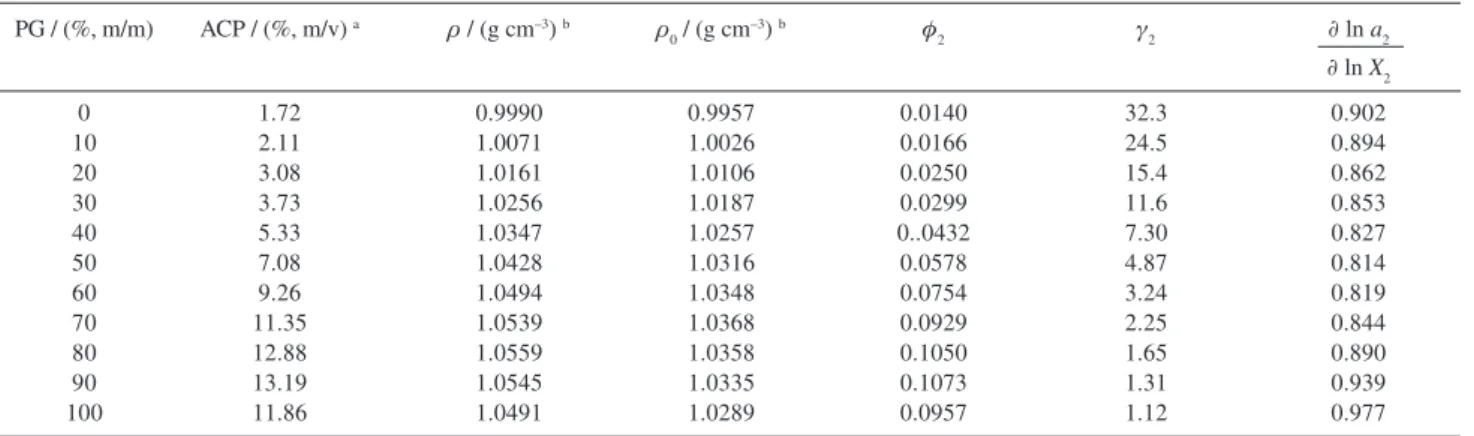
indication of the deviation presented by this one in front to ideal behavior. Table 3 shows the experimental % (m/v) solubilities, saturated solution densities, cosolvent mixtures densities, solute volume fractions, solute activity coefficients, and correction factors at 30.0 °C. This temperature is the nearest to 303 K. In order to calculate the γ2 and (∂ln a2/∂ln X2)T,p values some methods for
estimating propagation of errors were used.20
From the γ2 values presented in Table 3 a rough
estimate of solute-solvent intermolecular interactions can be made by considering the following expression:
(9)
where w11, w22and w12 represent the solvent-solvent, solute-solute and solvent-solute-solute interaction energies, respectively;
V2 is the molar volume of the supercooled liquid solute, and finally, φ1 is the volume fraction of the solvent. In a
first approach the term( V2φ12 / RT) may be considered
approximately constant at the same temperature, and then γ2 depends almost exclusively on w11, w22and w12.
21 The
w11 and w22 terms are unfavorable for solubility, while the
w12 term favors the solution process.
It can be seen in equation (9) that the contribution of w22
represents the work necessary to move molecules from solid state to the vapor state, and therefore it is constant in all mixtures. On the other hand, Romero et al.22 have demonstrate
recently by using calorimetric, spectroscopic, and crystallographic techniques, that ACP solid phase in excess keeps its original crystalline properties in saturated solutions in several cosolvent mixtures varying in polarity and Lewis acid-base character. Although, an increase of 8 °C in the melting point has been reported for ACP solid phase at equilibrium with saturated solutions having cosolvent proportions greater than 50 % (v/v),8 according to these authors, for practical
purposes it may be considered that the contribution of solid phase toward the overall solution process is constant for this drug in the different saturated solutions studied.
The term w11 is higher in water (δ = 47.9 MPa1/2) while
it is comparatively smaller in PG (δ = 30.3 MPa1/2).23 The
pure water and water-rich mixtures have larger γ2 values,
which means, high w11 and low w12 values. On the other hand, in PG-rich mixtures (with γ2 values close to 1.0),
the w11 values are relatively low, whereas the w12 values are higher. According to this fact, the solvation of ACP should be higher in PG-rich mixtures.
The apparent standard Gibbs energy change for the solution process (∆Gs0
o a l p
n
p) has been traditionally calculated
in literature as:21
(10)
Nevertheless considering the approach proposed by Krug et al.,13 this property is more appropriately calculated
by means of:
(11)
in which, the intercept used is the one obtained from ln
X2 vs. 1/T – 1/Thm plots (equation 4). This thermodynamic function is also corrected using the factor (∂ln a2/∂ln X2)T,P in order to express it in terms of solute thermodynamic activity instead of solute concentration.
The standard entropic change for solution process (∆Ss0
oln) is obtained from the respective ∆Hs 0
oln and ∆Gs 0 oln
values by using:
(12)
Table 4 summarizes the corrected standard thermo-dynamic functions for experimental solution process of ACP in all cosolvent mixtures including those functions for the ideal process. In order to calculate the thermo-dynamic magnitudes of experimental solution some methods for estimating propagation of errors were used.20
It was found that the standard Gibbs energy of solution was positive in all cases; i.e., the solution process apparently is not spontaneous, which may be explained in terms of the concentration scale used (mole fraction), where the reference state is the ideal solution having the unity as concentration of ACP, that is, the solid pure solute. The enthalpy of solution is positive for all cases, therefore the process is always endothermic. The entropy of solution is also positive in all cases, indicating entropy driving on overall the solution processes. The
Table 3. Solubility of ACP expressed in % (m/v), saturated solution and solvent densities, solute volumetric fraction, solute activity coefficient, and activity variation factor in PG + W cosolvent mixtures at 30.0 °C
PG / (%, m/m) ACP / (%, m/v) a ρ / (g cm–3) b ρ 0 / (g cm
–3) b φ
2 γ2 ∂ ln a2
∂ ln X2
0 1.72 0.9990 0.9957 0.0140 32.3 0.902
10 2.11 1.0071 1.0026 0.0166 24.5 0.894
20 3.08 1.0161 1.0106 0.0250 15.4 0.862
30 3.73 1.0256 1.0187 0.0299 11.6 0.853
40 5.33 1.0347 1.0257 0..0432 7.30 0.827
50 7.08 1.0428 1.0316 0.0578 4.87 0.814
60 9.26 1.0494 1.0348 0.0754 3.24 0.819
70 11.35 1.0539 1.0368 0.0929 2.25 0.844
80 12.88 1.0559 1.0358 0.1050 1.65 0.890
90 13.19 1.0545 1.0335 0.1073 1.31 0.939
100 11.86 1.0491 1.0289 0.0957 1.12 0.977
∆Hs 0
oln value in water is in good agreement with those
presented by Grant et al.6 and Bustamante and coworkers,8
that is, 23.7 and 22.5 kJ mol–1, respectively. The
∆Hs 0
oln values vary nonlinearly with PG composition
showing a maximum at 20% (m/m) of cosolvent. With the aim to compare the relative contributions by enthalpy (%ζH) and by entropy (%ζTS) toward the solution process, equations (13) and (14) were employed respectively.
(13)
(14)
From Table 4 it follows that in all cases the main contributor to standard free energy of solution process of ACP is the enthalpy (greater than 62% in all cases).
Thermodynamic functions of mixing
The solution process may be represented by the following hypothetic stages:21
Solute(Solid)→ Solute(Liquid)→ Solute(Solution)
where, fusion and mixing are the respective partial processes toward the solution process at 303 K. This approximation permits to calculate the partial thermodynamic contributions to solution process by means of equations (15) and (16).
(15)
(16)
where, ∆Hf3 u 0
s
3 and ∆S f 3 u 0
s
3 represent the thermodynamic
functions of fusion process at harmonic temperature (303 K). ∆Hf3
u 0 s
3 was calculated from ∆H f T
u s = ∆H f M
u P s
– ∆Cp(Tfus
- T) using ∆S Mf u P s
instead of ∆Cp obtaining a value of 17.98
kJ mol–1. This value is coincident with the enthalpic change
for ideal solution. In contrast, the entropy of fusion at 303 K (59.35 J mol–1 K–1) is not coincident with the entropy
of ideal solution at this temperature (36.90 J mol–1 K–1).
Nevertheless, for practical purposes, the ∆Ss0 o i l
d
n value was
used instead of ∆Sf3 u
0 s
3. In Table 5 the thermodynamic
functions of mixing of ACP are summarized.
By analyzing the partial contributions by ideal solution (related to solute fusion process) and mixing processes to the enthalpy and entropy of solution, it is found that ∆Hf3
u 0 s 3
and ∆Sf3 u 0 s
3 are positive (Table 4). On the other hand, the
contribution of the thermodynamic functions relative to mixing process toward the solution process is variable, that is, ∆H0
m ix is positive in those mixtures with PG content
equal or lower than 40% and negative for all other mixtures, while the entropy of mixing ( ∆S0
m ix) is positive
in the mixture containing 20% of PG, but negative in all other mixtures. Therefore, the entropies of mixing are in general unfavorable (negative values: Table 5). However, considering the overall solution process (that is, data from Table 4), entropy change is the driven force (positive values: Table 4) because the solution process includes the favorable entropy of melting (positive value: Table 4).
The net variation in ∆H0
m ix values results from the
contribution of several kinds of interactions. The enthalpy of cavity formation is endothermic because energy must be supplied to overcome the cohesive forces of the solvent. This process decreases solubility. On the other hand, the enthalpy of solute-solvent interaction is exothermic and it is originated mainly from the van der Waals and Lewis acid-base
a %ζ
H and %ζTS are the relative contributions by enthalpy and entropy toward Gibbs energy of solution. These values were calculated by means of equations (13) and (14), respectively.
0 10 20 30 40 50 60 70 80 90 100 ideal 13.95 (0.28) 13.29 (0.27) 11.88 (0.24) 11.07 (0.22) 9.74 (0.19) 8.71 (0.17) 7.95 (0.16) 7.42 (0.15) 7.15 (0.14) 7.01 (0.14) 6.94 (0.14) 6.80 24.4 (0.8) 23.6 (0.7) 24.4 (0.6) 20.6 (0.9) 19.6 (0.5) 16.8 (0.7) 15.5 (0.4) 13.9 (0.6) 14.1 (0.5) 14.6 (0.6) 17.0 (0.7) 17.98 34.4 (1.3) 34.0 (1.2) 41.4 (1.3) 31.5 (1.5) 32.5 (1.1) 26.7 (1.2) 24.8 (0.8) 21.5 (1.0) 22.9 (0.9) 25.1 (1.1) 33.1 (1.5) 36.90 10.4 (0.4) 10.3 (0.4) 12.5 (0.4) 9.6 (0.5) 9.9 (0.4) 8.1 (0.4) 7.5 (0.3) 6.5 (0.3) 6.9 (0.3) 7.6 (0.3) 10.0 (0.5) 11.18 70.0 69.6 66.1 68.3 66.5 67.5 67.4 68.2 67.0 65.7 62.9 61.7 30.0 30.4 33.9 31.7 33.5 32.5 32.6 31.8 33.0 34.3 37.1 38.4
Table 4. Thermodynamic functions relative to solution process of ACP in PG + W cosolvent mixtures including ideal process at 303 K
PG / (%, m/m) ∆G0
s oln/ (kJ mol
–1) ∆H0
s oln/ (kJ mol
–1) ∆S0 s oln/ (J mol
–1 K–1) Τ∆S0
s oln/ (kJ mol
–1) %ζ
H
a %ζ
TS
interactions. The structuring of water molecules around the nonpolar groups of solutes (hydrophobic hydration) contributes to decrease the net heat of mixing to small or even negative values in aqueous solutions. Nevertheless, this is not observed in the case of ACP in water (Table 5). As it was already said, the energy of cavity formation should be lower as the proportion of PG increases because the polarity of the medium decreases, which favors solute-solvent interactions. This fact is partially observed in Table 5, where ∆H0
m ix is more negative over 50% of cosolvent with a
maximum at 70% of PG. According to Romero et al.14 in the
initial portion of the solubility curve, the hydrogen bonding of ACP will increases with cosolvent concentration. At large cosolvent proportions, this interaction may be saturated, becoming a constant contribution. On the other hand, nonspecific and cavity effects are not saturated and vary with cosolvent concentration.
For comparative purposes, Figure 3 shows the thermodynamic functions of mixing, ∆G0
m ix , ∆H 0 m ix , and
Τ∆S0
m ix. All functions vary nonlinearly with composition
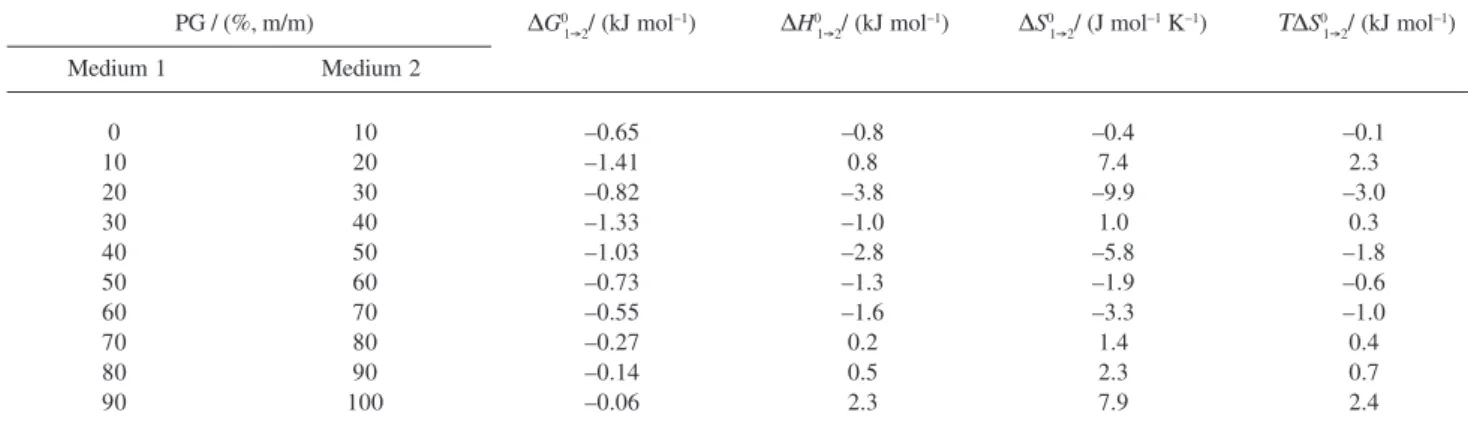
showing maxima for enthalpy and entropy at 20% of PG. In order to verify the effect of cosolvent composition on the thermodynamic function driving the solution process Table 6 summarizes the thermodynamic functions of transfer of ACP from more polar solvents
to those less polar solvents. These new functions were calculated as the differences in thermodynamic magnitudes of mixing between the less polar mixtures and the more polar mixtures. As a calculation example, in the case of transfer of ACP from pure water to 10% PG mixture (considering data of Table 5), the enthalpy of transfer (∆H10
→2) corresponds to 5.6 kJ mol –1 (∆H0
m ix in
10% PG mixture) minus 6.4 kJ mol–1 (∆H0
m ix in pure
water) obtaining the value: –0.8 kJ mol–1 (Table 6). All
other thermodynamic magnitudes of transfer were calculated on the same way.
If the addition of PG to water is considered, it happens the following: At 10% of PG (∆G10
→2< 0 and ∆H1 0
→2< 0), the
solution process is driven by enthalpy, which it is not easily explained. For ACP solubility in EtOH + W mixtures near to this composition the solution process was driven by entropy.8
At 20% of PG (∆G10
→2< 0 and ∆H1 0
→2> 0) the solubility process
is driven by the increment of entropy (∆S10
→2>0). This suggests
a decrease of the hydrophobic effect of water, produced by the addition of 20% of cosolvent. That is, the cosolvent disrupts the ordered structure of water (like “icebergs”, water-water hydrogen bonds) around de nonpolar groups of the drug, increasing the enthalpy and entropy of the system. From 30% up to 70% of PG (∆G10
→2< 0 and ∆H1 0
→2< 0) the solution
processes are driven by enthalpy; this fact is probably due to solvation of ACP. In the mixture of 40% of PG in addition to enthalpy of mixing the entropy of mixing also contributes to solution process. Finally, from 80% up to 100% of PG (∆G10
→2< 0 and ∆H1 0
→2> 0) the entropy of mixing drives the
solution process, because this property is positive and therefore it is favorable.
Thermodynamic functions of solvation
In addition to the hypothetic fusion-mixing stages previously exposed, the solution process may also be represented by the following hypothetic stages:24 0
10 20 30 40 50 60 70 80 90 100
7.15 6.50 5.09 4.27 2.94 1.91 1.18 0.63 0.35 0.21 0.15
6.4 5.6 6.5 2.6 1.6 –1.2 –2.5 –4.1 –3.9 –3.4 –1.0
–2.5 –2.9 4.5 –5.4 –4.4 –10.2 –12.1 –15.4 –14.0 –11.8 –3.8
–0.8 –0.9 1.4 –1.6 –1.3 –3.1 –3.7 –4.7 –4.3 –3.6 –1.2
89.5 86.3 82.5 62.0 55.2 27.6 40.5 46.4 47.8 48.5 46.6
10.5 13.7 17.5 38.0 44.8 72.4 59.5 53.6 52.2 51.5 53.4
Table 5. Thermodynamic functions relative to mixing process of ACP in PG + W cosolvent mixtures at 303 K
PG / (%, m/m) ∆G0
m ix/ (kJ mol
–1) ∆H0
m ix/ (kJ mol
–1) ∆S0 m ix/ (J mol
–1 K–1) Τ∆S0
m ix/ (kJ mol
–1) %ζ
H
a %ζ
TS
a
a %ζ
H and %ζTS are the relative contributions by enthalpy and entropy toward Gibbs energy of mixing. These values were calculated by means of equations (13) and (14), respectively.
Figure 3. Thermodynamic functions, relative to mixing process of ACP in PG + W cosolvent mixtures at 303 K; (squares: ∆G0
m ix; solid diamond: ∆H0
Solute(Solid)→ Solute(Vapor) → Solute(Solution)
where, the respective partial processes toward the solution process, are in this case, sublimation and solvation. This treatment permits calculate the partial thermodynamic contributions to solution process by means of equations (17) and (18), respectively, while the Gibbs energy of solvation is calculate by means of equation (19):
(17)
(18)
(19)
where, ∆Hs0
ubl = 238.85 kJ mol
–1 was taken from Williams
et al.,13 and therefore, the function ∆H
s 0
olv was calculated
from ∆Hs0
oln values presented in Table 4. The respective
entropy of sublimation was calculated as ∆Ss0
ubl = (∆Hs 0
ubl
-∆Gs0
ubl)/T at 303 K, where ∆Gs 0
ubl = - RT ln(p / p0) with p =
1.05×10⁻⁶ Pa at 303 K (calculated from some values
presented by Williams et al.9) and p
0 = 101325 Pa; then
∆Gs0
ubl = 63.71 kJ mol
–1, and therefore ∆S s 0
ubl = 577.7 J
mol–1 K–1 at the same temperature. In Table 7 the
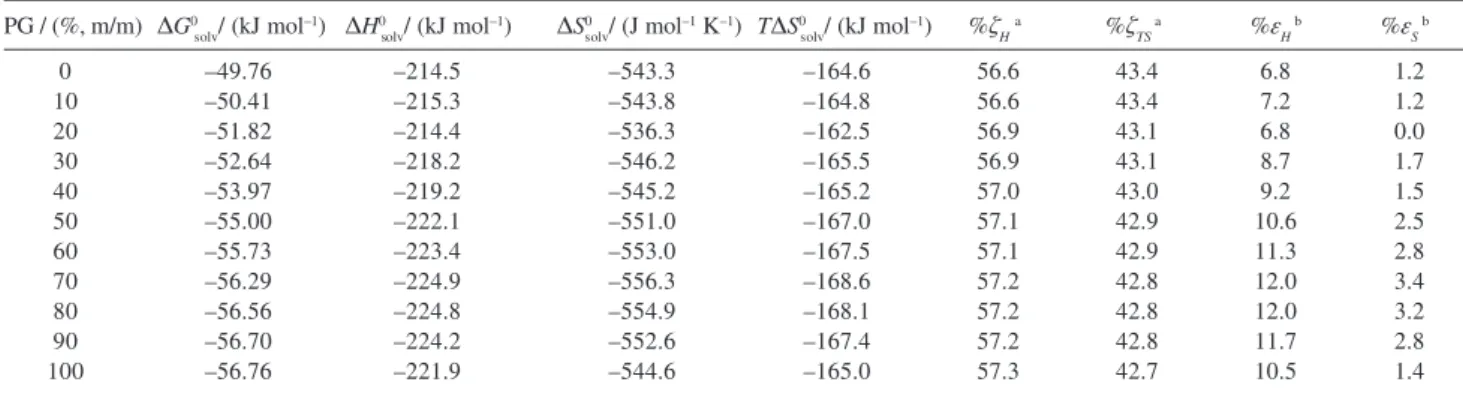
thermodynamic functions of solvation are presented, while on the other hand, with the aim to compare the relative contributions by enthalpy (%ζH) and entropy (%ζTS) toward the solvation process, two equations analogous to equations (13) and (14) were employed.
From the values of %ζH and %ζTS presented in Table 7 it follows that the main contributing force to standard Gibbs energy of the solvation process of ACP in all the cosolvent mixtures is the enthalpy (%ζHare greater than 56% in all cases).
Because that not only the main driving force of solvation process of drug compounds is important, but also the balance between specific and non-specific solute-solvent interactions as well, therefore, parameters which describe the relative ratio of specific and non-specific solute-solvent interaction in terms of enthalpies (%εH) and in terms of entropies (%εS), were used according to the following definitions introduced by Perlovich and coworkers:24
(20)
(21)
where,
∆H s0 pec=∆H s
0
oln(solvent-i)–∆H s 0
oln(cyclohex) = ∆H s 0
oln(cyclohex→solvent-i) (22)
∆Hn0
on-s pec=∆Hs 0
oln(cyclohex)–∆H s 0 ubl = ∆Hs
0
olv(cyclohex) (23)
∆Ss0 pec=∆Ss
0
oln(solvent-i)–∆Ss 0
oln(cyclohex) = ∆Ss 0
oln(cyclohex→solvent-i) (24)
∆Sn0 on-s pec=∆Ss
0
oln(cyclohex) (25)
Cyclohexane was chosen as an “inert” solvent, which interacts with drug molecules solely by nonspecific interactions (dispersion forces), while the cosolvent mixtures interact with ACP by specific interactions such as hydrogen bonding. Benzene and hexane have also been used as inert solvents in the study of naproxen although important differences have been found between these two solvents, indicating some effect of π electrons and planar geometry of benzene on non-specific interactions of that drug.24
Solubility data for ACP in cyclohexane taken from Baena et al.25 were analyzed according to equations (4),
Table 6. Thermodynamic functions of transfer of ACP from more polar solvents to less polar solvents in PG + W cosolvent mixtures at 303 K
PG / (%, m/m) ∆G0
1 →2/ (kJ mol–1) ∆H01 →2/ (kJ mol–1) ∆S01 →2/ (J mol–1 K–1) Τ∆S01 →2/ (kJ mol–1)
Medium 1 Medium 2
0 10 20 30 40 50 60 70 80 90
10 20 30 40 50 60 70 80 90 100
–0.65 –1.41 –0.82 –1.33 –1.03 –0.73 –0.55 –0.27 –0.14 –0.06
–0.8 0.8 –3.8 –1.0 –2.8 –1.3 –1.6 0.2 0.5 2.3
–0.4 7.4 –9.9
1.0 –5.8 –1.9 –3.3 1.4 2.3 7.9
–0.1 2.3 –3.0
0.3 –1.8 –0.6 –1.0 0.4 0.7 2.4
These magnitudes were calculated as ∆Ψ0 1 →2 = ∆Ψ
0
mix(Medium 2: less polar) – ∆Ψ 0
(11), and (12) founding the following values for apparent thermodynamic functions: ∆Hs0
o a l n
pp
(CH) = 38.1 kJ mol –1,
∆Gs0 o a l p n p
(CH) = 25.61 kJ mol
–1, and ∆S s 0 o a l p n p
(CH) = 41.2 J mol –1
K–1. The apparent specific volume of ACP in cyclohexane
obtained by using densities of solvent and saturated solutions was a negative value (due to very scarce solubility and uncertainty in density measurements). For this reason, in order to calculate the (∂ln a2/∂ln X2)T,P for ACP in this solvent, the molar volume of drug was calculate by means of Fedors method26 obtaining a value
of 124.4 cm3 mol–1. From this value and the solubility at
303 K, the value obtained for (∂ln a2/∂ln X2)T,P using equation (8) was 0.9994. Since this value is included into the uncertainty obtained in thermodynamic functions of solution, then, the apparent values were used instead of corrected values.
The %εH and %εS values for ACP solvation are also presented in Table 7. These values indicate that during dissolution of ACP in all mixtures studied, the specific solute-solvent interactions (hydrogen bonding, mainly) do not affect the entropic term of free energy with respect to non-specific interactions. With regard to the enthalpic term in all cases the non-specific solute-solvent interactions predominate.
Enthalpy-entropy compensation of solution
Bustamante et al.8 have demonstrated some chemical
compensation effects for the solubility of several drug compounds in aqueous cosolvent mixtures. This analysis was used in order to identify the mechanism of the cosolvent action. The making of weighted graphs of ∆Hs0
oln as a function of ∆Gs 0
oln at mean harmonic temperature
permits to observe similar mechanisms for the solution process according to tendencies obtained.27
For solubility of ACP in EtOH + W, Bustamante and coworkers8 obtained a nonlinear trend using seven
cosolvent compositions, including the pure solvents. Their data were adjusted to a parabolic regression model obtaining a maximum for 20% v/v of EtOH. From 0 up to 20% v/v of EtOH a negative slope was obtained while over this EtOH proportion a positive slope was obtained. According to these authors, this fact implies a change from entropy driving to enthalpy driving toward the solution process.
On the other hand, Figure 4 shows the corrected ∆Hs 0
oln and ∆Gs 0
oln values for solubility of ACP in PG + W
mixtures obtaining a trend slightly more complex compared with that presented by Bustamante and coworkers8 for EtOH + W mixtures.
Figure 4 shows fully that this solute-cosolvent system does not present linear ∆Hs 0
oln - ∆Gs 0
oln compensation in
all compositions studied. Nevertheless, if an interval from 20% up to 80% of PG is considered an apparent linear trend is observed with positive slope (without considering 30% of PG). According to this graph it follows that from pure water up to 10% of PG and from 20% up to 70% of PG the dominant mechanism for solubility is the enthalpy, while from 10% up to 20% of PG and from 70% up to 100% of PG the dominant mechanism is the entropy.
Conclusions
From all aspects discussed previously it can be concluded that the solution process of ACP in PG + W mixtures is very complex and highly dependent on cosolvent composition. The solvation of this drug is greater for PG-rich mixtures especially at 70% of PG. In a similar way to that found for the solubility of this drug in EtOH + W mixtures, the solution process in PG + W mixtures does
0 10 20 30 40 50 60 70 80 90 100 –49.76 –50.41 –51.82 –52.64 –53.97 –55.00 –55.73 –56.29 –56.56 –56.70 –56.76 –214.5 –215.3 –214.4 –218.2 –219.2 –222.1 –223.4 –224.9 –224.8 –224.2 –221.9 –543.3 –543.8 –536.3 –546.2 –545.2 –551.0 –553.0 –556.3 –554.9 –552.6 –544.6 –164.6 –164.8 –162.5 –165.5 –165.2 –167.0 –167.5 –168.6 –168.1 –167.4 –165.0 56.6 56.6 56.9 56.9 57.0 57.1 57.1 57.2 57.2 57.2 57.3 43.4 43.4 43.1 43.1 43.0 42.9 42.9 42.8 42.8 42.8 42.7 6.8 7.2 6.8 8.7 9.2 10.6 11.3 12.0 12.0 11.7 10.5 1.2 1.2 0.0 1.7 1.5 2.5 2.8 3.4 3.2 2.8 1.4
Table 7. Thermodynamic functions relative to solvation process of ACP in PG + W cosolvent mixtures at 303 K
PG / (%, m/m) ∆G0
s olv/ (kJ mol –1) ∆H0
s olv/ (kJ mol
–1) ∆S0 s olv/ (J mol
–1 K–1) T∆S0
s olv/ (kJ mol –1) %ζ
H
a %ζ
TS
a %ε
H
b %ε
S
b
a %ζ
H and%ζTS are the relative contributions by enthalpy and entropy toward Gibbs energy of solvation. These values were calculated by means of equations (13) and (14), respectively; b %ε
not follows linear enthalpy-entropy compensation using ∆Hs 0
oln as a function of ∆Gs 0
oln. This fact at its time is explained
as entropy or enthalpy driving for solution process according to the cosolvent mixture composition. Finally, it can be said that all values presented amply the physicochemical information useful in the design of homogeneous liquid pharmaceutical dosage forms.
Acknowledgments
We thank the Banco de la República and the DIB-DINAIN of the Universidad Nacional de Colombia (UNC) for the financial support. Additionally we thank the Department of Pharmacy of UNC for facilitating the equipment and laboratories used.
References
1. Roberts II, L.J.; Morrow, J.D. In Goodman & Gilman’s. The Pharmacological Basis of Therapeutics, 10th ed.; Hardman, J.
G.; Limbird, L. E.; Gilman, A. G., eds.; McGraw-Hill: New York, 2001, ch. 27.
2. Pérez, D. C.; Guevara, C. C.; Cárdenas, C. A.; Pinzón, J. A.; Barbosa H. J.; Martínez, F.; Rev. Col. Cienc. Quím. Farm. 2003, 32, 116.
3. Rubino, J.T. In Encyclopedia of Pharmaceutical Technology; Swarbrick, J.; Boylan, J. C., eds.; Marcel Dekker: New York, 1988, vol. 3; Yalkowsky, S. H.; Solubility and Solubilization in Aqueous Media; American Chemical Society and Oxford University Press: New York, 1999.
4. Jiménez, F.; Martínez, F.; Rev. Col. Cienc. Quím. Farm. 1995, 24, 19.
5. Garzón, L.C.; Martínez, F.; J. Solut. Chem. 2004, 33, 1379. 6. Grant, D. J. W.; Mehdizadeh, M.; Chow, A. H. L.; Fairbrother,
J. E.; Int. J. Pharm. 1984, 18, 25.
7. Etman, M. A.; Naggar, V. F.; Int. J. Pharm. 1990, 58, 177. 8. Bustamante, P.; Romero, S.; Reillo, A.; Pharm. Sci. 1995, 1,
505; Bustamante, P.; Romero, S.; Peña, A.; Escalera, B.; Reillo, A.; J. Pharm. Sci. 1998, 87, 1590.
9. Martínez, F.; Rev. Acad. Colomb. Cienc. 2005, 29, 429. 10. US Pharmacopeia, 23rd ed., United States Pharmacopeial
Convention: Rockville, MD, 1994.
11. Coronado, Y. P.; Fonseca, J. C.; Luengas, P. E.; Barbosa, H. J.; Martínez, F.; Rev. Col. Cienc. Quím. Farm. 1999, 28, 59. 12. Budavari, S.; O’Neil, M. J.; Smith, A.; Heckelman, P. E.;
Obenchain Jr., J. R.; Gallipeau, J. A. R.; D’Arecea, M. A.; The Merck Index, An Encyclopedia of Chemicals, Drugs, and
Biologicals, 13th ed.; Merck & Co., Inc.: Whitehouse Station,
NJ, 2001.
13. http://www.euroestar-science.org/conferences/abstrsph7/ wilson.pdf; accessed in October 2004.
14. Romero, S.; Reillo, A.; Escalera, B.; Bustamante, P.; Chem. Pharm. Bull. 1996, 44, 1061.
15. Dearden, J. C.; J. Pharm. Sci. 1972, 61, 1661.
16. Hildebrand, J. H.; Prausnitz, J. M.; Scott, R. L.; Regular and Related Solutions; Van Nostrand Reinhold: New York, 1970. 17. Krug, R. R.; Hunter, W. G.; Grieger, R. A.; J. Phys. Chem.
1976, 80, 2341.
18. Hollenbeck, R. G.; J. Pharm. Sci. 1980, 69, 1241.
19. Manzo, R. H.; Ahumada, A. A.; J. Pharm. Sci. 1990, 79, 1109. 20. Bevington, P. R.; Data Reduction and Error Analysis for the Physical Sciences; McGraw-Hill Book Co.: New York, 1969; Schoemaker, D. P.; Garland, G. W.; Experimentos de Fisicoquímica; Unión Tipográfica Editorial Hispano Americana: México, 1968.
21. Martínez F.; Gómez, A.; J. Solut. Chem. 2001, 30, 909. 22. Romero, S.; Bustamante, P.; Escalera, B.; Cirri, M.; Mura, P.;
J. Therm. Anal. Calorim. 2004, 77, 541.
23. Martin, A.; Bustamante, P.; Chun, A. H. C.; Physical Pharmacy: Physical Chemical Principles in the Pharmaceutical Sciences, 4th ed.; Lea & Febiger: Philadelphia, 1993.
24. Perlovich, G. L.; Kurkov, S. V.; Bauer-Brandl, A.; Eur. J. Pharm. Sci. 2003, 19, 423; Perlovich, G. L.; Kurkov, S. V.; Kinchin A. N.; Bauer-Brandl, A.; Eur. J. Pharm. Biopharm. 2004, 57, 411. 25. Baena, Y.; Pinzón, J. A.; Barbosa, H.; Martínez, F.; Phys. Chem.
Liq. 2004, 42, 603.
26. Fedors, R. F.; Polym. Eng. Sci. 1974, 14, 147.
27. Leffler, J. E.; Grunwald, E.; Rates and Equilibria of Organic Reactions; Wiley: New York, 1963; Tomlinson, E.; Int. J. Pharm. 1983, 13, 115.
Received: July 13, 2005
Published on the web: December 15, 2005