Artigo
*e-mail: [email protected]
SOLUTION THERMODYNAMICS OF METHOCARBAMOL IN SOME ETHANOL + WATER MIXTURES
Katia C. Mercado, Gerson A. Rodríguez, Daniel R. Delgado y Fleming Martínez*
Departamento de Farmacia, Facultad de Ciencias, Universidad Nacional de Colombia, Cra. 30 No. 45-03, Bogotá, D. C., Colombia
Asma Romdhani
Faculty of Pharmacy, University of Monastir, Tunisia
Recebido em 26/2/12; aceito em 16/6/12; publicado na web em 21/9/12
Apparent thermodynamic functions, Gibbs energy, enthalpy and entropy of solution and mixing, for methocarbamol in ethanol + water mixtures, were evaluated from solubility data determined at temperatures from 293.15 K to 313.15 K and from calorimetric values of drug fusion. The drug solubility was greatest in the mixtures with 0.70 or 0.80 mass fraction of ethanol and lowest in neat water across all temperatures studied. Non-linear enthalpy-entropy compensation was found for the dissolution processes. Accordingly, solution enthalpy drives the respective processes in almost all the solvent systems analyzed.
Keywords: cosolvency; methocarbamol; solubility.
INTRODUCTION
Methocarbamol (MTC, Figure 1, 2-hydroxy-3-(2-methoxypheno-xy) propyl carbamate, molar mass 241.24 g mol-1, CAS: 532-03-6) is
a centrally acting muscle relaxant drug widely used in therapeutics. This drug is sometimes combined with acetaminophen or aspirin to treat some painful muscle episodes.1 It is commercially available as
tablets and in injectable forms.2 The aqueous solubility of this drug is
almost 25 g dm-3.3 For several reasons, physicochemical information
on the solubility and dissolution rate of active ingredients is very important from a pharmaceutical point of view.4
With this in mind, the present work studied the thermodynamic aspects of the solubility of MTC in cosolvent mixtures of ethanol and water, as has been carried out by our research group for several anal-gesic drugs such as acetaminophen, ibuprofen, naproxen, ketoprofen, meloxicam, and indomethacin.5 It is well known that ethanol is the
cosolvent most widely used in liquid medicine design, especially those intended for peroral and parenteral administration.6 Several
examples of pharmaceutical formulations using these cosolvents have been presented by Rubino.7 It is noteworthy that this cosolvent
also has antimicrobial properties.6
As previously described, the solubility behavior of drugs in cosolvent mixtures is very important because cosolvent blends are frequently used in purification methods, preformulation studies, and pharmaceutical dosage form design, among other applications.7,8
Therefore, it is important to systematically determine the solubi-lity of pharmaceutical compounds in a wide variety of solvents, particularly in the alcoholic aqueous solvents, because they are widely employed in the development of pharmaceutical products. In addition, the temperature dependence of solubility allows us to
carry out thermodynamic analysis which, on the other hand, also provides insights into the molecular mechanisms involved in the solution processes.5
The main goal of the present work was to present more complete and systematic information about the thermodynamic properties of dissolution in alcoholic media, and transfer between cosolvent mix-tures of different polarity, for this drug. The solubility equilibrium was determined at several temperatures in the neat solvents and in the binary cosolvent mixtures and subsequently the respective disso-lution thermodynamic analysis was performed using the van’t Hoff and Gibbs equations. Moreover, by using the values obtained for the MTC fusion process, the contribution of the mixing-process to the overall drug dissolution process was also analyzed.
EXPERIMENTAL
Reagents and materials
The methocarbamol, absolute ethanol A. R. (Merck, Germany), and distilled water with conductivity < 2 µS cm-1, used in this
research met the respective quality requirements of the American Pharmacopeia, USP;9 where molecular sieve (Merck, numbers 3
and 4) and Millipore Corp. Swinnex®-13 filter units were also used.
Solvent mixture preparation
All ethanol + water solvent mixtures were prepared by mass, using an Ohaus Pioneer TM PA214 analytical balance with a sensitivity of ± 0.1 mg, in quantities of 50.00 g. The mass fractions of ethanol (wEtOH) of the nine binary mixtures prepared varied by 0.10 from 0.10
to 0.90 to cover all the rank of compositions.
Solubility determinations
The procedures followed here were similar to those used earlier for studying other drugs;5 briefly, an excess of MTC was added to
Electron Company) kept at 293.15 or 298.15 (± 0.05) K with sporadic manual stirring for at least 7 days to reach the saturation equilibrium. After this period, the supernatant solutions were filtered to ensure they were free of particulate matter before sampling. MTC concentrations were determined by mass balance upon weighing a specified quantity of the respective saturated solution and allowing solvent evaporation up to constant mass. Equilibrium time was established by measuring the MTC concentrations until becoming constant. All the solubility experiments were run at least in triplicate. In order to determine the equivalence between mole fraction and molarity concentration scales, the density of the saturated solutions was determined with a digital density meter (DMA 45 Anton Paar) connected to the same recirculating thermostatic baths.
Calorimetric study
Melting point and enthalpy of fusion of MTC were determined by DSC studies (DSC 823E Mettler Toledo). Thermal analyses were performed at a heating rate of 10 K min-1 under a dynamic nitrogen
atmosphere (60 cm3 min-1). Approximately 1.5 mg of drug was used.
The equipment was calibrated using Indium as the standard.10 RESULTS AND DISCUSSION
In order to propose possible intermolecular interactions, it is important to point out that this drug could act in solution as Lewis acid (–OH and –NH2 groups) and Lewis base (–OH, –O–, and >C=O
groups) to establish hydrogen bonds with proton-acceptor or donor functional groups present in the solvents (–OH groups).4
Ideal and experimental solubility of MTC
Table 1 shows the experimental solubilities of MTC expressed in mole fractions, x2, as well as the ideal values, calculated using
Equation 1. It is important to bear in mind that ideal drug solubility is only dependent on solid-solute properties without considering the solvent properties. Thus, ideal solubility depends both on tem-perature and enthalpy of fusion of the drug.4 In almost all cases, the
coefficients of variation of the experimental solubility were lower than 2.0%. Similarly, Figure 2 shows MTC solubility expressed in molarity at all temperatures studied. It is important to note that the values expressed in this volumetric concentration scale could be useful
for tasks associated with design and development of liquid dosage forms at industrial pharmaceutical level.
The highest solubility value in mole fraction for this drug was obtained in the mixture of 0.80 in mass fraction of ethanol at 313.15 K, while the lowest value was found in neat water at 293.15 K. Comparing solubility in neat solvents, the greatest solubility at all temperatures is found in neat ethanol. Our solubility value in neat water at room temperature (298.15 K) was lower than that reported in the literature.3 On the other hand, to the best of our knowledge, no
solubility values for this drug in these solvents have been reported in the literature,11 and therefore, no direct comparison is possible.
Because the MTC maximum solubility was obtained in a cosol-vent mixture as opposed to neat ethanol, the Hildebrand solubility parameter (δ2) could be assigned for this drug considering that, in
agreement with the literature, the greatest solubility is obtained in the solvent with the same δ value as the one of the drug.12 Thus, the
δ value of MTC is the same as the one for the cosolvent mixture with wEtOH = 0.70, that is, 31.7 MPa
1/2 at 298.15 K.13
On the other hand, the ideal solubility of a crystalline solute can be calculated using Equation 1:5
(1)
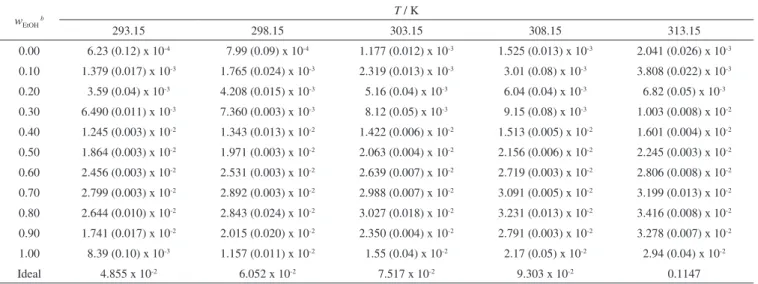
Table 1. Experimental solubility of methocarbamol in ethanol + water mixtures expressed as mole fraction at several temperaturesa
wEtOH
b T / K
293.15 298.15 303.15 308.15 313.15
0.00 6.23 (0.12) x 10-4 7.99 (0.09) x 10-4 1.177 (0.012) x 10-3 1.525 (0.013) x 10-3 2.041 (0.026) x 10-3 0.10 1.379 (0.017) x 10-3 1.765 (0.024) x 10-3 2.319 (0.013) x 10-3 3.01 (0.08) x 10-3 3.808 (0.022) x 10-3 0.20 3.59 (0.04) x 10-3 4.208 (0.015) x 10-3 5.16 (0.04) x 10-3 6.04 (0.04) x 10-3 6.82 (0.05) x 10-3 0.30 6.490 (0.011) x 10-3 7.360 (0.003) x 10-3 8.12 (0.05) x 10-3 9.15 (0.08) x 10-3 1.003 (0.008) x 10-2 0.40 1.245 (0.003) x 10-2 1.343 (0.013) x 10-2 1.422 (0.006) x 10-2 1.513 (0.005) x 10-2 1.601 (0.004) x 10-2 0.50 1.864 (0.003) x 10-2 1.971 (0.003) x 10-2 2.063 (0.004) x 10-2 2.156 (0.006) x 10-2 2.245 (0.003) x 10-2 0.60 2.456 (0.003) x 10-2 2.531 (0.003) x 10-2 2.639 (0.007) x 10-2 2.719 (0.003) x 10-2 2.806 (0.008) x 10-2 0.70 2.799 (0.003) x 10-2 2.892 (0.003) x 10-2 2.988 (0.007) x 10-2 3.091 (0.005) x 10-2 3.199 (0.013) x 10-2 0.80 2.644 (0.010) x 10-2 2.843 (0.024) x 10-2 3.027 (0.018) x 10-2 3.231 (0.013) x 10-2 3.416 (0.008) x 10-2 0.90 1.741 (0.017) x 10-2 2.015 (0.020) x 10-2 2.350 (0.004) x 10-2 2.791 (0.003) x 10-2 3.278 (0.007) x 10-2 1.00 8.39 (0.10) x 10-3 1.157 (0.011) x 10-2 1.55 (0.04) x 10-2 2.17 (0.05) x 10-2 2.94 (0.04) x 10-2 Ideal 4.855 x 10⁻² 6.052 x 10⁻² 7.517 x 10⁻² 9.303 x 10⁻² 0.1147
a Values in parentheses are standard deviations. bwEtOH is the mass fraction of ethanol in the cosolvent mixture free of methocarbamol.
where x2-id is the ideal solubility of the solute in mole fraction, ∆fusH
is the molarenthalpy of fusion of the pure solute (at the melting point), Tfusis the absolute melting point, T is the absolute solution
temperature, R is the gas constant (8.314 J mol-1 K-1), and ∆C p is the
difference between the molar heat capacity of the crystalline form and the molar heat capacity of the hypothetical super-cooled liquid form, both at the solution temperature.5 Since ∆C
p cannot be easy
experimentally determined, it is usually assumed that it may be ap-proximated to the entropy of fusion, ∆fusS calculated as the quotient
∆fusH/Tfus.
5 The values obtained by DSC for ∆
fusH and Tfuswere 40.06
kJ mol-1 and 369.8 K, respectively. Ideal solubility values of MTC are
also given in Table 1. In all cases, the ideal solubilities were greater than the experimental values despite cosolvent mixture composition.
MTC activity coefficients
The solute activity coefficient in the solution (γ2) is calculated as
the quotient x2-id/x2 and is an indication of the deviation presented by
MTC from its ideal behavior.5 Table 2 shows MTC activity coefficients
as a function of cosolvent composition and temperature. Accordingly, at 298.15 K γ2 values vary from 75 in neat water to 2 in the mixture
with 0.70 in mass fraction of ethanol (where the maximum solubility is found at this temperature). On the other hand, γ2 values rise with
increase in temperature in almost all cosolvent systems (except in both neat solvents and the mixture with 0.10 in mass fraction of ethanol), indicating the deviation from ideal solubility behavior with increase in temperature, as the values differ from unity.
From the different magnitudes obtained for the γ2 values shown
in Table 2, a rough estimation of solute-solvent intermolecular in-teractions can be attained by considering the following expression:
(2) where e11, e22y e12 represent the solvent-solvent, solute-solute and
solvent-solute interaction energies, respectively; V2 is the molar
volume of the supercooled liquid solute, and finally, φ1 is the
vo-lume fraction of the solvent. A first approach shows that the term (V2f1
2/RT)
T,P may be considered approximately constant at the same
temperature, and then γ2 depends almost exclusively on e11, e22and
e12.
14 While the term e
12 term favors the solution process, both e11 and
e22 terms are unfavorable for solubility. This occurs because energy
must be supplied first, against the cohesive forces of the solute to separate them, and second, against the cohesive forces of the solvent to create the respective cavity (for solute accommodation). These processes decrease drug solubility. On the other hand, solute-solvent interaction is exothermic and results mainly from van der Waals and Lewis acid-base interactions, which increases the drug solubility. The contribution of e22 is proportional to the work necessary to transfer
drug molecules from the solid to the vapor state and therefore could be considered as constant in all mixtures and pure solvents.
As previously mentioned, the γ2 values vary from 2 to 75
indi-cating quasi-ideal solubility behavior of this drug in the mixture of maximum solubility (wEtOH = 0.70). It is important to note that this
drug has low temperature of fusion but relatively high enthalpy of fusion and therefore the term e22 should not be overly big.
14 Similarly,
ethanol and water are hydrogen-bonded solvents implying the e11 term
is relatively large in all mixtures, particularly in water-rich mixtures.4
Therefore, the term e12 would be significant to obtain the low γ2 values
shown in Table 2 (even in water) considering that values approaching 5000 can be found for some analgesic drugs in this polar solvent.5
In other words, the solute-solvent interactions are very important for dissolution of this drug in these cosolvent mixtures and may be based predominantly on hydrogen bonding.
Apparent thermodynamic functions of solution
According to van’t Hoff analysis, the apparent standard enthalpy change of solution (∆solnH°) for non-electrolyte drugs is obtained by
Equation 3:
(3)
where R is the universal gas constant (8.314 J mol–1 K–1) and
Thm is the mean harmonic temperature Thm, which is obtained as
, where n is the number of temperatures studied. Thm is 303.0 K in the present case.
5,15 As an example, Figure 3 shows
the modified van’t Hoff plot for methocarbamol solubility in mix-tures containing 0.20, 0.40, and 0.60 in mass fraction of ethanol. In all cases, linear models with good determination coefficients (r2)
were obtained.
The apparent standard Gibbs energy change for the solution process (∆solnG°) of non-electrolyte drugs considering the approach
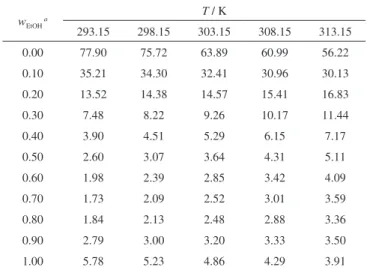
Table 2. Activity coefficients of methocarbamol in ethanol + water mixtures at several temperatures
wEtOH
a T / K
293.15 298.15 303.15 308.15 313.15 0.00 77.90 75.72 63.89 60.99 56.22 0.10 35.21 34.30 32.41 30.96 30.13 0.20 13.52 14.38 14.57 15.41 16.83 0.30 7.48 8.22 9.26 10.17 11.44
0.40 3.90 4.51 5.29 6.15 7.17
0.50 2.60 3.07 3.64 4.31 5.11
0.60 1.98 2.39 2.85 3.42 4.09
0.70 1.73 2.09 2.52 3.01 3.59
0.80 1.84 2.13 2.48 2.88 3.36
0.90 2.79 3.00 3.20 3.33 3.50
1.00 5.78 5.23 4.86 4.29 3.91
aw
EtOH is the mass fraction of ethanol in the cosolvent mixture free of metho-carbamol.
proposed by Krug et al.,15 is calculated at mean harmonic
tempera-ture by,
(4) in which the intercept used is that obtained in the analysis of ln x2 as
a function of 1/T – 1/Thm as shown in Figure 3. This intercept
corres-ponds to the ln x2 value obtained from the respective regression linear
model by interpolation at 303.0 K (Figure 3). Finally, the apparent standard entropic change for the solution process (∆solnS°) is obtained
from the respective ∆solnH° and ∆solnG° values based on the equation:
(5)
Table 3 summarizes the apparent standard thermodynamic func-tions for the experimental solution process of MTC in all ethanol + water solvent mixtures. In order to calculate the thermodynamic quantities for the experimental solution processes, several methods for estimating the propagation of uncertainties were used.16 In particular,
the uncertainty in enthalpy was calculated from the respective uncer-tainty in the van’t Hoff plot slope, multiplied by the universal constant R. The uncertainty in Gibbs energy was calculated as the mean of the variation coefficients obtained in solubility values obtained at all temperatures. Finally, the uncertainty in entropy was obtained as the root square of the sum of squares of uncertainties obtained for enthalpy and Gibbs energy.16 It was found that the standard Gibbs
energy of the solution was positive in all solvent systems studied, as expected given the solute mole fraction is always lower than one (and therefore its logarithmic term is a negative quantity, i.e. intercepts in Figure 3), which leads to the obtention of standard Gibbs energy values as positive quantities. ∆solnG° values diminish from neat water
to the mixture of 0.80 in mass fraction of ethanol and later increase. The apparent enthalpy of solution was positive in all cases, the-refore the process is always endothermic. By contrast, the entropy of solution was only positive for the mixtures with composition 0.00 ≤wEtOH≤ 0.30 and 0.80 ≤wEtOH≤ 1.00 yet was negative for the
other compositions, indicating entropy driving in the overall solution process for water-rich and ethanol-rich mixtures. In contrast to Gibbs energy of solution, ∆solnH° and ∆solnS° values decrease from neat water
to the mixtures of 0.70 and 0.60 in mass fraction of ethanol, respec-tively, then increase beyond this mixture composition. These results
are similar to those reported for the antimicrobial drug triclocarban in ethanol + propylene glycol mixtures;17 although it is clear that
both drugs have different molecular structures (MTC being more polar than triclocarban owing to its higher number of polar groups) whereas water and propylene glycol exhibit different behaviors in their mixtures with ethanol. Moreover, the effect of cosolvents on possible mixed solvent-structural effects should also be considered.
In order to compare the relative contributions of enthalpy (ζH)
and entropy (ζTS) to the solution processes, Equations 6 and 7 were
employed, respectively.18
(6)
(7)
From Table 3, it follows that enthalpy is the main contributor to standard Gibbs energy of solution of this drug in all the cosolvent systems studied and thus the energetic factor predominates.
Apparent thermodynamic functions of mixing of MTC
As previously described, the solution process may be represented by the following hypothetical stages,19
Solute(Solid) → Solute(Liquid) at Tfus → Solute(Liquid) at Thm→ Solute(Solution)
where the solution stages are solute fusion, cooling the liquid solute to the mean harmonic temperature Thm (303.0 K),and subsequent
mixing of the hypothetical super-cooled liquid solute with the solvent at this temperature. This also allows the calculation of the partial thermodynamic contributions to the overall solution process using Equations 8 and 9, respectively.
∆solnH° = ∆fusH 303 + ∆
mixH° (8)
∆solnS° = ∆fusS 303 + ∆
mixS° (9)
where ∆fusH 303 and ∆
fusS
303 represent the thermodynamic functions
of fusion of MTC and its cooling to the mean harmonic tempe-rature, 303.0 K. However, the ∆solnH°
id and ∆ solnS°
id values for the
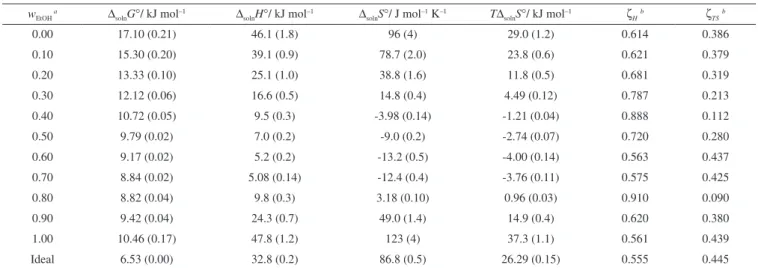
Table 3. Apparent thermodynamic functions relative to solution process of methocarbamol in ethanol + water mixtures at 303.0 K
wEtOH
a ∆
solnG°/ kJ mol
–1 ∆
solnH°/ kJ mol
–1 ∆
solnS°/ J mol
–1 K–1 T∆
solnS°/ kJ mol
–1 ζHb ζTSb
0.00 17.10 (0.21) 46.1 (1.8) 96 (4) 29.0 (1.2) 0.614 0.386
0.10 15.30 (0.20) 39.1 (0.9) 78.7 (2.0) 23.8 (0.6) 0.621 0.379
0.20 13.33 (0.10) 25.1 (1.0) 38.8 (1.6) 11.8 (0.5) 0.681 0.319
0.30 12.12 (0.06) 16.6 (0.5) 14.8 (0.4) 4.49 (0.12) 0.787 0.213
0.40 10.72 (0.05) 9.5 (0.3) -3.98 (0.14) -1.21 (0.04) 0.888 0.112
0.50 9.79 (0.02) 7.0 (0.2) -9.0 (0.2) -2.74 (0.07) 0.720 0.280
0.60 9.17 (0.02) 5.2 (0.2) -13.2 (0.5) -4.00 (0.14) 0.563 0.437
0.70 8.84 (0.02) 5.08 (0.14) -12.4 (0.4) -3.76 (0.11) 0.575 0.425
0.80 8.82 (0.04) 9.8 (0.3) 3.18 (0.10) 0.96 (0.03) 0.910 0.090
0.90 9.42 (0.04) 24.3 (0.7) 49.0 (1.4) 14.9 (0.4) 0.620 0.380
1.00 10.46 (0.17) 47.8 (1.2) 123 (4) 37.3 (1.1) 0.561 0.439
Ideal 6.53 (0.00) 32.8 (0.2) 86.8 (0.5) 26.29 (0.15) 0.555 0.445
aw
EtOH is the mass fraction of ethanol in the solvent mixture free of methocarbamol.
bζ
H and ζTS are the relative contributions by enthalpy and entropy toward
ideal solution processes were used instead of ∆fusH 303 and ∆
fusS 303 for
reasons described in the literature.5 Briefly, ∆ fusH
303 is calculated as ∆fusH
MP – ∆C
p(Tfus – T) by using ∆fusS
MP instead of ∆C
p obtaining a
value of 32.8 kJ mol–1, which is coincident with the enthalpic change
for an ideal solution of this drug (Table 3); in contrast, the entropy of fusion at 303.0 K (108.4 J mol–1 K–1) is not coincident with the
entropy of ideal solution at this temperature (86.8 J mol–1 K–1). This
same substitution has also been used with some analgesic drugs studied under similar conditions in this solvent system.5 Figure 4
summarizes the thermodynamic functions of mixing of super-cooled liquid MTC with the solvent mixtures. ∆mixG° values are positive
indicating apparently non-spontaneity of the liquid mixing process. This result is in agreement with the fact that experimental solubility in all cases was lower than the ideal value.
The ideal dissolution contributions (related to solute fusion pro-cess) to the enthalpy and entropy of dissolution of MTC, ∆solnH°
id and
∆solnS°
id values are positive (Table 3), as also are the thermodynamic
quantities of mixing in the neat solvents. On the other hand, in almost all the mixtures, both thermodynamic quantities of mixing are negati-ve (except for enthalpy in the mixture wEtOH = 0.10) indicating enthalpy
driving alone in this hypothetical sub-process given its exothermic nature. This result is also similar to that reported for triclocarban in ethanol + propylene glycol mixtures.17
Apparent thermodynamic functions of transfer of MTC
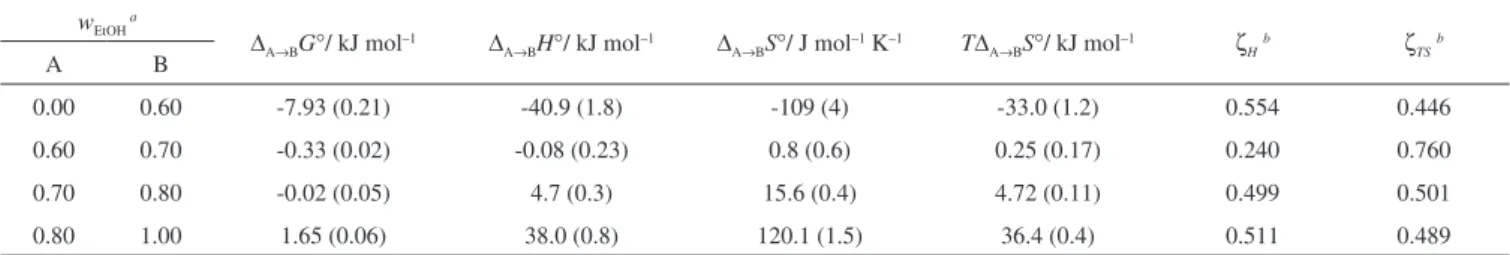
In order to verify the effect of cosolvent composition on the ther-modynamic function driving the solution process, Table 4 summarizes the thermodynamic functions of transfer of MTC from the more polar solvents to the less polar. These new functions were calculated as the differences between the thermodynamic quantities of solution in the more polar mixtures and the less polar mixtures.
If the addition of ethanol to water is considered (with solvent mixture becoming less polar as ethanol proportion increases), as done in an earlier study,5 the following occurs:
i) from neat water to 0.60 in mass fraction of ethanol (∆A→BG° < 0, ∆A→BH° < 0, and ∆A→BS° < 0) the solution process is driven by
enthalpy;
ii) from this composition up to 0.70 in mass fraction of ethanol (∆A→BG° < 0, ∆A→BH° < 0, and ∆A→BS° > 0) the dissolution process
is both enthalpy and entropy driven;
iii) from 0.70 to 0.80 in mass fraction of ethanol (∆A→BG° < 0, ∆A→BH° > 0, and ∆A→BS° > 0) the process is driven by entropy;
iv) from this ethanol proportion to neat ethanol (∆A→BG° > 0, ∆A→BH° > 0, and ∆A→BS° > 0), the solution process is again
en-thalpy driven.
Nevertheless, the molecular events involved in the solution pro-cesses remain unclear because the observed thermodynamic behavior differs to that observed for some other analgesic drugs in the same mixtures, where the predominant event in water-rich mixtures was the hydrophobic hydration around the non-polar groups of these other drugs.5 In contrast, for this drug, the main kind of interactions could
be related to hydrogen bonding between the drug and the solvent molecules because of the high number of polar groups (containing oxygen and nitrogen atoms) present in this drug (Figure 1).
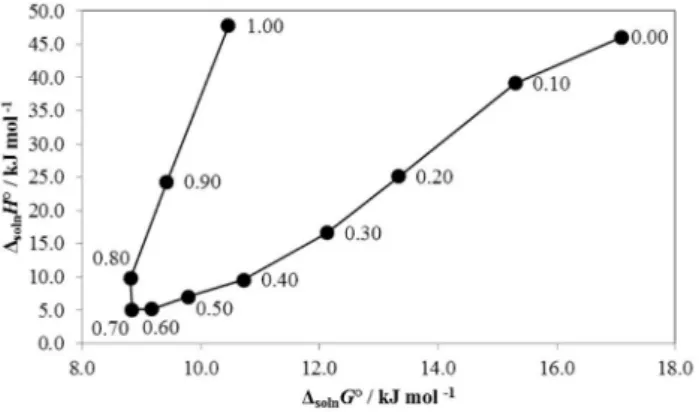
Enthalpy-entropy compensation of solution process of MTC
According to the literature, the construction of weighted graphs of
∆solnH° as a function of ∆solnG° at mean harmonic temperature allows
us to observe similar mechanisms for the solution process according to the tendencies obtained.20
In this context, Figure 5 shows fully that MTC in the ethanol + water cosolvent system exhibits non-linear ∆solnH° vs. ∆solnG° compensation
with a positive slope if an interval from neat water to 0.70 in mass fraction of ethanol is considered, whereas from this ethanol proportion to 0.80 in mass fraction of ethanol a negative slope is obtained. Finally, from this ethanol proportion to neat ethanol, a positive slope is again obtained. According to this graph, it follows that the driving function for MTC solubility is enthalpy in the first and third cases, while in the second case, the driving function is entropy. Nevertheless, the molecular events involved in the dissolution of this drug in this binary system are unclear because, as previously stated, no entropy driving is observed in water-rich mixtures. The compensation behavior obtained for MTC differs with respect to that reported for all the analgesic drugs studied previously, where entropy driving was observed in water-rich mixtures and enthalpy driving in ethanol-rich mixtures.5 On the other hand,
Figure 5 shows a similar trend to the one reported for triclocarban in ethanol + propylene glycol mixtures,17 as previously outlined for the
respective thermodynamic quantities of solution.
However, it is interesting to note that when ∆solnH° vs. T∆solnS°
Table 4. Apparent thermodynamic functions of transfer of methocarbamol from more polar solvents to less polar solvents in ethanol + water mixtures at 303.0 K
wEtOH
a
∆A→BG°/ kJ mol–1 ∆A→BH°/ kJ mol–1 ∆A→BS°/ J mol–1 K–1 T∆A→BS°/ kJ mol–1 ζH
b ζ
TS b
A B
0.00 0.60 -7.93 (0.21) -40.9 (1.8) -109 (4) -33.0 (1.2) 0.554 0.446 0.60 0.70 -0.33 (0.02) -0.08 (0.23) 0.8 (0.6) 0.25 (0.17) 0.240 0.760 0.70 0.80 -0.02 (0.05) 4.7 (0.3) 15.6 (0.4) 4.72 (0.11) 0.499 0.501 0.80 1.00 1.65 (0.06) 38.0 (0.8) 120.1 (1.5) 36.4 (0.4) 0.511 0.489
awEtOH is the mass fraction of ethanol in the solvent mixture free of methocarbamol; A and B are the more polar and less polar media, respectively. bζH and ζTS
are the relative contributions by enthalpy and entropy toward Gibbs energy of transfer. These values were calculated by means of Equations similar to 6 and 7, respectively.
Figure 6. ∆solnH° vs. T∆solnS° enthalpy-entropy compensation plot for solubility of methocarbamol in ethanol + water mixtures at 303.0 K
Figure 5. ∆solnH° vs. ∆solnG° enthalpy-entropy compensation plot for solubility
of methocarbamol in ethanol + water mixtures at 303.0 K
coordinates are evaluated, two linear trends with positive slopes are observed (Figure 6), i.e. for the region 0.00 ≤wEtOH≤ 0.60 the equation
∆solnH° = 1.218 (0.014) × T∆solnS° + 10.60 (0.22), with r
2 adjusted:
0.999 and typical error: 0.470 was obtained; whereas, for the region 0.60 ≤wEtOH≤ 1.00 the equation ∆solnH° = 1.037 (0.007) × T∆solnS°
+ 9.01 (0.12), with r2 adjusted: 1.000 and typical error: 0.238, was
obtained. According to the literature, this result again demonstrates that enthalpy driving is observed in almost all the cosolvent com-positions for this drug.5 This result is also different with respect to
those exhibited by some analgesic drugs in this cosolvent system, where two linear trends (one with slope greater than unity and the other with slope less than unity) were obtained.5
CONCLUSIONS
From all topics discussed previously, it can be concluded that the solution process of MTC in ethanol + water mixtures is variable depending on the solvent composition. Non-linear enthalpy-entropy compensation was found for this drug in this binary system. In this context, enthalpy driving was found for water-rich (0.00 < µEtOH <
0.70) and ethanol-rich mixtures (0.80 < µEtOH < 1.00), whereas entropy
driving was found only for a few composition mixtures (0.70 ≤ µEtOH ≤ 0.80). Nevertheless, the molecular events involved in the dissolution of this drug in this solvent system remain unclear. Ultimately, the data presented in this report expand the physicochemical information on drugs in alcoholic solutions. This information could be useful for pharmacists involved in dosage form design and development.
ACKNOWLEDGMENTS
We thank Department of Pharmacy of the Universidad Nacional
de Colombia for facilitating the equipment and laboratories used. We also thank the Laboratorio Procaps de Colombia for facilitating us the DSC equipment.
REFERENCES
1. Hanson, G. R. In Remington: The Science and Practice of Pharmacy; 20th ed.; Gennaro, A. R., ed.; Lippincott Williams & Wilkins: Philadelphia, 2000.
2. Rosenstein-Ster, E.; Diccionario de Especialidades Farmacéuticas, 32a ed.; Thompson P.L.M., S.A.: Bogotá, 2004.
3. Budavari, S.; O’Neil, M. J.; Smith, A.; Heckelman, P. E.; Obenchain Jr., J. R.; Gallipeau, J. A. R.; D’Arecea, M. A.; The Merck Index: An Encyclopedia of Chemicals, Drugs, and Biologicals, 13th ed.; Merck & Co., Inc.: Whitehouse Station, 2001.
4. Martin, A.; Bustamante, P.; Chun, A. H. C.; Physical Pharmacy: Physical Chemical Principles in the Pharmaceutical Sciences, 4th ed.; Lea & Febiger: Philadelphia, 1993; Florence, A. T.; Atwood, D.; Physicochemical Principles of Pharmacy, 3rd ed.; MacMillan Press Ltd.: London, 1998.
5. Jiménez, J. A.; Martínez, F.; Rev. Acad. Colomb. Cienc. 2006, 30, 87; Manrique, J.; Martínez, F.; Lat. Am. J. Pharm. 2007, 26, 344; Pacheco, D. P.; Martínez, F.; Phys. Chem. Liq. 2007, 45, 581; Gantiva, M.; Yurquina, A.; Martínez, F.; J. Chem. Eng. Data 2010, 55, 113; Delgado, D. R.; Holguín, A. R.; Almanza, O. A.; Martínez, F.; Marcus, Y.; Fluid Phase Equilibr. 2011, 305, 88; Martínez, F.; Peña, M. A.; Bustamante, P.; Fluid Phase Equilibr. 2011, 308, 98.
6. Aulton, M. E.; Pharmaceutics, The Science of Dosage Forms Design, 2nd ed.; Churchill Livingstone: London, 2002.
7. Rubino, J. T. In Encyclopedia of Pharmaceutical Technology; Swarbrick, J.; Boylan, J. C., eds.; Marcel Dekker, Inc.: New York, 1988, vol. 3, p. 375-398.
8. Yalkowsky, S. H.; Solubility and Solubilization in Aqueous Media, American Chemical Society and Oxford University Press: New York, 1999, p. 20-80.
9. US Pharmacopeia, 30th ed., The United States Pharmacopeial Convention: Rockville, MD, 2007.
10. McCauley, S. A.; Brittain, H. G. In Physical Characterization of Pharmaceutical Solids; Brittain, H. G. ed.; Marcel Dekker, Inc.: New York, 1995, p. 235-243.
11. Yalkowsky, S. H.; He, Y.; Handbook of Aqueous Solubility Data, CRC Press: Boca Raton, 2003; Jouyban, A.; Handbook of Solubility Data for Pharmaceuticals, CRC Press: Boca Raton, 2010.
12. Martin, A.; Bustamante, P.; Anal. Real Acad. Farm. 1989, 55, 175. 13. Barton, A.; Handbook of Solubility Parameters and Other Cohesion
Parameters, 2nd ed., CRC Press: New York, 1991, p. 157-193; Gantiva, M.; Martínez, F.; Quim. Nova 2010, 33, 370.
14. Hildebrand, J. H.; Prausnitz, J. M.; Scott, R. L.; Regular and Related Solutions, van Nostrand Reinhold: New York, 1970; Kristl, A.; Vesnaver, G.; J. Chem. Soc. Faraday Trans. 1995, 91, 995.
15. Krug, R. R.; Hunter, W. G.; Grieger, R. A.; J. Phys. Chem. 1976, 80, 2341. 16. Bevington, P. R.; Data Reduction and Error Analysis for the Physical
Sciences, McGraw-Hill Book Co.: New York, 1969, p. 56-91; Barrante, J. R.; Applied Mathematics for Physical Chemistry, 2nd ed.; Prentice Hall, Inc.: Upper Saddle River, 1998, p. 179-191.
17. Holguín, A. R.; Delgado, D. R.; Martínez, F.; Quim. Nova 2012, 35, 280. 18. Perlovich, G. L.; Kurkov, S. V.; Kinchin, A. N.; Bauer-Brandl, A.; Eur.
J. Pharm. Biopharm. 2004, 57, 411.
19. Holguín, A. R.; Delgado, D. R.; Martínez, F.; Marcus, Y.; J. Solution Chem. 2011, 40, 1987.