Artigo
*e-mail: [email protected]
THERMODYNAMIC STUDY OF THE SOLUBILITY OF TRICLOCARBAN IN ETHANOL + PROPYLENE GLYCOL MIXTURES
Andres R. Holguín, Daniel R. Delgado e Fleming Martínez*
Departamento de Farmacia, Facultad de Ciencias, Universidad Nacional de Colombia, A.A. 14490, Bogotá D.C., Colombia
Recebido em 19/1/11; aceito em 1/8/11; publicado na web em 26/9/11
By using the van’t Hoff and Gibbs equations the apparent thermodynamic functions Gibbs energy, enthalpy, and entropy of solution for triclocarban in ethanol + propylene glycol mixtures were evaluated from solubility data determined at temperatures from (293.15 to 313.15) K. The drug solubility was greatest in the mixture with 0.60 in mass fraction of ethanol and lowest in neat propylene glycol at almost all the temperatures studied. Non-linear enthalpy-entropy compensation is found indicating apparently different mechanisms of the solution process according to the mixtures composition.
Keywords: cosolvency; solubility; triclocarban.
INTRODUCTION
Triclocarban (TCC, 3,4,4’-trichlorocarbanilide, Figure 1) is a synthetic antibacterial agent used as antiseptic in cosmetic and health-consumer products that presents low acute and chronic toxicity.1 The extremely low solubility of TCC in water (approx.
50 ng cm–3) constrains the development of water-based antibacterial
TCC-containing formulations.2 Different technological
approa-ches are being investigated in order to enhance the solubility of poorly-water soluble drugs.3 As an example, the improved aqueous
solubility of TCC by means of encapsulation into two branched poly(ethylene oxide)-poly(propylene oxide) (PEO-PPO) block copolymers has been reported.4
Despite the impact the dissolution process in both organic and aqueous media have on the interaction of this drug with the biological environment and also in the context of the solubilization in polymeric nanocarriers, these fundamental aspects were not thoroughly investi-gated yet.5 In this context, the thermodynamic aspects of dissolution
processes in some organic solvents used in QSAR studies have been reported.5
As a basic stage towards a deeper understanding of the mole-cular forces involved, the present work studied the thermodynamic of solubility of TCC in solvent mixtures of ethanol and propylene glycol as has been made with analgesic drugs such as acetaminophen, ibuprofen and naproxen.6 It is well known that ethanol and propylene
glycol are the cosolvents most widely used in drug formulation design, especially those intended for peroral and parenteral administration and several examples of pharmaceutical formulations using these cosolvents have been presented by Rubino.7 It is remarkable that
both cosolvents have antimicrobial properties.8
As has been already described, the solubility behavior of drugs in cosolvent mixtures is very important because cosolvent blends
are frequently used in purification methods, preformulation studies, and pharmaceutical dosage forms design, among other applications.9
For these reasons, it is important to determine systematically the solubility of pharmaceutical compounds. Besides, as was already said temperature-solubility dependence allows us to carry out the respective thermodynamic analysis, which, on the other hand, also permits insight the molecular mechanisms, involved toward the solution processes.9
The goal of the present work was to present a more complete and systematic information about the properties of dissolution in alcoholic media and transfer between solvents of different polarity for this drug. The equilibrium solubility was determined at several temperatures in the binary mixtures and the respective dissolution thermodynamic analysis was made by using the van’t Hoff and Gibbs equations. Otherwise, by using the values reported for the TCC fusion process the contribution due to the mixing-process toward the overall dissolution was also analyzed.4
EXPERIMENTAL
Materials
Triclocarban A.R. Sigma; absolute ethanol A. R. (Merck); propy-lene glycol conformed to the quality requirements of the American Pharmacopeia, USP;10 molecular sieve (Merck, numbers 3 and 4);
Millipore Corp. Swinnex®-13 filter units.
Solvent mixtures preparation
All ethanol + propylene glycol solvent mixtures were prepared by mass, using an Ohaus Pioneer TM PA214 analytical balance with sensitivity ± 0.1 mg, in quantities of 50 g. The mass fractions of ethanol of the nine binary mixtures prepared varied by 0.10 from 0.10 to 0.90.
Solubility determinations
RTE 10 Digital One Thermo Electron Company) kept at 293.15 or 298.15 (± 0.05) K with sporadic manual stirring at least for 7 days to reach the saturation equilibrium. After this time the supernatant solutions were filtered (at isothermal conditions) to ensure that they were free of particulate matter before sampling. TCC concentrations were determined after appropriate alcoholic dilution by measuring the light absorbance and interpolation from a previously constructed UV spectrophotometry calibration curve (UV/VIS BioMate 3 Ther-mo Electron Company spectrophotometer). Equilibrium time was established by measuring the TCC concentrations till they became constant. All the solubility experiments were run in triplicate at least. In order to make the equivalence between molarity and mole fraction concentration scales, the density of the saturated solutions was determined with a digital density meter (DMA 45 Anton Paar) connected to the same recirculating thermostatic baths.
RESULTS AND DISCUSSION
It is important to remark that this drug acts in solution mainly as a Lewis acid (>N–H groups) in order to establish hydrogen bonds with proton-acceptor functional groups present in the solvents (oxygen in -OH groups), although it also could act as Lewis base because of its carbonyl moiety.5,11
Ideal and experimental solubility of TCC
Table 1 shows the experimental solubilities of TCC expressed in mole fractions, x3, as well as the ideal solubilities already reported.5 It
is important to keep in mind that drug ideal solubility is just dependent on solid-solute properties without considering the solvent properties. Thus, ideal solubility depends both on temperature and enthalpy of fusion.11 In almost all cases the coefficients of variation of the
solubility were smaller than 2.0 %. On similar way, Figure 2 shows TCC solubility expressed in molarity at all temperatures studied. The solubility trends are described by normal polynomials in order 3.
It may be observed that the highest solubility value in mole fraction for this drug was obtained in the mixture of 0.60 in mass fraction of ethanol at 313.15 K, while the lowest value was found in neat ethanol at 293.15 K. By comparing the solubility in neat solvents the greater solubility at almost all temperatures is found in neat ethanol except at 293.15 K. On the other hand, in the literature
there are not reported solubility values for this drug in these solvents, and therefore, no direct comparison is possible.
TCC activity coefficients
The solute activity coefficient in the solution (γ2) is calculated as X2id/X2 and it is an indication of the deviation presented by TCC
from its ideal behavior.9 Table 2 shows TCC activity coefficients as
a function of temperature. Accordingly, γ2 values are close to 2.0 and
increase as temperature increases indicating less ideal behavior at high temperatures. On the other hand, the lower γ2 values are obtained in
the same mixture of maximum solubility (µEtOH = 0.60).
From the different magnitudes obtained for the γ2 values presented
in Table 2 an approximate estimation of solute-solvent intermolecular interactions can be made by considering the following expression:
(1)
where w11,w22y w12 represent the solvent-solvent, solute-solute and solvent-solute interaction energies, respectively; V2 is the molar
vo-lume of the supercooled liquid solute, and finally, φ1 is the volume fraction of the solvent. In a first approach the term (V2f12/RT)T,P may
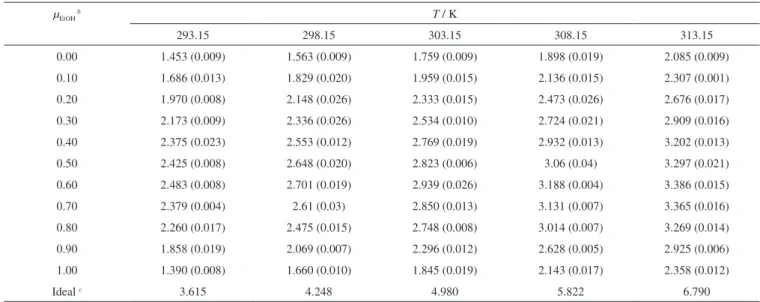
Table 1. Experimental solubility of triclocarban in ethanol + propylene glycol mixtures expressed as 1000 × mole fraction at several temperaturesa
µEtOH b T / K
293.15 298.15 303.15 308.15 313.15
0.00 1.453 (0.009) 1.563 (0.009) 1.759 (0.009) 1.898 (0.019) 2.085 (0.009) 0.10 1.686 (0.013) 1.829 (0.020) 1.959 (0.015) 2.136 (0.015) 2.307 (0.001) 0.20 1.970 (0.008) 2.148 (0.026) 2.333 (0.015) 2.473 (0.026) 2.676 (0.017) 0.30 2.173 (0.009) 2.336 (0.026) 2.534 (0.010) 2.724 (0.021) 2.909 (0.016) 0.40 2.375 (0.023) 2.553 (0.012) 2.769 (0.019) 2.932 (0.013) 3.202 (0.013) 0.50 2.425 (0.008) 2.648 (0.020) 2.823 (0.006) 3.06 (0.04) 3.297 (0.021) 0.60 2.483 (0.008) 2.701 (0.019) 2.939 (0.026) 3.188 (0.004) 3.386 (0.015) 0.70 2.379 (0.004) 2.61 (0.03) 2.850 (0.013) 3.131 (0.007) 3.365 (0.016) 0.80 2.260 (0.017) 2.475 (0.015) 2.748 (0.008) 3.014 (0.007) 3.269 (0.014) 0.90 1.858 (0.019) 2.069 (0.007) 2.296 (0.012) 2.628 (0.005) 2.925 (0.006) 1.00 1.390 (0.008) 1.660 (0.010) 1.845 (0.019) 2.143 (0.017) 2.358 (0.012)
Ideal c 3.615 4.248 4.980 5.822 6.790
a Values in parentheses are standard deviations. bµ
EtOH is the mass fraction of ethanol in the cosolvent mixture free of drug. c From ref. 5
Figure 2. Experimental solubility of triclocarban in ethanol + propylene glycol mixtures expressed in mol dm–3 at several temperatures. (): 293.15
be considered approximately constant at the same temperature, and then γ2 depends almost exclusively on w11, w22and w12.12 While the
term w12 term favors the solution process, both w11 and w22 terms
are unfavorable for solubility. This happens because energy must be supplied first, against the cohesive forces of the solute in solid state to separate them, and second, against the cohesive forces of the solvent to create the respective cavity (for solute accommoda-tion). These processes decrease drug solubility. On the other hand, solute-solvent interaction is exothermic and results mainly from van der Waals and Lewis acid-base interactions, which increases the drug solubility. The contribution of w22 is proportional to the
work necessary to transfer drug molecules from the solid to the vapor state and, therefore, it could be considered as constant in all mixtures and pure solvents.
The γ2 values vary from 1.46 to 3.26 indicating quasi-ideal
solubi-lity behavior of this drug in this binary solvent system. It is important to note that this drug has high temperature and enthalpy of fusion and therefore the term w22 would be great.5 On similar way, ethanol and
propylene glycol are hydrogen-bonded solvents implying the w11 term
is relatively great in all mixtures.11 Therefore, the term w
12 would be
significant to obtain the low γ2 values presented in Table 2. That is,
the solute-solvent interactions are very important for dissolution of this drug in these solvent mixtures.
Apparent thermodynamic functions of solution
According to van’t Hoff analysis, the apparent standard enthalpy change of solution (∆solnH°) for non electrolyte drugs is obtained by using the mean harmonic temperature (Thm is 303 K in the present
case) according to Equation 2.9
(2)
where, R is the universal gas constant (8.314 J mol–1 K–1). As an example, Figure 3 shows the modified van’t Hoff plot for TCC in mixtures containing 0.40, 0.60, and 0.80 in mass fraction of ethanol. In all cases linear models were obtained with good determination coefficients (r2) were obtained.
The apparent standard Gibbs energy change for the solution process (∆solnG°) of non electrolyte drugs considering the approach
proposed by Krug et al.,13 is calculated at mean harmonic temperature
by means of,
(3) in which, the intercept used is the one obtained in the analysis by treatment of ln x2 as a function of 1/T – 1/Thm. This intercept corres-ponds to the value of ln X2 obtained from the respective regression
model at 303 K, and thus, Equation 3 is almost coincident with the classical equation ∆solnG° = –RT × ln X2 at mean harmonic
tempe-rature.11 Finally, the apparent standard entropic change for solution
process (∆solnS°) is obtained from the respective ∆solnH° and ∆solnG°
values by using:
(4)
Table 3 summarizes the apparent standard thermodynamic functions for experimental solution process of TCC in all ethanol + propylene glycol solvent mixtures. In order to calculate the ther-modynamic quantities for the experimental solution processes some propagation of uncertainties’ methods were used. In particular, the uncertainty in enthalpy was calculated from the respective uncer-tainty in the van’t Hoff plot slope multiplied by R, the uncertainty in Gibbs energy was calculated as the mean of the variation coefficients obtained in solubility values obtained at all temperatures, and finally, the uncertainty in entropy was obtained as the root square of the sum of squares of uncertainties obtained for enthalpy and Gibbs energy.14 It is found that the standard Gibbs energy of solution is
positive in all cases as expected because the mole fraction is always lower than the unit and thus, its logarithmic term is negative, and therefore, standard Gibbs energy will be a positive quantity. ∆solnG°
values diminish from neat propylene glycol to the mixture of 0.60 in mass fraction of ethanol.
The apparent enthalpy of solution is positive in all cases, therefore the process is always endothermic. In opposite way, the entropy of solution is negative indicating that nor enthalpic or entropic driving on the overall solution process is obtained, except for the mixture with 0.90 in mass fraction of ethanol and in neat ethanol where po-sitive entropies were obtained. In these cases the solution process is entropy-driven. In different way to Gibbs energy of solution, ∆solnH° and ∆solnS° values decrease from neat propylene glycol to the mixture
of 0.30 in mass fraction of ethanol and increase beyond this mixture composition.
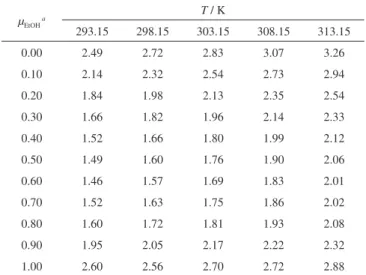
Table 2. Activity coefficients of triclocarban in ethanol + propylene glycol mixtures at several temperatures
µEtOH a
T / K
293.15 298.15 303.15 308.15 313.15
0.00 2.49 2.72 2.83 3.07 3.26
0.10 2.14 2.32 2.54 2.73 2.94
0.20 1.84 1.98 2.13 2.35 2.54
0.30 1.66 1.82 1.96 2.14 2.33
0.40 1.52 1.66 1.80 1.99 2.12
0.50 1.49 1.60 1.76 1.90 2.06
0.60 1.46 1.57 1.69 1.83 2.01
0.70 1.52 1.63 1.75 1.86 2.02
0.80 1.60 1.72 1.81 1.93 2.08
0.90 1.95 2.05 2.17 2.22 2.32
1.00 2.60 2.56 2.70 2.72 2.88
aµ
EtOH is the mass fraction of ethanol in the cosolvent mixture free of drug.
With the aim to compare the relative contributions by enthalpy (ζH) and by entropy (ζTS) toward the solution process, Equations 5
and 6 were employed, respectively.15
(5)
(6)
From Table 3 it follows that enthalpy is the main contributor to standard Gibbs energy of solution process of TCC in all the systems studied and thus the energetic factor predominates.
Apparent thermodynamic functions of mixing of TCC
The solution process may be represented by the following hy-pothetic stages,9
Solute(Solid)→ Solute(Liquid) at Tfus→ Solute(Liquid) at Thm → Solute(Solution) where the solution stages are solute fusion, cooling the liquid solute to the mean harmonic temperature Thm (303 K),and
subse-quent mixing of the hypothetical super-cooled liquid solute with the
solvent at this temperature. This allows also the calculation of the partial thermodynamic contributions to the overall solution process by means of Equations 7 and 8, respectively.
∆solnH° = ∆fusH303 + ∆mixH° (7)
∆solnS° = ∆fusS303 + ∆mixS° (8)
where ∆fusH303 and ∆fusS303 represent the thermodynamic functions
of fusion of TCC and its cooling to the mean temperature, 303 K. However, the ∆solnH°id and ∆solnS°id values for the ideal solution
proces-ses were used instead of ∆fusH303 and ∆
fusS303 for reasons described in
the literature.16 Briefly, ∆
fusH303 is calculated as ∆fusHMP – ∆Cp(Tfus – T)
by using ∆fusSMP instead of ∆C
p obtaining a value of 24.05 kJ mol–1,
which is coincident with the enthalpic change for an ideal solution of this drug (Table 3); in contrast, the entropy of fusion at 303 K (79.4 J mol–1 K–1) is not coincident with the entropy of ideal solution
at this temperature (35.29 J mol–1 K–1).5 This replacement was used
also with some analgesic drugs studied at similar conditions in this solvent system.6 Table 4 summarizes the thermodynamic functions
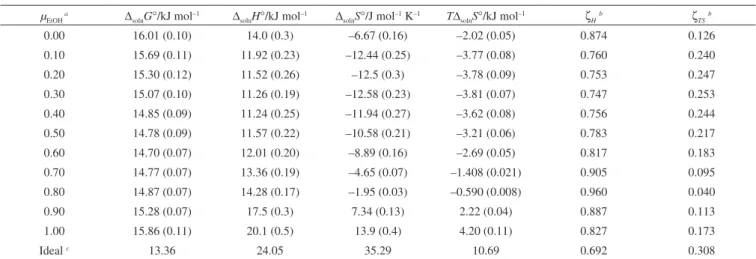
of mixing of supercooled liquid TCC with the solvent mixtures. ∆mixG° values are positive indicating apparently non spontaneity of the liquids mixing process. This result is in agreement with the fact that experimental solubility in all case was lower than the ideal one. Table 3. Apparent thermodynamic functions relative to solution process of triclocarban in ethanol + propylene glycol mixtures at 303 K
µEtOH a ∆solnG°/kJ mol–1 ∆solnH°/kJ mol–1 ∆solnS°/J mol–1 K–1 T∆solnS°/kJ mol–1 ζH
b ζ
TS b
0.00 16.01 (0.10) 14.0 (0.3) –6.67 (0.16) –2.02 (0.05) 0.874 0.126 0.10 15.69 (0.11) 11.92 (0.23) –12.44 (0.25) –3.77 (0.08) 0.760 0.240 0.20 15.30 (0.12) 11.52 (0.26) –12.5 (0.3) –3.78 (0.09) 0.753 0.247 0.30 15.07 (0.10) 11.26 (0.19) –12.58 (0.23) –3.81 (0.07) 0.747 0.253 0.40 14.85 (0.09) 11.24 (0.25) –11.94 (0.27) –3.62 (0.08) 0.756 0.244 0.50 14.78 (0.09) 11.57 (0.22) –10.58 (0.21) –3.21 (0.06) 0.783 0.217 0.60 14.70 (0.07) 12.01 (0.20) –8.89 (0.16) –2.69 (0.05) 0.817 0.183 0.70 14.77 (0.07) 13.36 (0.19) –4.65 (0.07) –1.408 (0.021) 0.905 0.095 0.80 14.87 (0.07) 14.28 (0.17) –1.95 (0.03) –0.590 (0.008) 0.960 0.040 0.90 15.28 (0.07) 17.5 (0.3) 7.34 (0.13) 2.22 (0.04) 0.887 0.113
1.00 15.86 (0.11) 20.1 (0.5) 13.9 (0.4) 4.20 (0.11) 0.827 0.173
Ideal c 13.36 24.05 35.29 10.69 0.692 0.308
aµ
EtOH is the mass fraction of ethanol in the solvent mixture free of drug. bζH and ζTS are the relative contributions by enthalpy and entropy toward Gibbs energy
of solution. These values were calculated by means of Equations 5 and 6, respectively. c From ref. 5
Table 4. Apparent thermodynamic functions relative to mixing process of triclocarban in ethanol + propylene glycol mixtures at 303 K µEtOH a ∆mixG°/kJ mol–1 ∆mixH°/kJ mol–1 ∆mixS°/J mol–1 K–1 T∆mixS°/kJ mol–1 ζH
b ζ
TS b
0.00 2.65 –10.1 –41.96 –12.71 0.442 0.558
0.10 2.33 –12.13 –47.73 –14.46 0.456 0.544
0.20 1.94 –12.53 –47.8 –14.47 0.464 0.536
0.30 1.71 –12.79 –47.87 –14.50 0.469 0.531
0.40 1.49 –12.81 –47.23 –14.31 0.472 0.528
0.50 1.42 –12.48 –45.87 –13.90 0.473 0.527
0.60 1.34 –12.04 –44.18 –13.38 0.474 0.526
0.70 1.41 –10.69 –39.94 –12.10 0.469 0.531
0.80 1.51 –9.77 –37.24 –11.28 0.464 0.536
0.90 1.92 –6.5 –27.95 –8.47 0.436 0.564
1.00 2.50 –4.0 –21.4 –6.49 0.381 0.619
aµ
EtOH is the mass fraction of ethanol in the solvent mixture free of drug. bζH and ζTS are the relative contributions by enthalpy and entropy toward Gibbs energy
The ideal dissolution contributions (related to solute fusion process) to the enthalpy and entropy of dissolution of TCC, ∆solnH°id
and ∆solnS°id, are positive (Table 3). In opposite way to ideal process,
both thermodynamic quantities of mixing are negative indicating just enthalpic driving in this hypothetical subprocess because of its exothermic nature.
Apparent thermodynamic functions of transfer of TCC
In order to verify the effect of cosolvent composition on the ther-modynamic function driving the solution process, Table 5 summarizes the thermodynamic functions of transfer of TCC from the more polar solvents to the less polar ones. These new functions were calculated as the differences between the thermodynamic quantities of solution in the more polar mixtures and the less polar mixtures.
If the addition of ethanol to neat propylene glycol is considered (being the solvent mixture less polar as the ethanol proportion incre-ases), as has been done earlier,6 it happens the following, from neat
propylene glycol to 0.30 in mass fraction of ethanol (∆A→BG° < 0,
∆A→BH° < 0, and ∆A→BS° < 0) the solubility process is driven by the enthalpy; whereas, from this composition up to 0.60 in mass fraction of ethanol (∆A→BG° < 0, ∆A→BH° > 0, and ∆A→BS° > 0) the dissolution process is entropy driven. Ultimately, from this ethanol proportion to neat ethanol (∆A→BG° > 0, ∆A→BH° > 0, and ∆A→BS° > 0), the solution process is enthalpy driven, again. Nevertheless, the molecular events involved on solution processes are unclear because of the lack of structural effects in this binary alcoholic system.
Enthalpy-entropy compensation of solution process of TCC
According to the literature, the making of weighted graphs of ∆solnH° as a function of ∆solnG° at mean harmonic temperature allows us to observe similar mechanisms for the solution process according to the tendencies obtained.17
In this context, Figure 4 shows fully that TCC in the ethanol + propylene glycol solvent system exhibits non-linear ∆solnH° vs. ∆solnG° compensation with positive slope if an interval from neat propylene glycol to 0.30 in mass fraction of ethanol is considered, whereas from this ethanol proportion to 0.60 in mass fraction of ethanol positive slope is obtained, and finally, from this ethanol proportion to neat ethanol positive slope is obtained again. Accordingly to this graph it follows that the driving function for TCC solubility is the enthalpy in the first and third cases, while in the second case, the driving function is the entropy. Nevertheless, the molecular events involved in the dis-solution of this drug in this binary system are unclear as was already said but it is conjecturable that the enthalpy driving could be due to the energy requirement to separate the molecules of each individual solvent to accommodate the drug molecules. The compensation behavior obtained for TCC is similar to that reported for acetamino-phen but different with those reported for ibuprofen and naproxen where almost linear compensations were obtained.6 On the other
hand, Khalief explained the almost linear compensation of ibuprofen solubility in this solvent mixture in terms of the same mechanism for dissolution process independent of the mixture composition because no structural change is observed in the solvent mixture.18
CONCLUSIONS
From all topics discussed previously it can be concluded that the solution process of TCC in ethanol + propylene glycol mixtures is variable depending on the solvent composition. Non linear enthalpy-entropy compensation was found for this drug in this binary system. In this context, enthalpy-driving was found for ethanol-rich (0.60 < µEtOH < 1.00) and propylene glycol-rich mixtures
(0.00 < µEtOH < 0.30), whereas, for the intermediate composition mix-tures (0.30 ≤µEtOH≤ 0.60) entropy-driving was found, nevertheless,
the molecular events involved in the dissolution of this drug in this solvent system are unclear. Ultimately, it can be stated that the data presented in this report expand the physicochemical information about drugs in alcoholic solutions.
ACKNOWLEDGMENTS
We thank the DIB of the Universidad Nacional de Colombia (UNC) for the financial support. Additionally we thank the De-partment of Pharmacy of UNC for facilitating the equipment and laboratories used.
REFERENCES
1. Budavari, S.; O’Neil, M. J.; Smith, A.; Heckelman, P. E.; Obenchain Jr., J. R.; Gallipeau, J. A. R.; D’Arecea, M. A.; The Merck Index: An Ency-clopedia of Chemicals, Drugs, and Biologicals; 13th ed. Merck & Co.,
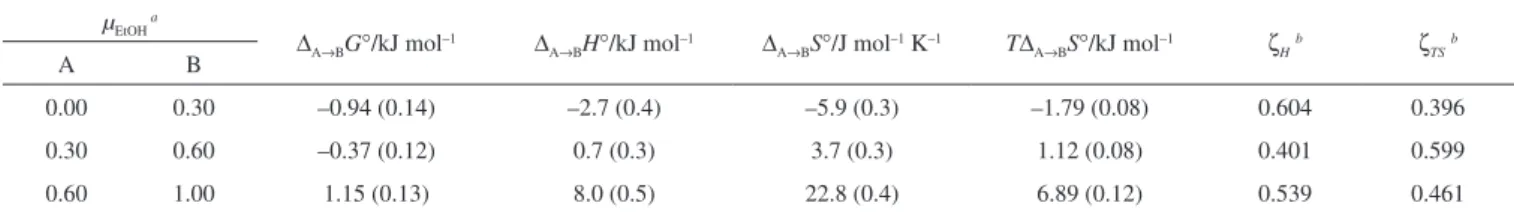
Inc.: Whitehouse Station, New Jersey, 2001; Breneman, D. L.; Hanifin, Table 5. Apparent thermodynamic functions of transfer of triclocarban naproxen from more polar solvents to less polar solvents in ethanol + propylene glycol mixtures at 303 K
µEtOH a
∆A→BG°/kJ mol–1 ∆A→BH°/kJ mol–1 ∆A→BS°/J mol–1 K–1 T∆A→BS°/kJ mol–1 ζH
b ζ
TS b
A B
0.00 0.30 –0.94 (0.14) –2.7 (0.4) –5.9 (0.3) –1.79 (0.08) 0.604 0.396
0.30 0.60 –0.37 (0.12) 0.7 (0.3) 3.7 (0.3) 1.12 (0.08) 0.401 0.599
0.60 1.00 1.15 (0.13) 8.0 (0.5) 22.8 (0.4) 6.89 (0.12) 0.539 0.461
aµ
EtOH is the mass fraction of ethanol in the solvent mixture free of drug; A and B are the more polar and less polar media, respectively. bζH and ζTS are the
relative contributions by enthalpy and entropy toward Gibbs energy of transfer. These values were calculated by means of equations analogous to 5 and 6.
Figure 4.∆solnH° vs. ∆solnG° enthalpy-entropy compensation plot for solubility
J. M.; Berge, C. A.; Kewick, B. H.; Neumann, P. B.; Cutis2000, 66, 296; Luby, S.; Agboatwalla, M.; Feikin, D.; Painter, J.; Billhimer, W.; Altaf, A.; Hoekstra R.; Lancet2005, 366, 225.
2. Duan, M. S.; Zhao, N.; Össurardóttir, Í. B.; Thorsteinsson, T.; Loftsson, T.; Int. J. Pharm.2005, 297, 213.
3. Sosnik, A.; Carcaboso, A. M.; Chiappetta, D. A.; Recent Pat. Biomed. Eng.2008, 1, 43.
4. Chiappetta, D. A.; Degrossi, J.; Lizarazo, R. A.; Salinas, D. L.; Martínez, F.; Sosnik, A. In Polymer Aging, Stabilizers and Amphiphilic Block Co-polymers;Segewicz, L.; Petrowsky, M., eds., Nova Science Publishers, Inc.: New York, 2010.
5. Aragón, D. M.; Sosnik, A.; Martínez, F.; J. Solution Chem.2009, 38, 1493.
6. Jiménez, J. A.; Martínez, F.; J. Solution Chem.2006, 35, 335; Pacheco, D. P.; Manrique, Y. J.; Martínez, F.; Fluid Phase Equilibr.2007, 262, 23. 7. Rubino, J. T. In Encyclopedia of Pharmaceutical Technology; Swarbrick,
J.; Boylan, J. C., eds.; Marcel Dekker, Inc.: New York, 1988, vol. 3, p. 375-398.
8. Aulton, M. E.; Pharmaceutics, The Science of Dosage Forms Design, 2nd ed., Churchill Livingstone: London, 2002.
9. Pacheco, D. P.; Martínez, F.; Phys. Chem. Liq.2007, 45, 581.
10. US Pharmacopeia, 23rd ed., The United States Pharmacopeial
Convention: Rockville, 1994.
11. Martin, A.; Bustamante, P.; Chun, A. H. C.; Physical Pharmacy: Physical Chemical Principles in the Pharmaceutical Sciences, 4th
ed.; Lea & Febiger: Philadelphia, 1993; Florence, A. T.; Atwood, D.; Physicochemical Principles of Pharmacy, 3rd ed.; MacMillan Press Ltd.:
London, 1998, p. 64-67.
12. Kristl, A.; Vesnaver, G.; J. Chem. Soc. Faraday Trans.1995, 91, 995. 13. Krug, R. R.; Hunter, W. G.; Grieger, R. A.; J. Phys. Chem. 1976, 80,
2341.
14. Bevington, P. R.; Data Reduction and Error Analysis for the Physical Sciences, McGraw-Hill Book Co.: New York, 1969, p. 56-91; Barrante, J. R.; Applied Mathematics for Physical Chemistry; 2nd ed.; Prentice
Hall, Inc.: Upper Saddle River, 1998, p. 179-191.
15. Perlovich, G. L.; Kurkov, S. V.; Kinchin, A. N.; Bauer-Brandl, A.; Eur. J. Pharm. Biopharm. 2004, 57, 411.
16. Ruidiaz, M. A.; Delgado, D. R.; Martínez, F.; Marcus, Y.; Fluid Phase Equilibr.2010, 299, 259.
17. Bustamante, P.; Romero, S.; Reillo, A.; Pharm. Sci. 1995, 1, 505 ; Tomlinson, E.; Int. J. Pharm. 1983, 13, 115.