Spectrophotometric Determination of Pd(Ii) With
P-Dimethylaminebenzylidenerhodanine
Lucia Felicidade Dias
1and Jorge Nozaki
*(1) Mestrado em Quimica Aplicada/UEM.. (*) Departamento de Quimica, Universidade Estadual de Maringa 87.020-900 Maringa, PR., Brazil.
ABSTRACT
p-Dimethylaminebenzylidenerhodanine in methyl isobutyl ketone was employed as selective and sensitive reagent for the extraction and determination of palladium(II) in metal alloys and rocks. Beer’s Law is followed in the concentration range 0.2–2.4 µg.mL-1 of organic phase with a molar absorptivity of 3.0x10⁴L.mol-1.cm-1. The detection limit observed
for aqueous solution was 0.1 µg.L-1. The extractions were performed at pH 2.4 and no interference of foreign ions such as Cu2+, Zn2+, Fe3+, Pb2+, Hg2+ ,etc., were observed in jewellery alloy and rock sample analyzed. The complex of
reagent and palladium(II) was pH dependent and it should be carefully controlled during extraction. Continuous variation and mole ratio methods showed that the complex composition was 1:1.
Key words: p-dimethylaminebenzylidenerhodanine; palladium(II); extraction-spectrophotometry; rocks; metal alloy
*
Author for correspondence
INTRODUCTION
The compound 5-(4-dimethylamine benzylidene) rhodanine (DMABR) and its derivatives are reagents that form very strong and stable complexes with platinum group elements (Pd2+, Au3+, Ag+, Ir3+ e Rh3+ ) in weak acidic media (Sandell, 1948), (Natelson and Zuckerman,1951), (Sandell and Numayer, 1951), (Narang and Ayres, 1961), (Doycheva et al.,1971), (Borissova et al., 1975), (Borissova,1975), (Pangarova, 1977), (El-Zawawy et al.,1995), (Borissova et al., 1975). The spectrophotometric method for the determination of Pd2+ with DMABR was first proposed to be performed in acidic media such as formic , hydrochloric , acetic and propionic acids (Narang and Ayres, 1961). It was observed that Au3+, Ir3+ and Cr(VI) were serious interfering ions, (especially gold). On the other hand, the interfering action of silver was easily masked by hydrochloric acid, removing the silver chloride formed.
Hydrochloric acid medium, pH 1.0, was used to the determination of Pd2+, without the interference of silver by Borissova et al.(1975). The determination of Pd2+ with DMABR was
performed using the toxic nitrobenzene as solvent (Doycheva et al.,1971). It was also observed that Au3+ was a serious inteferent even in trace amounts, while ions such Fe3+, Bi3+, Pt4+, Hg2+ , Cu2+, Pb2+ , Cd2+, CN-, etc., showed interfering actions only at larger concentrations.
In this paper, we report the results on selective extration of Pd2+ from aqueous solution, pH 2.4 , with DMABR in methyl isobutyl ketone (MIBK). The spectrophotometric determination of Pd2+ was performed directly in organic phase. The separation of Pd2+ and Au3+ was also investigated to be employed for samples with higher gold concentration.
MATERIALS AND METHODS
Reagents
The solution of DMABR (Aldrich-USA) 1,0x10⁻⁴ mol.L-1 was prepared in MIBK. The solution of Pd2+ (73,40 µg.mL-1) was prepared from PdCl2
(Aldrich-USA) and standardized by the Th(NO3)4
masking reagent of Fe3+, ethanolic solution of 0,25 mol.L-1 dimethylglyoxime was used for Pd2+ and Au3+ separation, and a mixture of EDTA 0,100 mol.L-1 with 1,2 mol.L-1 sodium citrate as masking agent to the other ions such as Fe3+, Cu2+, Ca2+, Mg2+, Zn2+, Ni2+, etc.
Preparation of standard Pd2+ solution
Titration of a 50 mg.L-1 of Th4+ as Th(NO3)4
solution, adjusted to pH 1.0-2.0 with HNO3, was
performed with 0.100 M EDTA to a xylenol orange end point, according to the reaction:
1.0mL of 0.100 M EDTA solution = 23.204 mg of Th4+.
In the following step, 10.0 mL of 0.100 M EDTA(excess) were added to an acidic solution of ~50 mg of Pd, pH ~3.0, using xylenol orange as indicator. The back titration was performed with 0.100 M Th(NO3)4 , and the concentration was
calculated using the following relationship:
1.0 mL of 0.100 M EDTA = 10.64 mg of Pd2+
Sample preparation
The pegmatite rock was collected from Campo Largo County, Parana State, Brazil. A rock sample with mineral veins and an average of 6.0 (Mohs’scale of hardness), irregular masses and grains of many sizes, specific gravity of ~ 2.7, where the presence of other minerals such as fluorite, feldspar, and chalcopyrite gave a grey-brown colour. The sample containing Si, Pd, Au, Fe, As, S, etc., was crushed to 100 mesh, heated at 8000C for 3 h, and dissolved with aqua-regia. After filtration and separation of undissolved SiO2, the
pH was adjusted to 2.4. The liquid-liquid extraction were performed five times with 2.0 mL of 1.0 x10⁻⁴ mol.L-1 solution of DMABR in MIBK.
Extraction and Pd2+ determination
The optimum conditions for the extractions of the complex Pd2+:DMABR, such as pH of aqueous solution, reagent concentration, presence of interfering ions, etc., were investigated using a 125 mL separatory funnel. The Pd2+ from aqueous solution was extracted with 2.5 mL of DMABR and the organic phase was transferred to a 10.0 mL volumetric flask. The extractions were performed four more times using the same volume of
DMABR. The spectrophotometer Beckman-DU-70 was used for absorbance reading with 10 mm cell at 502 nm. The stability of Pd2+-DMABR complex was investigated reading the absorbance in time intervals of 5 minutes during 90 minutes. The calibration curve was prepared changing the concentrations of Pd2+ in aqueous solution, using the same procedure for extraction and spectrophotometric determination.
Complex stoichiometry
The molar ratio and continuous variation methods (Skoog and Leary,1992) were employed for the determination of Pd2+:DMABR stoichiometry in MIBK. Volumetric flasks of 10.0 mL were used adjusting the pH to 2.4 , and reading the absorbance at 502 nm up to 60 minutes.
Interfering ions
The extraction efficiency of Pd2+ was investigated in the presence of several ions in aqueous solution, pH 2.4. To the standard solutions of Pd2+ (0.12
µg.mL-1), several ions with known concentrations were added to investigate its interfering action on Pd2+-DMABR complex.
Separation of Pd2+ and Au3+
The separation of Pd2+ and Au3+ was investigated to be applied in samples with higher gold concentrations . To a 200 mL solution containing Au3+ , Pd2+ , Ni2+ , and Fe3+ , 0.5 mL of NaF, 1.5 mL of the mixture of EDTA-sodium citrate were added and the pH was adjusted to 5.5 with solutions of 0.1 M Na2CO3 and HCl . The solution
RESULTS AND DISCUSSION
Figure 1 shows the extraction efficiency of Pd2+ with DMABR as function of pH of aqueous phase. The concentrations used were: DMABR 1,0x10⁻⁴ mol.L-1 and Pd2+ 0,12 µg.mL-1 in aqueous phase.
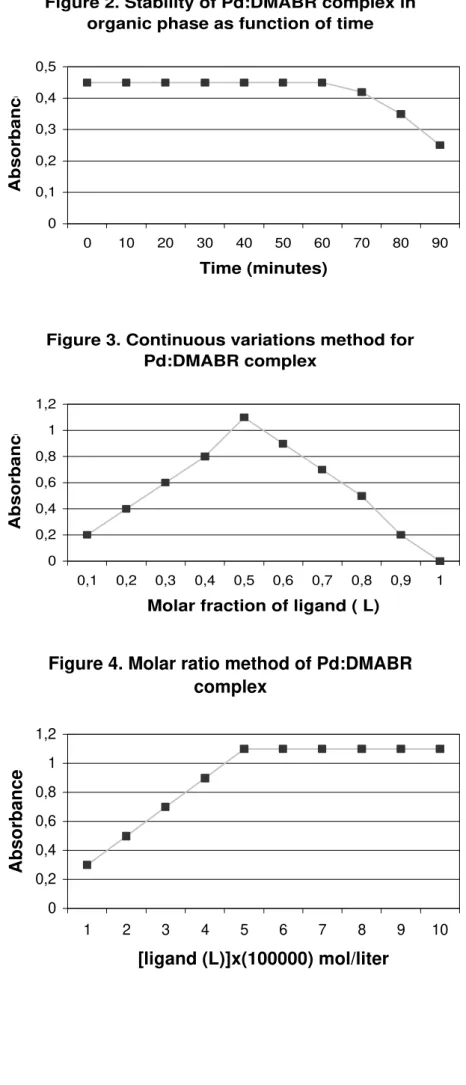
Optimum pH range was 2.0 – 2.5 with maximum efficiency at pH 2.4. Figure 2 shows the stability for the complex Pd2+:DMABR in organic phase as function of time with absorbance reading at 502 nm. The complex was very stable for at least 60 minutes as shown in Figure 2.
Table 1. Effects of interfering ions (*).
Ion tolerance limit tolerance limit observed error % Investigated (µg.mL-1) (µg.mL-1) (**)
UO2 2+
300 0
Cu2+ 100 300 +5
Fe3+ 30 300 +3
Pb2+ 30 300 +5
Ti3+ 30 300 0
In3+ 50 0
Al3+ 50 0
Ni2+ 30 300 0
Th(IV) 300 0
Si(IV) 300 0
Au3+ 0,30 +2
Au
3+0,60 + 39
Au3+ 300 (#) 0
Ag+ 0,30 0
Ag+ 0,60 +6
Ag+ 300 0
Hg2+ 0,30 0
Hg2+ 0,60 +38
Hg2+ 300 0
(*) In the presence of 0,12
µ
g.mL
-1of Pd
2+in aqueous phase, pH 2.4.
(**) In the presence of masking substances in aqueous phase.
Table 2. Pd2+ determination in quartz vein(*) and metal alloy used in (**).
(*) Pd
2+determination in quartz vein
Samples [Pd
2+] (mg/g) [Pd
2+] (mg/g)
n
0. spectrophotometry ICP-MS(#)
1 0,20 0,24 2 0,18 0,21 3 0,22 0,18 4 0,20 0,20 5 0,20 0,22 Average 0,20 ± 0,01 0,21 ± 0,02
(**) Pd2+ determination in metal alloy
Samples [Pd2+] (mg/g) [Pd2+](mg/g) Spectrophotometry ICP-MS(#) 1 0,27 0,27 2 0,20 0,23 3 0,24 0,28 4 0,26 0,22 5 0,28 0,30 Average 0,25 ± 0,03 0,26 ± 0,03
(*) Quartz vein = pegmatite sample from Campo Largo County, Parana State, Brazil. (**) Metal alloy used in jewelry containing Pd, Cu e Ag.
(#) Performed by ICP-MS ( Instituto de Tecnologia do Paraná-TECPAR-Brazil).
F i g ur e 1 . Extraction efficiency of P d (II) as function of pH
0 2 0 4 0 6 0 8 0 100 120
1 .0 1.5 2.0 2.5 3 .0 3.5 4.0 4.5
p H o f a q u e o us solution
Figure 2. Stability of Pd:DMABR complex in organic phase as function of time
0 0,1 0,2 0,3 0,4 0,5
0 10 20 30 40 50 60 70 80 90
Time (minutes)
Absorbance
Figure 4. Molar ratio method of Pd:DMABR
complex
0 0,2 0,4 0,6 0,8 1 1,2
1 2 3 4 5 6 7 8 9 10
[ligand (L)]x(100000) mol/liter
Absorbance
Figure 3. Continuous variations method for Pd:DMABR complex
0 0,2 0,4 0,6 0,8 1 1,2
0,1 0,2 0,3 0,4 0,5 0,6 0,7 0,8 0,9 1
Molar fraction of ligand ( L)
Table1 shows the influence of several ions during the extraction of Pd2+:DMABR complex. Gold, silver and mercury were the main interfering ions in concentrations higher than 0.3µg.mL-1.
The analytical calibration curve showed that Beer’s Law was followed from 0.2 to 2.4µg.mL-1 of palladium in organic phase. The detection limit observed for aqueous phase was 0.1µg.L-1. Table 2 shows the spectrophotometric determination of Pd2+ in metal alloy and pegmatite sample of quartz vein, and also the determination by ICP-MS (Inductively coupled plasma atomic emission spectroscopy).
Using the selective extraction of Pd-DMABR complex in MIBK at pH 2.4, no interference was observed by Ni2+, Fe3+, Au3+ ,etc. The following conditions were used for ICP analysis: Spectrometer Baird PSX; 1.0 kwatts; integration time of 5 decseconds; argon flux 7.5 L.min-1; auxiliary argon flux 1.2 Lmin-1; sample introduction rate 1.2 mL.min-1; nebulizer pressure 26 psi; and wavelength 340.458 nm. The 1:1 stoichiometry of Pd2+-DMABR complex were investigated by continuous variation and molar ratio methods as shown in Figures 3 and 4. The calculated formation constant Kf was 2.4 x 10
5
according to Skoog and Leary (1992).
CONCLUSIONS
The interfering action of gold and several ions were investigated and solved by the selective extraction of Pd-DMABR complex in MIBK at pH 2.4. Small amounts of gold in aqueous phase did not interfer during the extraction of Pd-DMABR complex in MIBK at pH 2.4. Samples with larger amounts of gold were separated after precipitation of Pd-DMG. The method investigated is very sensitive for palladium determination.
ACKNOWLEDGEMENTS
The authors would like to thank Brazilian National Council of Scientific and Technological Development (CNPq) by financial support, and
Instituto Tecnológico do Paraná-TECPAR by ICP-MS determination of palladium.
REFERENCES
Borissova,R.; Koeva, M. and Topalova, E.(1975), Predictions of conditions for use of spectrophotometric reagents: p-Dimethylaminobenzylidenerhodanine as a spectrophotometric reagent for silver and palladium.Talanta, 22, 791-796.
Borissova, R.; Mosheva, P.; Ivanova, Z. and Topalova, E. (1975), Extraction-spectrophotometric determination of gold and palladium in materials of complex composition using p-Dimetylamino benzylidenerhodanine. Z.Anal. Chem.,Band 273, Heft 1.
Borissova, R.(1975), Spectrophotometric determination of gold(III) with p-Dimethylaminobenzylidenerhodanine in hydrochloric acid-ethanol medium. Talanta, 22, 797-802.
Doycheva,R.B.; Topalova,E.K. and Mosheva, P.A.(1971), Extraction-spectrophotometric determination of palladium(II) with p-Dimethylaminobenzylidenerhodanine
(DMABR). Comptes rendus de dÁcademie
Bulgare des Sciences, Tome 24, (12),1675-1678.
El-Zawawy, F. M.; El-Shahat, M.F.; Mohamed, A.A. and Zaki, M. T. M. (1995), Spectrophotometric determination of silver and gold with 5-(2,4-Dihydroxybenzylidene) rhodanine and cationic surfactants. Analyst,
120,February,549-554.
Narang, B. D. and Ayres, G. H. (1961), Spectrophotometric determination of palladium(II) with 5(p-imethylamino benzylidene)rhodanine. Analytica Chimica
Acta, 24, 241-249.
Natelson, S. and Zuckerman, J.L. (1951), Estimation of gold in biological materials.Anal.
Chem.,23, (4), April, 653-655.
(DMABR).Comptes rendus de dÁcademie
Bulgare des Sciences, 30, (6),859-862. Sandell,E.B.(1948), Colorimetric determination of
traces of gold. Anal. Chem.,20, (3), March, 253-256.
Sandell, E. B. and Neumayer, J. J. (1951), Photometric determination of traces of silver.
Anal. Chem.,23, (12), December 1863-1865. Skoog, D. A. and Leary, J. J. (1992), Principles
of Instrumental Analysis. Saunders College Publishing. A Harcount Brace Jovanovich College Publisher, New York, pp.152-153. The Merck Index (1976), Ninth Edition, Merck &
Co. Inc.,pp. 906-907.
FIGURE CAPTIONS
Figure 1. Extraction efficiency of Pd(II) as function of pH.
The extractions were performed using a 125mL separatory funnel. The volume used of DMABR in MIBK were 2.5 mL and after four extractions the total volume were 10.0mL. The absorbances reading were at 502nm using 10mm cell. The following concentrations were used:DMABR = 1.0x10⁻⁴ mol.L-1 and Pd2+ = 0.12 µg.mL-1.
Figure 2. Stability of Pd-DMABR complex in
organic phase as function of time.
The organic extract of Pd-DMABR complex
were investigated for stability, reading the
absorbances at 502nm in time intervals of 5
minutes during 90 minutes.
Figure 3. Continuous variations method of Pd-DMABR complex.
Tem volumetric flasks of 10.0mL were used to investigate the continuous variations method. The initial concentrations of Pd2+ and DMABR were 7.34 x 10⁻⁵ mol.L-1. The first flask shows that the volume proportion were 9.0mL of Pd(II) and 1.0mL of DMABR. In the stoichiometry ratio (1:1) the volumes proportions were 5.0mL of Pd2+ and 5.0mL of DMABR solutions, as shown in Figure 3.
Figure 4. Molar ratio method of Pd-DMABR complex.
The concentration of Pd2+ was 5.0x10⁻⁵ mol.L-1 keeping constant over the total experiment. The concentrations of ligand (DMABR) were variable and changed from 1.0x10⁻⁵ mol.L-1 to 9.0x10⁻⁵ mol.L-1.