Article
J. Braz. Chem. Soc., Vol. 20, No. 9, 1638-1645, 2009. Printed in Brazil - ©2009 Sociedade Brasileira de Química 0103 - 5053 $6.00+0.00
*e-mail: [email protected]
Sparkle/PM3 for the Modeling of Europium(III), Gadolinium(III),
and Terbium(III) Complexes
Ricardo O. Freire,a Gerd B. Rochab and Alfredo M. Simas*,c
aDepartamento de Química, CCET, Universidade Federal de Sergipe, 49000-100 São Cristóvão-SE, Brazil
bDepartamento de Química, CCEN, Universidade Federal da Paraíba, 58059-970 João Pessoa-PB, Brazil
cDepartamento de Química Fundamental, CCEN, Universidade Federal de Pernambuco,
50590-470 Recife-PE, Brazil
O modelo Sparkle/PM3 é parametrizado para complexos de európio (III), gadolínio (III) e térbio (III). A validação do modelo foi realizada utilizando noventa e seis complexos de Eu(III), setenta complexos de Gd(III) e quarenta e dois complexos de Tb(III); todos a partir de estruturas cristalográicas de alta qualidade, com fator R < 5%. Os erros médios absolutos, obtidos com o modelo Sparkle/PM3, considerando todas as distâncias interatômicas do tipo lantanídeo-átomo ligante, foram 0,080 Å para Eu(III), 0,063 Å para Gd(III) e 0,070 Å para Tb(III). Estes valores médios são similares aos obtidos com o modelo Sparkle/AM1 (0,082 Å, 0,061 Å, e 0,068 Å, respectivamente). Além disso, a exatidão em reproduzir o poliedro de coordenação de complexos de Eu(III), Gd(III) e Tb(III) é similar à obtida utilizando métodos ab initio com potenciais efetivos de caroço. Finalmente, com o objetivo de avaliar se as geometrias preditas com o modelo Sparkle/PM3 são coniáveis, escolhemos um dos complexos de Eu(III), BAFZEO, para o qual geramos centenas de diferentes geometrias iniciais, onde variamos de forma aleatória as distâncias e ângulos entre os ligantes e o íon Eu(III). Em seguida, todas essas geometrias iniciais foram otimizadas usando o modelo Sparkle/PM3. Como resultado, observamos uma tendência signiicativa onde a geometria que apresentou o menor erro médio absoluto apresentou também a energia total mais baixa, o que reforça a validade do modelo Sparkle.
The Sparkle/PM3 model is extended to europium(III), gadolinium(III), and terbium(III) complexes. The validation procedure was carried out using only high quality crystallographic structures, for a total of ninety-six Eu(III) complexes, seventy Gd(III) complexes, and forty-two Tb(III) complexes. The Sparkle/PM3 unsigned mean error, for all interatomic distances between the trivalent lanthanide ion and the ligand atoms of the irst sphere of coordination, is: 0.080 Å for Eu(III); 0.063 Å for Gd(III); and 0.070 Å for Tb(III). These igures are similar to the Sparkle/AM1 ones of 0.082 Å, 0.061 Å, and 0.068 Å respectively, indicating they are all comparable parameterizations. Moreover, their accuracy is similar to what can be obtained by present-day ab initio effective core
potential full geometry optimization calculations on such lanthanide complexes. Finally, we report a preliminary attempt to show that Sparkle/PM3 geometry predictions are reliable. For one of the Eu(III) complexes, BAFZEO, we created hundreds of different input geometries by randomly varying the distances and angles of the ligands to the central Eu(III) ion, which were all subsequently fully optimized. A signiicant trend was unveiled, indicating that more accurate local minima geometries cluster at lower total energies, thus reinforcing the validity of sparkle model calculations.
Keywords: Sparkle model, AM1, PM3, lanthanide complexes, rare earth coordination
compounds
Introduction
Lanthanide complexes of the trivalent ions of europium, gadolinium, and terbium display a wide range of
Freire et al. 1639 Vol. 20, No. 9, 2009
The theoretical design of new ligands, capable of forming stable and highly luminescent complexes, where the aim is to achieve strong ligand to-metal energy transfer rates and intense metal-centered emission, requires a description of ligand ield effects. Accordingly, characterization of the interaction between the ligands and the central ion can be done through the ligand ield parameters, which can be calculated provided that the coordination polyhedron geometry of the complex is known. Within the simple overlap model,12,13 the values of ligand ield parameters depend mainly on the interatomic distances between the ligand atoms and the central lanthanide ion. This dependence goes with the third, the ifth, and even with the seventh power of the lanthanide-ligand interatomic distances, thus amplifying any inaccuracies.
On the other hand, gadolinium complexes which serve as magnetic resonance imaging contrast agents normally contain one coordinated inner-sphere water molecule. Because this water molecule is in fast exchange with bulk solvent, the gadolinium ion is able to catalytically change the relaxation rate of solvent protons, a phenomenon called relaxivity. A larger relaxivity means either that imaging can be carried out in low concentration target regions, or that the contrast agent may be administered at a lower dose. For the inner-sphere water molecule, the relaxation occurs predominantly via the dipolar mechanism, which has a 1/r6 dependence where r is the distance of the gadolinium ion to the water proton.14
Hence, the geometry of a lanthanide complex is its
single most relevant feature for complex design. Even
more important is an accurate knowledge of the distances between the lanthanide ion and its directly coordinated ligand atoms. This knowledge is essential for a correct assessment of the inluence of the chemical environment on the 4fn lanthanide ion coniguration and of its effect on the spectroscopic and magnetic properties of the complex.
However, modeling lanthanide complexes is a challenging task because lanthanide ions do not display stereochemical preferences, possess a handful of high coordination numbers, and display small energy variations among their various coordination polyhedron geometries.
In a recent paper we introduced Sparkle/AM1,15 a new paradigm for semiempirical quantum chemical calculations on lanthanide complexes. In this model, when a lanthanide complex is calculated, the lanthanide is represented by a sparkle, whereas the ligands are modeled by AM1.16 Besides the geometry, this allows the calculation of many other properties of the complexes, such as vibrational spectra, thermodynamic quantities, isotopic substitution effects and force constants, ionization potential, electron densities, dipole moments, etc.17
The Sparkle/AM118-24 was mainly designed to predict the ground state geometries of lanthanide complexes at a level of accuracy useful for complex design. Recent research on lanthanide complexes has in fact indicated that Sparkle/AM1 coordination polyhedron geometries are comparable to, if not better than geometries obtained from the best contemporary ab-initio full geometry optimization
calculations with effective core potentials.25,26 Besides, Sparkle/AM1 calculations are hundreds of times faster,15 and have been recently employed for the study of quantum yields of luminescence.27-34
However, although AM1 generally produces satisfactory results and its trustworthiness has been extensively time-tested, other semiempirical models may prove more advantageous for some particular applications.
PM335,36 is also a very popular semiempirical molecular orbital model, which predominantly gives enthalpies of formation with lower average errors than AM1. Indeed, PM3 has a wide following and is available in a variety of quantum chemical softwares, both commercial and non-commercial.17,37-45 Recently, for example, PM3 has been used by Lu et al.46 to calculate molecular orbital properties of the ligands of lanthanide (III) double decker complexes, which were helpful to the understanding of the electrochemical properties of the complexes. Possibly, researchers in general will be able to gain more insights, as PM3 parameters for the lanthanides become available, because PM3 calculations will then become possible, not only for the ligands, but for the whole complexes as well.
In order to amplify the range of applications of our sparkle model, we advance, in the present article, Sparkle/PM3 parameters for the calculation of Eu(III), Gd(III), and Tb(III) complexes to complement the Sparkle/AM1 parameters that have already been published for these ions.15 We also present some evidence that geometries obtained via
Sparkle/PM3 calculations are indeed trustworthy.
Results and Discussion
The Sparkle model assumes that the angular effects of the f orbitals are negligible, and do not take them into account. The sparkle model replaces the lanthanide(III) ion by a Coulombic charge of +3e superimposed to a repulsive exponential
potential of the form exp(-αr), which accounts for the size of the ion; provides three electrons to the orbitals of the ligands; adds two Gaussian functions to the core-core repulsion energy term; and includes the lanthanide atomic mass. Thus, the sparkle model assumes that the lanthanide trications behave like simple ions, without any angular steric properties.
Sparkle/PM3 for the Modeling of Europium(III), Gadolinium(III), and Terbium(III) Complexes J. Braz. Chem. Soc.
1640
was essentially the same as the one of our previous work.15
Accordingly, we only used high quality crystallographic structures (R-factor < 5%) of complexes taken from the Cambridge Structural Database 2003 (CSD),47-49 having
found a total of 96 structures of complexes of Eu(III), 70 of Gd(III), and 42 of Tb(III). As training sets we used the same three subsets of 15 complexes each, already chosen for the parameterization of Sparkle/AM1 for the same ions.15
The Sparkle/PM3 parameters found for the three lanthanide ions are shown in Table 1.
As geometry accuracy measures, we used the average unsigned mean error for each complex i, UMEi, deined as:
(1)
where ni is the number of ligand atoms directly coordinating
the lanthanide ion. Two cases have been examined: (i)
UME(Ln-L)s involving the interatomic distances Rj between
the lanthanide central ion, Ln, and the atoms of the coordination polyhedron, L, important to complex design; and (ii) UMEs of all the edges of the pyramids, that is, of
the interatomic distances Rj between the lanthanide central
ion and the atoms of the coordination polyhedron, as well as all the interatomic distances Rj between all atoms of
the coordination polyhedron. Tables S1, S2, and S3 of the supplementary material present the UME(Ln-L)s and UMEs for both Sparkle/PM3 and Sparkle/AM1 for Eu(III), Gd(III), and Tb(III), respectively.
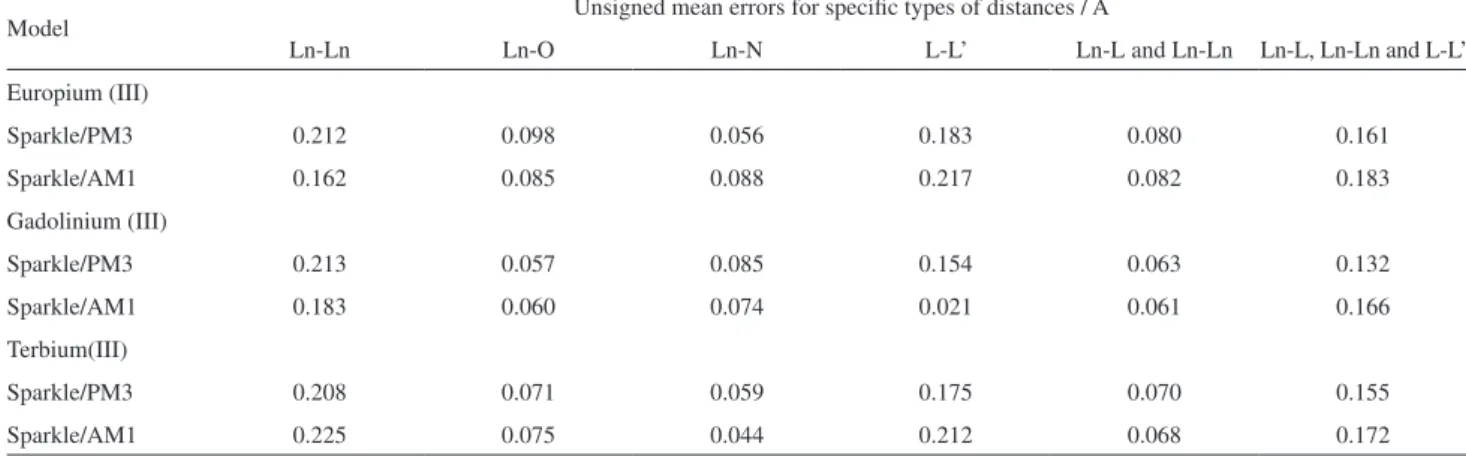
Table 2 presents the unsigned mean errors for both Sparkle/PM3 and Sparkle/AM1 for various types of distances in the Eu(III), Gd(III) and Tb(III) complexes considered. Results indicate that, for the three lanthanide ions considered, the two models are essentially equivalent. Distances between the lanthanide ion and its directly coordinated ligand atoms are predicted with higher accuracy than either the distances between two lanthanide ions in dilanthanide compounds, or the distances between atoms of the faces of the coordination polyhedron. This is fortunate, because radial lanthanide ion-ligand atom distances are far more important for both luminescent complex design32,33,50 and magnetic resonance imaging contrast agent design.14
Assuming that the sparkle model is a good representation of the lanthanide ion, as well as of its interactions with the ligands, the distribution of these UMEs should be random around a mean, whose value can be used as a measure of accuracy of the model. Since the UMEs are positive, deined in the domain (0,∞), they should follow the gamma distribution which has the probability density function g(x; k, θ), where x > 0 stands for the UMEs, k > 0 is the
Table 1. Parameters for the Sparkle/PM3 model for the Eu(III), Gd(III) and Tb(III) ions
Sparkle/PM3
Eu(III) Gd(III) Tb(III)
GSS 55.5863246694 54.8086404668 56.2564137683
ALP 2.1398139884 3.6813938335 2.8245126194 a1 0.6101627168 0.7706615984 1.3428294115 b1 7.1373146362 7.5453068267 7.5782265384
c1 1.7807085112 1.7636673188 1.7181508908 a2 0.3415714636 0.0936188340 0.2651000290 b2 9.1732778046 8.2224517067 6.4476118233
c2 3.0121099267 2.9879390071 2.9952711306
*EHEAT /
(kcal mol-1) 1006.6 991.37 999.0
AMS / amu 151.9650 157.2500 158.92534
* The heat of formation of the Eu(III), Gd(III) and Tb(III) ions in Sparkle/PM3 and Sparkle/AM1 models were obtained by adding to the heat of atomization of each respective lanthanide, their irst three ionization potentials.
Table 2. Sparkle/PM3 and Sparkle/AM1 unsigned mean errors for all distances involving the central lanthanide ion, Ln, and the ligand atoms of the
coordination polyhedron, L, for ninety-six Eu(III) complexes; seventy Gd(III) complexes and forty-two Tb(III) complexes considered
Model Unsigned mean errors for speciic types of distances / Å
Ln-Ln Ln-O Ln-N L-L’ Ln-L and Ln-Ln Ln-L, Ln-Ln and L-L’
Europium (III)
Sparkle/PM3 0.212 0.098 0.056 0.183 0.080 0.161
Sparkle/AM1 0.162 0.085 0.088 0.217 0.082 0.183
Gadolinium (III)
Sparkle/PM3 0.213 0.057 0.085 0.154 0.063 0.132
Sparkle/AM1 0.183 0.060 0.074 0.021 0.061 0.166
Terbium(III)
Sparkle/PM3 0.208 0.071 0.059 0.175 0.070 0.155
Freire et al. 1641 Vol. 20, No. 9, 2009
shape parameter, and θ > 0 is the scale parameter of the gamma distribution. The expected value of the gamma distribution is simply kθ. The shape and scale parameters were estimated with the method of maximum likelihood in order to obtain the gamma distribution it of the UME data.
The quality of the gamma distribution it can be assessed
via the one-sample non-parametric Kolmogorov-Smirnov51
test. For the hypothesis that the UME values follow a gamma distribution not to be rejected at the usual level of 5%, the p-value of the test statistic must thus be larger than 0.05. And the higher the p-value, whose maximum possible value is 1, the higher the probability that the UMEs deviations of the mean are random, and the more justiiable is the use of the statistical tools employed here, and, by extension, of the sparkle model itself.
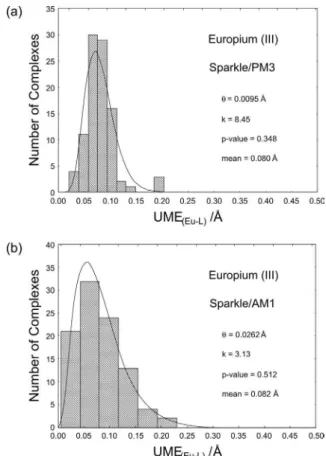
Figure 1 presents a gamma distribution fit of the UME(Eu-L)s for europium(III) for both Sparkle/PM3 and the already published Sparkle/AM1.15 Superimposed to the it, a histogram of the data with the number of bars
chosen to best adjust the histogram to the curve obtained from the gamma distribution it is also presented so that the reader can check the regions where the actual UMEs really occurred. The p-value of the gamma distribution its for Sparkle/PM3 and Sparkle/AM1 are 0.348 and 0.512, respectively, both above the 0.05 value, thus attaching statistical signiicance to the it and, by extension, to both sparkle models as well. Figures 2 and 3 present similar results for the sparkle models of gadolinium(III) and terbium(III), with similar results and conclusions.
When a complex, whose experimental geometry is unknown, is subject to a Sparkle/PM3 calculation, an input geometry must be provided by the user. Since lanthanide complexes are flexible, the conformational energy hypersurface of such complex may contain a number of local minima, and by deinition, one global minimum. Thus, the input geometry may either converge to one of the local minima, or ideally, to the global minimum. For the sparkle model to be useful, the minima with lower energies
Figure 1. Probability densities of the Gamma distribution its of the
UME(Ln-L)s for the Eu(III) Sparkle/PM3 and Sparkle/AM1 models, superimposed to histograms of the same data for all 96 Eu(III) complexes considered; where k is the shape parameter and θ is the scale parameter of the gamma distribution; the p-value is a measure of the signiicance of the gamma distribution it; and mean is the expected value of the itted gamma distribution, which is set to be equal to the arithmetic mean value of the 96 UME(Ln-L)s.
Sparkle/PM3 for the Modeling of Europium(III), Gadolinium(III), and Terbium(III) Complexes J. Braz. Chem. Soc.
1642
must also be the ones closer to the experimental geometry. Likewise, as the energies of the local minima increase, we expect their UME(Ln-L)s to also increase.
In order to verify this hypothesis, a particular europium(III) complex, of CSD code BAFZEO, was selected as a case study. BAFZEO was chosen because: (i) it is lexible; (ii) it is coordinated to four ligands of
three different types: two nitrates, one β-diketone and one terpyridine; and (iii) a full Sparkle/PM3 optimization of its
geometry is relatively fast.
We then generated 200 different input geometries for this complex. Each of the geometries resulted from the application of a procedure to each and every one of its ligands in an independent manner. In this procedure, the ligands are considered to be rigid and independent of each other and of the central europium ion. Starting with the experimental geometry, for each ligand we proceeded as follows: (i) we deined a randomly oriented Cartesian
coordinate system whose origin is located at the center of mass of the ligand; (ii) we then randomly chose one
of the three axis of this Cartesian coordinate system; (iii)
we rotated the ligand around this chosen axis by a random angle in the interval [+30°, −30°]; (iv) subsequently, one of
the atoms of the ligand, we called atom R, was randomly chosen to deine the axis connecting it to the europium ion; (v) a random translation, in the direction of this axis,
was inally applied to the whole ligand, the magnitude of this translation in the interval [−15%,+15%] of the interatomic distance between the europium ion and atom R of the ligand.
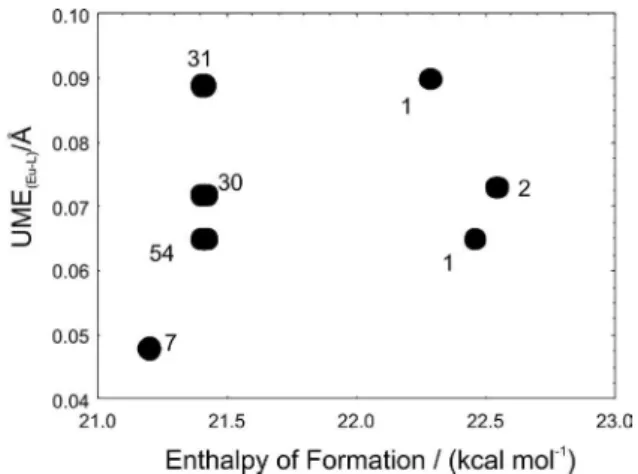
For each of the 200 different input geometries, we performed a full Sparkle/PM3 geometry optimization. For some of the input geometries, the starting distances of the originally coordinating atoms were so far away from the europium atom that the corresponding Sparkle/PM3 geometry optimizations converged to uncoordinated complexes. A total of 64 of the outputs were then discarded for this reason. The remaining 136 output geometries with properly coordinated ligands grouped themselves into two main clusters of local minima, as can be seen in Figure 4: one around an enthalpy of formation of 143 kcal mol-1, with 10 outputs, and the other around 22 kcal mol-1, with 126 outputs. As expected, the cluster with the highest enthalpies of formation was also the cluster with the highest UME(Eu-L)s and this is precisely the trend we were expecting. Nevertheless, we then decided to examine in greater detail the cluster around 22 kcal mol-1. Figure 5 shows that this cluster is actually comprised of seven different smaller clusters of local minima, all very similar and with very low UME(Eu-L)s around 0.07 Å, a level of accuracy already useful for complex design. The number of outputs in each of the smaller clusters is also indicated in Figure 5. The cluster with the lowest enthalpy of formation, at 21.2 kcal mol-1, happened to be
Figure 3. Probability densities of the Gamma distribution its of the
UME(Ln-L)s for the Tb(III) Sparkle/PM3 and Sparkle/AM1 models, superimposed to histograms of the same data for all 42 Tb(III) complexes considered; where k is the shape parameter and θ is the scale parameter of the gamma distribution; the p-value is a measure of the signiicance of the gamma distribution it; and mean is the expected value of the itted gamma distribution, which is set to be equal to the arithmetic mean value of the 42 UME(Ln-L)s.
Freire et al. 1643 Vol. 20, No. 9, 2009
also the cluster with the lowest UME(Eu-L)sat 0.048 Å. As shown in Figure 5, seven different inputs converged to this minimum, which likely is also the global minimum.
These results indicate that a significant trend was unveiled by this study: that more accurate geometry local minima tend to cluster at lower total energies. This trend conirms the validity of Sparkle/PM3 as a trustworthy geometry prediction tool.
Recently, an exhaustive study by our research group has been accomplished on coordination polyhedron geometry prediction accuracies of ab initio effective core potential (ab initio/ECP) calculations.26 The study consisted of complete full geometry optimization calculations on dozens of complexes of various lanthanide ions, the largest containing 164 atoms, varying both basis sets (STO-3G, 3-21G, 6-31G, 6-31G*, and 6-31+G) and method (HF, B3LYP, and MP2 full). The amazing conclusion was that RHF/STO-3G/ ECP appears to be the most eficient model chemistry in terms of coordination polyhedron crystallographic geometry predictions from isolated lanthanide complex ion calculations. Contrary to what would normally be expected, either an increase in the basis set or inclusion of electron correlation, or both, consistently enlarged the deviations and aggravated the quality of the predicted coordination polyhedron geometries.
For each of the Eu(III), Gd(III), and Tb(III) ions, the study reported ab-initio/ECP full geometry optimizations
on six complexes.26
The RHF/STO-3G/ECP average UME and UME(Ln-L)
for the six Eu(III) complexes calculated were 0.119 Å and 0.042 Å, similar to the respective Sparkle/PM3 numbers
of 0.154 Å and 0.060 Å; and to the Sparkle/AM1 numbers of 0.122 Å and 0.046 Å.
Likewise, the RHF/STO-3G/ECP average UME and UME(Ln-L) for the six Gd(III) complexes calculated were 0.116 Å and 0.047 Å, also similar to the respective Sparkle/PM3 numbers of 0.096 Å and 0.054 Å; and to the Sparkle/AM1 numbers of 0.100 Å and 0.051 Å.
Finally, for the six Tb(III) complexes, the average UME and UME(Ln-L) for the RHF/STO-3G/ECP geometries were reported as 0.164 Å and 0.048 Å; again, comparable to the respective Sparkle/PM3 numbers of 0.117 Å and 0.049 Å; and to the Sparkle/AM1 numbers of 0.110 Å and 0.043 Å.
Conclusions
The most accurate ab initio full geometry optimization
calculations that can be nowadays carried out on europium, gadolinium and terbium complexes, of a size large enough to be of relevance to present-day research, exhibit the same accuracy of either Sparkle/PM3 or Sparkle/AM1 models. Our results do indicate that the Sparkle model is an accurate and statistically valid tool for the prediction of coordination polyhedra of lanthanide complexes.
Given the fact that sparkle calculations are hundreds of times faster, potential energy surface scan searches for a global minimum become feasible. And from the results presented in this article, these searches appear to be indeed meaningful. Sparkle calculations can also be used in molecular dynamics when calculations on the same system must be carried out repeatedly.
More importantly, the ability to perform a screening on many different putative structures of lanthanide complexes in a combinatorial manner, made possible by both Sparkle/PM3 and Sparkle/AM1, may prove to be of importance for luminescence or magnetic resonance imaging research.
Acknowledgments
We appreciate the inancial support from CNPq, and also grants from the IM2C (Brazilian Millennium Institute on Complex Materials) and RENAMI (Brazilian Molecular and Interfaces Nanotechnology Network). The authors are grateful to Prof. A. E. Almeida Paixão for the use of Statistica 6.0. Finally, we gratefully acknowledge the Cambridge Crystallographic Data Centre for the Cambridge Structural Database.
Supplementary Information
Instructions on how to run lanthanide complexes Sparkle calculations with MOPAC 2007 (from http://
Figure 5. Enlargement of the group of clusters of Figure 4 located
Sparkle/PM3 for the Modeling of Europium(III), Gadolinium(III), and Terbium(III) Complexes J. Braz. Chem. Soc.
1644
openmopac.net) and also on how to visualize the structures of the complexes using RASMOL (from http://www.umass. edu/microbio/rasmol/); sample MOPAC 2007 input (.mop) and output (.arc) iles for the complex Eu[TREN-1,2-HOIQO(H2O)2. Tables of UME(Ln-L)s and UMEs for both Sparkle/PM3 and Sparkle/AM1 for Eu(III), Gd(III), and Tb(III), respectively. Figures with gamma distribution its of the UME data for both Sparkle/PM3 and Sparkle/AM1 models for Eu(III), Gd(III) and Tb(III). This material is available free of charge at http://jbcs.sbq.org.br, as PDF ile.
References
1. Lenaerts, P.; Görller-Walrand, C.; Binnemans, K.; J. Lumin.
2006,117, 163.
2. Kautenburger, R.; Nowotka, K.; Beck, H. P.; Anal. Bioanal. Chem.2006, 384, 1416.
3. Tsuchiya, D.; Kunishima, N.; Kamiya, N.; Jingami, H.; Morikawa, K.; Proc. Natl. Acad. Sci.2002, 99,2660. 4. Buunzli, J.-C. G.; Piquet, C.; Chem. Rev.2002, 102, 1897.
5. Tsukube, H.; Shinoda, S.; Chem. Rev.2002, 102,2389. 6. Parker, D.; Dickins, R. S.; Puschmann, H.; Crossland, C.;
Howard, S. A. K.; Chem. Rev.2002, 102,1977.
7. Lei, K.; Liu, W.; Huang, X.; Wang, D.; Chem. Pharm. Bull.
2006, 54,1150.
8. Viguier, R. F. H.; Hulme, A. N.; J. Am. Chem. Soc.2006, 128,
11370.
9. Skripinets, Yu. V.; Egorova, A. V.; Ukrainets, I. V.; Antonovich, V. P.; J. Anal. Chem.2006, 61,44.
10. Tan, M.; Song, B.; Wang, G. N.; Yuan, J.; Free Radical Biol. Med.2006, 40, 1644.
11. Liu, Y.; Zhang, N.; Chen, Y.; Chen, G.-S.; Bioorg. Med. Chem.
2006, 14, 6615.
12. Malta, O. L.; Chem. Phys. Lett.1982, 87, 27.
13. Malta, O. L.; Chem. Phys. Lett.1982, 88, 353.
14. Caravan, P.; Astashkin, A. V.; Raitsimring, A. M.; Inorg. Chem.
2003, 42, 3972.
15. Freire, R. O.; Rocha, G. B.; Simas, A. M.; Inorg. Chem.2005,
44, 3299.
16. Dewar, M. J. S.; Zoebish, E. G.; Healy, E. F.; Stewart, J. J. P.;
J. Am. Chem. Soc.1985, 107, 3902.
17. Stewart, J. J. P.; MOPAC93.00 Manual; Fujitsu Limited: Tokyo,
1993.
18. Costa Jr., N. B.; Freire, R. O.; Rocha, G. B.; Simas, A. M.;
Polyhedron2005, 24, 3046.
19. Freire, R. O.; Rocha, G. B.; Simas, A. M.; Chem. Phys. Lett.
2005, 411, 61
20. Costa Jr., N. B.; Freire, R. O.; Rocha, G. B.; Simas, A. M.;
Inorg. Chem. Commun.2005, 8, 831.
21. Freire, R. O.; Costa Jr., N. B.; Rocha, G. B.; Simas, A. M.;
J. Chem. Theory Comput. 2006, 2, 64.
22. Freire, R. O.; Monte, E. V.; Rocha, G. B.; Simas, A. M.;
J. Organomet. Chem.2006, 691, 2584.
23. Freire, R. O.; Costa Jr., N. B.; Rocha, G. B.; Simas, A. M.;
J. Phys. Chem. A2006, 110, 5897.
24. Bastos, C. C.; Freire, R. O.; Rocha, G. B.; Simas, A. M.;
J. Photochem. Photobiol., A 2006, 117, 225.
25. Freire, R. O.; Rocha, G. B.; Albuquerque, R. Q.; Simas, A. M.;
J. Lumin.2005, 111, 81.
26. Freire, R. O.; Rocha, G. B.; Simas, A. M.; J. Mol. Model.2006,
12, 373.
27. Nobre, S. S.; Lima, P. P.; Mafra, L.; Sa Ferreira, R. A.; Freire, R. O.; Fu, L.; Pischel, U.; de Zea Bermudez, V.; Malta, O. L.; Carlos, L. D.; J. Phys. Chem. C 2007, 111, 3275.
28. de Mesquita, M. E.; Junior, S. A.; Oliveira, F. C.; Freire, R. O.; Júnior, N. B. C.; de Sá, G. F.; Inorg. Chem. Commun.2002, 5, 292.
29. de Mesquita, M. E.; Junior, S. A.; Júnior, N. B. C.; Freire, R. O.; Silva, F. R. G.; de Sá, G. F.; J. Solid State Chem.2003, 171,
183.
30. Faustino, W. M.; Malta, O. L.; Teotonio, E. E. S.; Brito, H. F.; Simas, A. M.; de Sa, G. F.; J. Phys. Chem. A2006, 110, 2510. 31. de Mesquita, M. E.; Gonçalves e Silva, F. R.; Albuquerque, R.
Q.; Freire, R. O.; da Conceição, E. C.; da Silva, J. E. C.; Júnior, N. B. C.; de Sá, G. F.; J. Alloys Comp.2004, 366, 124.
32. Freire, R. O.; Gonçalves e Silva, F. R.; Rodrigues, M. O.; de Mesquita, M. E.; Junior, N. B. C. ; J. Mol. Model.2005, 12, 16.
33. Freire, R. O.; Albuquerque, R. Q.; Alves Jr., S.; Rocha, G. B.; de Mesquita, M. E.; Chem. Phys. Lett.2005, 405, 123.
34. Pavithran, R.; Reddy, M. L. P.; Junior, S. A.; Freire, R. O.; Rocha, G. B.; Lima, P. P.; Eur. J. Inorg. Chem.2005, 20, 4129.
35. Stewart,J. J. P.; J. Comp. Chem.1989, 10, 209.
36. Stewart,J. J. P.; J. Comp. Chem.1989, 10, 221.
37. Frisch, M. J.; Trucks, G. W.; Schlegel, H. B.; Scuseria, G. E.; Robb, M. A.; Cheeseman, J. R.; Zakrzewski, V. G.; Montgomery, J. A. Jr.; Stratmann, R. E.; Burant, J. C.; Dapprich, S.; Millam, J. M.; Daniels, A. D.; Kudin, K. N.; Strain, M. C.; Farkas, O.; Tomasi, J.; Barone, V.; Cossi, M.; Cammi, R.; Mennucci, B.; Pomelli, C.; Adamo, C.; Clifford, S.; Ochterski, J.; Petersson, G. A.; Ayala, P. Y.; Cui, Q.; Morokuma, K.; Malick, D. K.; Rabuck, A. D.; Raghavachari, K.; Foresman, J. B.; Cioslowski, J.; Ortiz, J. V.; Stefanov, B. B.; Liu, G.; Liashenko, A.; Piskorz, P.; Komaromi, I.; Gomperts, R.; Martin, R. L.; Fox, D. J.; Keith, T.; Al-Laham, M. A.; Peng, C. Y.; Nanayakkara, A.; Gonzalez, C.; Challacombe, M.; Gill, P. M. W.; Johnson, B. G.; Chen, W.; Wong, M. W.; Andres, J. L.; Head-Gordon, M.; Replogle, E. S.; Pople, J. A.; Gaussian 98; revision A.7; Gaussian; Inc.:
Pittsburgh; PA; 1998.
38. HyperChem(TM) Professional 7.51; Hypercube, Inc., 1115 NW
4th Street, Gainesville, Fl 32601, USA.
39. Spartan ‘04; Wavefunction, Inc., 18401 Von Karman Avenue,
Freire et al. 1645 Vol. 20, No. 9, 2009
40. Case, D. A.; Darden, T. A.; Cheatham III, T. E.; Simmerling, C. L.; Wang, J.; Duke, R. E.; Luo, R.; Merz, K. M.; Wang, B.; Pearlman, D. A.; Crowley, M.; Brozell, S.; Tsui, V.; Gohlke, H.; Mongan, J.; Hornak, V.; Cui, G.; Beroza, P.; Schafmeister, C.; Caldwell, J. W.; Ross, W. S.; Kollman, P. A.; AMBER version 8; University of California San Francisco, 2004.
41. Field, M. J.; Albe, M.; Bret, C.; Proust-De Martin, F.; Thomas, A.; J. Comput. Chem.2000, 21,1088.
42. VAMP, version 8; Accelrys Corporate Headquarters: San Diego, USA, 2001.
43. Rowley, C.; Hassinen, T.; Ghemical for GNOME, version 1.00, University of Iowa: Iowa City, USA, 2002.
44. Jorgensen, W. L. In The Encyclopedia of Computational Chemistry; Schleyer, P. v. R., ed., John Wiley & Sons Ltd.:
Athens, USA, 1998, vol. 5, p. 3281.
45. AMPAC, version 8; Semichem Inc.: Shawnee, USA, 2004.
46. Lu, G.; Bai, M.; Li, R.; Zhang, X.; Ma, C.; Lo, P.-C.; Ng, D.K.P.; Jiang, J.; Eur. J. Inorg. Chem.2006, 18, 3703.
47. Allen, F. H.; Acta Crystallogr., Sect. B: Struct. Sci. 2002, 58, 380.
48. Bruno, I. J.; Cole, J. C.; Edgington, P. R.; Kessler, M.; Macrae, C. F.; McCabe, P.; Pearson, J.; Taylor, R.; Acta Crystallogr., Sect. B: Struct. Sci. 2002, 58, 389.
49. Allen, F. H.; Motherwell, W. D. S.; Acta Crystallogr., Sect. B: Struct. Sci. 2002, 58, 407.
50. de Sá, G. F.; Malta, O. L.; Donega, C. D.; Simas, A. M.; Longo, R. L.; Santa-Cruz, P. A.; da Silva, E. F.; Coord. Chem. Rev.2000,
196, 165.
51. Conover, W. J. In Practical Nonparametric Statistics; 3rd ed., Wiley II, B.; John Wiley & Sons: New York, USA, 1999, p. 428.
Supplementary Information
J. Braz. Chem. Soc., Vol. 20, No. 9, S1-S13, 2009. Printed in Brazil - ©2009 Sociedade Brasileira de Química 0103 - 5053 $6.00+0.00
*e-mail: [email protected]
Sparkle/PM3 for the Modeling of Europium(III), Gadolinium(III),
and Terbium(III) Complexes
Ricardo O. Freire,a Gerd B. Rochab and Alfredo M. Simas*, c
aDepartamento de Química, CCET, Universidade Federal de Sergipe, 49000-100 São Cristóvão-SE, Brazil
bDepartamento de Química, CCEN, Universidade Federal da Paraíba, 58059-970 João Pessoa-PB, Brazil
cDepartamento de Química Fundamental, CCEN, Universidade Federal de Pernambuco,
50590-470 Recife-PE, Brazil
1. How to run lanthanide complexes Sparkle
calculations with MOPAC2007
Updated information on how to run the Sparkle Model can be found in http://www.sparkle.pro.br.
MOPAC2007 is a software released by Prof. James J. P. Stewart from Stewart Computational Chemistry of Colorado Springs, CO, and represents a recent version of the MOPAC series of molecular modeling softwares, which started in 1981.
MOPAC2007 has Sparkle/AM1 and Sparkle/PM3 fully implemented.
A MOPAC2007 executable can be obtained from http://openmopac.net and is presently free for academics.
In order to be acquainted with the software, users are encouraged to read the MOPAC2007 manual at http://openmopac.net/manual/.
As the MOPAC2007 manual says:
“MOPAC is written with the non-theoretician in mind. While MOPAC calls upon many concepts in quantum theory and thermodynamics and uses some fairly advanced mathematics, the users need not be familiar with these specialized topics.”
At present, the most recent version of MOPAC2007 is 7.221.
To run a Sparkle calculation in MOPAC 2007, proceed as follows:
i. Create a data-ile with extension .mop which describes a molecular system and speciies the type of calculation that is to be carried out.
a. Use the lanthanide sparkles as you would use any atom in MOPAC.
b. For a Sparkle/AM1 calculation, use the keyword AM1 in the keyword line.
c. For a Sparkle/PM3 calculation, use the keyword PM3.
ii. Command MOPAC to run the calculation using that data-ile.
iii. Get the desired output on the system from the output iles created by MOPAC.
Attention: Sparkles are overall neutral species Please notice that when one uses a lanthanide as an element symbol in MOPAC2007, one is actually introducing an “overall neutral species” in the calculation, that is: a +3 charged sparkle plus three electrons which will be donated to the molecular orbitals of the organic part of the complex. If the whole complex is charged, then this must be indicated with the appropriate CHARGE keyword.
2. MOPAC2007 Input (.mop) and output (.arc)
iles
Sample input and output files can be found in http://www.sparkle.pro.br.
As an example, we are providing in the appendix of this supplementary material the content of a MOPAC2007 input and the corresponding output ile for [Eu(TREN-1,2-HOIQO)(H2O)2].
In order to reproduce the calculation, please obtain MOPAC2007.exe from http://openmopac.net, which is presently free for academics, copy the contents below to a text ile, name it Eu_tren.mop, and simply open it with MOPAC2007.
Warning: MOPAC2007 output iles with extension .arc may be confused with some types of compressed iles in some Windows systems. Be sure to open them with notepad, or a similar text editor.
3. How to visualize the input (.mop) structures
with RASMOL
Sparkle/PM3 for the Modeling of Europium(III) J. Braz. Chem. Soc.
S2
(http://www.umass.edu/microbio/rasmol/getras.htm). The present version is 2.6.
(1) In RASMOL, click File, then, Open;
(2) In the “Select Molecular Coordinate File”, tell RASMOL to list all iles of the type “MOPAC File Format”;
(3) In “Look in” go to the proper folder and ind your .mop ile.
(2) The .mop ile of interest now appears. Choose it and press OK.
4. Sample Input and Output Files
(3) The molecule or complex now appears drawn on the screen.
Warning: the bond connection algorithm of RASMOL may not work eficiently with some high coordination number lanthanide complexes. Some coordinating bonds may not appear, while sometimes some other spurious bond connections may also appear. However, the positions of the atoms are always correct.
---Begin of ile Eu_tren.mop
---PM3 PRECISE NOINTER XYZ T=10D BFGS GNORM=0.25 + NOLOG GEO-OK MMOK SCFCRT=1.D-10
Eu(TREN-1,2-HOIQO)(H2O)2
Freire et al. S3 Vol. 20, No. 9, 2009
H -1.651300 1 1.688000 1 1.482000 1 C -3.646500 1 0.974100 1 3.698000 1 C -5.091400 1 0.550800 1 3.727600 1 C -5.881900 1 1.138200 1 4.668500 1 H -5.494900 1 1.619500 1 5.363000 1 C -7.328700 1 1.017600 1 4.591400 1 C -8.144000 1 1.608200 1 5.554200 1 H -7.777000 1 2.044800 1 6.289400 1 C -9.535400 1 1.531500 1 5.387200 1 H -10.091900 1 1.904900 1 6.030900 1 C -10.084300 1 0.918900 1 4.306300 1 H -11.009000 1 0.901000 1 4.206400 1 C -9.273300 1 0.318500 1 3.349000 1 H -9.651500 1 -0.097100 1 2.608900 1 C -7.856900 1 0.348200 1 3.512800 1 C -7.024600 1 -0.299600 1 2.549100 1 C 0.324600 1 -1.855000 1 1.535000 1 H 1.097100 1 -1.584500 1 2.055800 1 H 0.644500 1 -2.252400 1 0.709800 1 C -0.448800 1 -2.872100 1 2.301100 1 H 0.154600 1 -3.566000 1 2.609100 1 H -0.842200 1 -2.451500 1 3.081300 1 C -1.324300 1 -4.622400 1 0.873000 1 C -2.440000 1 -5.166000 1 0.011800 1 C -2.255900 1 -6.304200 1 -0.695300 1 H -1.426400 1 -6.720600 1 -0.651500 1 C -3.259100 1 -6.895300 1 -1.499400 1 C -3.070800 1 -8.092900 1 -2.196700 1 H -2.245600 1 -8.517100 1 -2.169400 1 C -4.070700 1 -8.629800 1 -2.905700 1 H -3.935900 1 -9.436900 1 -3.348200 1 C -5.334100 1 -7.987100 1 -2.988900 1 H -6.021500 1 -8.361400 1 -3.491000 1 C -5.530900 1 -6.791700 1 -2.312300 1 H -6.353300 1 -6.360000 1 -2.353800 1 C -4.489400 1 -6.244000 1 -1.571800 1 C -4.705100 1 -4.983700 1 -0.877200 1 N -0.488100 1 -0.666700 1 1.219900 1 N -1.899400 1 -0.429500 1 -1.539700 1 H -2.481600 1 -0.742200 1 -0.988600 1 N -4.763000 1 -0.263800 1 -2.012700 1 N -2.920800 1 0.624600 1 2.624000 1 H -3.225700 1 0.025800 1 2.087900 1 N -5.699400 1 -0.196100 1 2.714800 1 N -1.498600 1 -3.475100 1 1.508700 1 H -2.259100 1 -3.075900 1 1.448900 1 N -3.680200 1 -4.522800 1 -0.090600 1 O -1.583900 1 0.703000 1 -3.464700 1 O -3.230300 1 1.676300 1 4.605800 1 O -0.298300 1 -5.280100 1 0.982100 1 H -8.715200 1 -3.404800 1 0.593000 1 H -7.415400 1 -3.853100 1 2.176700 1 H -8.941000 1 -3.095500 1 -0.590800 1 H -6.155000 1 -4.393200 1 2.638400 1
---Sparkle/PM3 for the Modeling of Europium(III) J. Braz. Chem. Soc.
S4
---Begin of ile Eu_tren.arc
SUMMARY OF PM3 CALCULATION
MOPAC2007 (Version: 7.221W) Fri Aug 29 01:18:10 2008 No. of days left = 197
Empirical Formula: C36 H34 N7 O11 Eu
PM3 PRECISE NOINTER XYZ T=10D BFGS GNORM=0.25 + NOLOG GEO-OK MMOK SCFCRT=1.D-10
Eu(TREN-1,2-HOIQO)(H2O)2
PETERS TEST WAS SATISFIED IN BFGS OPTIMIZATION SCF FIELD WAS ACHIEVED
HEAT OF FORMATION = -158.97121 KCAL = -665.13554 KJ TOTAL ENERGY = -9191.73604 EV
ELECTRONIC ENERGY = -110505.44975 EV CORE-CORE REPULSION = 101313.71372 EV
DIPOLE = 11.48544 DEBYE POINT GROUP: C1 NO. OF FILLED LEVELS = 141
IONIZATION POTENTIAL = 8.395586 EV HOMO LUMO ENERGIES (EV) = -8.396 -1.376 MOLECULAR WEIGHT = 892.669
MOLECULAR DIMENSIONS (Angstroms)
Atom Atom Distance H 64 H 24 14.33674 H 45 H 14 13.29931 H 35 H 68 12.59235
SCF CALCULATIONS = 607
COMPUTATION TIME = 7 MINUTES AND 16.516 SECONDS
FINAL GEOMETRY OBTAINED CHARGE PM3 PRECISE NOINTER XYZ T=10D BFGS GNORM=0.25 +
NOLOG GEO-OK MMOK SCFCRT=1.D-10 Eu(TREN-1,2-HOIQO)(H2O)2
Freire et al. S5 Vol. 20, No. 9, 2009
Sparkle/PM3 for the Modeling of Europium(III) J. Braz. Chem. Soc.
S6
H -0.66128405 +1 -2.6869806 +1 3.0414897 +1 0.0619 C -1.16368322 +1 -4.9650655 +1 0.6490765 +1 0.2997 C -2.33681234 +1 -5.5213613 +1 -0.1134185 +1 -0.2196 C -2.24399850 +1 -6.7277768 +1 -0.7673107 +1 -0.1044 H -1.31215254 +1 -7.3068313 +1 -0.7082705 +1 0.1438 C -3.32876422 +1 -7.2450512 +1 -1.5411393 +1 -0.0113 C -3.21634082 +1 -8.4931535 +1 -2.2009983 +1 -0.0982 H -2.28545605 +1 -9.0639959 +1 -2.1036411 +1 0.1141 C -4.26059204 +1 -8.9741856 +1 -2.9524335 +1 -0.0749 H -4.17317951 +1 -9.9392725 +1 -3.4631556 +1 0.1048 C -5.45448392 +1 -8.2362454 +1 -3.0798313 +1 -0.1168 H -6.27157714 +1 -8.6396639 +1 -3.6869601 +1 0.1075 C -5.59153590 +1 -7.0223348 +1 -2.4502614 +1 -0.0407 H -6.51154007 +1 -6.4332658 +1 -2.5402893 +1 0.1215 C -4.52990310 +1 -6.5156420 +1 -1.6714123 +1 -0.0981 C -4.60695005 +1 -5.2575332 +1 -0.9822355 +1 0.2084 N -0.55703136 +1 -0.7250202 +1 1.2367767 +1 -0.0766 N -1.74854979 +1 -0.1750237 +1 -1.7065181 +1 -0.0537 H -2.45407885 +1 -0.7234838 +1 -1.2272158 +1 0.1615 N -4.59774584 +1 0.1404652 +1 -2.1459825 +1 0.6346 N -2.92435187 +1 0.6303773 +1 2.9716525 +1 -0.0392 H -3.32466553 +1 -0.0488159 +1 2.3367068 +1 0.1566 N -5.76156696 +1 -0.0021041 +1 2.9164812 +1 0.7225 N -1.37898790 +1 -3.8348648 +1 1.4533816 +1 -0.0596 H -2.25043926 +1 -3.3387007 +1 1.3076696 +1 0.1579 N -3.54106413 +1 -4.8198177 +1 -0.2142965 +1 0.6288 O -1.41404762 +1 1.7128994 +1 -2.9525342 +1 -0.4055 O -3.39422074 +1 2.2826708 +1 4.4789702 +1 -0.4023 O -0.06039046 +1 -5.5034025 +1 0.6132755 +1 -0.4004 H -8.37934540 +1 -1.8067675 +1 0.7205355 +1 0.2723 H -6.95657616 +1 -2.8715894 +1 2.4637501 +1 0.2641 H -9.08705670 +1 -2.6663940 +1 -0.3889297 +1 0.2873 H -6.52939585 +1 -4.3812505 +1 2.6414903 +1 0.2860
---Freire et al. S7 Vol. 20, No. 9, 2009
---Begin of ile Eu_9H2O.mop
---PM3 PRECISE NOINTER XYZ BFGS T=10D GNORM=0.25 +
NOLOG GEO-OK SCFCRT=1.D-10 CHARGE=3 cation nona-aqua-europium(III)
Eu 1.369000 1 -1.681000 1 1.064000 1 O -0.594000 1 -1.511000 1 2.460000 1 O 1.716000 1 0.317000 1 2.375000 1 O 1.991000 1 -2.567000 1 -1.095000 1 O 1.397000 1 -4.078000 1 1.364000 1 O 3.707000 1 -2.249000 1 1.279000 1 O -0.576000 1 -2.619000 1 -0.275000 1 O 1.734000 1 -2.424000 1 3.467000 1 O 0.000000 1 0.000000 1 0.000000 1 O 2.951000 1 0.000000 1 0.000000 1 H 0.156000 1 0.883000 1 0.000000 1 H -0.274000 1 -0.199000 1 -0.664000 1 H 2.982000 1 0.809000 1 0.116000 1 H 3.708000 1 -0.126000 1 -0.283000 1 H -1.413000 1 -1.268000 1 2.188000 1 H -0.656000 1 -2.048000 1 2.973000 1 H 1.385000 1 0.473000 1 3.194000 1 H 2.404000 1 0.600000 1 2.332000 1 H 2.810000 1 -2.538000 1 -1.460000 1 H 1.482000 1 -2.464000 1 -1.630000 1 H 1.240000 1 -4.690000 1 0.727000 1 H 1.100000 1 -4.312000 1 2.007000 1 H 4.039000 1 -2.947000 1 1.733000 1 H 4.161000 1 -1.664000 1 1.365000 1 H -1.285000 1 -2.255000 1 -0.461000 1 H -0.559000 1 -3.190000 1 -0.860000 1 H 1.322000 1 -2.194000 1 4.136000 1 H 2.048000 1 -3.130000 1 3.736000 1
---Sparkle/PM3 for the Modeling of Europium(III) J. Braz. Chem. Soc.
S8
---Begin of ile Eu_9H2O.arc
SUMMARY OF PM3 CALCULATION
MOPAC2007 (Version: 7.221W) Fri Sep 5 21:31:45 2008 No. of days left = 190
Empirical Formula: H18 O9 Eu
PM3 PRECISE NOINTER XYZ BFGS T=10D GNORM=0.25 + NOLOG GEO-OK SCFCRT=1.D-10 CHARGE=3
cation nona-aqua-europium(III)
PETERS TEST WAS SATISFIED IN BFGS OPTIMIZATION SCF FIELD WAS ACHIEVED
HEAT OF FORMATION = 323.51253 KCAL = 1353.57645 KJ TOTAL ENERGY = -2932.93411 EV
ELECTRONIC ENERGY = -14038.14466 EV CORE-CORE REPULSION = 11105.21054 EV
DIPOLE = 0.74707 DEBYE POINT GROUP: C1 NO. OF FILLED LEVELS = 36
CHARGE ON SYSTEM = 3
IONIZATION POTENTIAL = 25.094038 EV HOMO LUMO ENERGIES (EV) = -25.094 -8.938 MOLECULAR WEIGHT = 314.101
MOLECULAR DIMENSIONS (Angstroms)
Atom Atom Distance H 21 H 17 6.27726 H 24 H 25 6.21230 H 19 H 27 6.06404
SCF CALCULATIONS = 627
COMPUTATION TIME = 15.094 SECONDS
FINAL GEOMETRY OBTAINED CHARGE PM3 PRECISE NOINTER XYZ BFGS T=10D GNORM=0.25 +
NOLOG GEO-OK SCFCRT=1.D-10 CHARGE=3 cation nona-aqua-europium(III)
Freire et al. S9 Vol. 20, No. 9, 2009
O 0.13718823 +1 0.1169164 +1 -0.1659702 +1 -0.6511 O 3.21300067 +1 0.0461864 +1 0.4007516 +1 -0.6356 H -0.08932428 +1 0.9877652 +1 -0.5352742 +1 0.3577 H -0.54022369 +1 -0.5103638 +1 -0.4423260 +1 0.2683 H 3.32283437 +1 0.9994108 +1 0.6074852 +1 0.3202 H 4.01882657 +1 -0.0774508 +1 -0.1454768 +1 0.3161 H -1.12646602 +1 -0.9782210 +1 3.0416101 +1 0.3187 H -1.13852200 +1 -2.4596997 +1 2.9202422 +1 0.3165 H 0.81001136 +1 1.3875800 +1 2.3137292 +1 0.3157 H 1.70036605 +1 0.7714119 +1 3.3335148 +1 0.3164 H 2.16280332 +1 -2.4621982 +1 -2.0648355 +1 0.3582 H 1.90344393 +1 -1.0208535 +1 -1.5498264 +1 0.2641 H 0.62197075 +1 -4.7164519 +1 0.8613262 +1 0.3174 H 1.36518858 +1 -4.6375883 +1 2.1444770 +1 0.3183 H 3.89180005 +1 -3.6419587 +1 0.8812133 +1 0.3175 H 4.56190747 +1 -2.3522460 +1 1.1891585 +1 0.3144 H -1.57684495 +1 -2.4379757 +1 0.1081006 +1 0.3216 H -0.73760631 +1 -2.6441853 +1 -1.1092130 +1 0.3228 H 1.78275142 +1 -1.9464584 +1 4.3030049 +1 0.3161 H 3.10837346 +1 -2.3344788 +1 3.7529159 +1 0.3171
---End of ile Eu_9H2O.arc
---5. Additional Tables and Figures
The directly coordinating atoms of the ligands form the coordination polyhedron of the complex, whose faces are the polygonal bases of a set of adjacent pyramids that share the same apex, where the lanthanide ion is located. E a c h t w o adjacent pyramids share one triangular face, and therefore, also one side of their polygonal bases.
The average unsigned mean error for each complex i, UME
i, is deined as:
where n is the number of ligand atoms directly coordinating the lanthanide ion. Two cases have been examined: (i) UME(Ln-L)s
involving only the edges of the pyramids that have the apex as a vertice, that is, the interatomic distances Rj between the
lanthanide central ion, Ln, and the atoms of the coordination polyhedron, L, important to luminescent complex design; and (ii) UMEs of all the edges of the pyramids, that is, of the interatomic distances Rj between the lanthanide central ion and
the atoms of the coordination polyhedron, as well as all the interatomic distances R
j between all atoms of the coordination polyhedron.
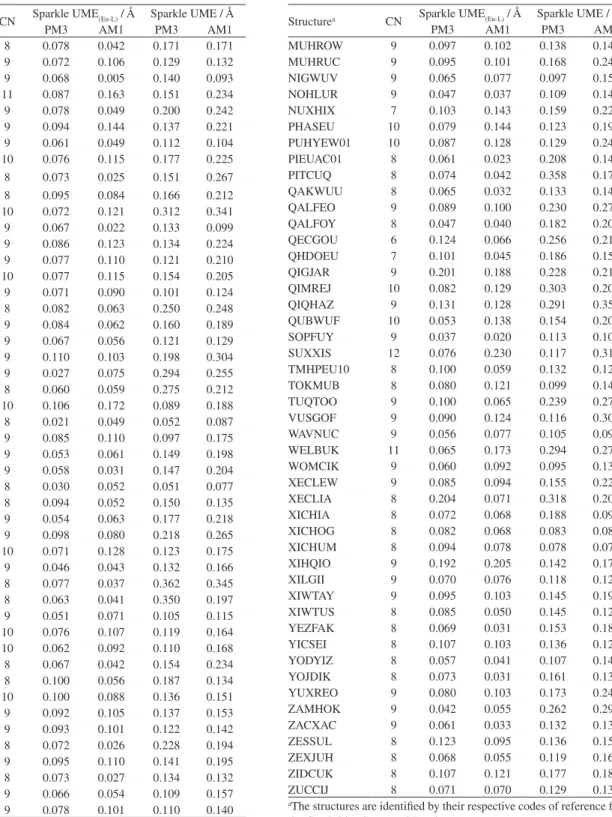
Tables S1, S2 and S3 show the Sparkle/PM3 and Sparkle/AM1 unsigned mean errors, UME(Ln-L)s and UMEs, for the 96 structures containing Eu(III), 70 structures containing Gd(III) and the 42 structures containing Tb(III) respectively.
Figures S3 to S5 present, each, a gamma distribution it of the respective UMEs for the present Sparkle/PM3 as well as for previously published Sparkle/AM1 models for europium, gadolinium and terbium.1 In all cases the respective p-values
Sparkle/PM3 for the Modeling of Europium(III) J. Braz. Chem. Soc.
S10
Table S1. Values of the coordination numbers, CNs, and unsigned mean errors, UME(Eu-L)s,and UMEs, for Sparkle/PM3 and Sparkle/AM1, as compared to
the respective experimental crystallographic values, obtained from the Cambridge Structural Database, for each of the ninety-six europium (III) complexes
Structurea CN Sparkle UME(Eu-L) / Å Sparkle UME / Å
PM3 AM1 PM3 AM1
ACPNEU 8 0.078 0.042 0.171 0.171
BAFZEO 9 0.072 0.106 0.129 0.132
BAPXAR 9 0.068 0.005 0.140 0.093
BEKWUJ 11 0.087 0.163 0.151 0.234
BUVXAR11 9 0.078 0.049 0.200 0.242
CEXKUL 9 0.094 0.144 0.137 0.221
CEXKUL01 9 0.061 0.049 0.112 0.104
CEYRON 10 0.076 0.115 0.177 0.225
CIRKET 8 0.073 0.025 0.151 0.267
COZLEI10 8 0.095 0.084 0.166 0.212
DIWNOM 10 0.072 0.121 0.312 0.341
DOFXIF 9 0.067 0.022 0.133 0.099
DOPCEQ 9 0.086 0.123 0.134 0.224
DUCNAQ 9 0.077 0.110 0.121 0.210
ECABOZ 10 0.077 0.115 0.154 0.205
EGOBEH 9 0.071 0.090 0.101 0.124
FETGUG 8 0.082 0.063 0.250 0.248
FOCQOD 9 0.084 0.062 0.160 0.189
FOCQUJ 9 0.067 0.056 0.121 0.129
FOCREU 9 0.110 0.103 0.198 0.304
FUXPOD 9 0.027 0.075 0.294 0.255
FUZZOP 8 0.060 0.059 0.275 0.212
GACJOJ 10 0.106 0.172 0.089 0.188
GAPRUK 8 0.021 0.049 0.052 0.087
GEBYAN 9 0.085 0.110 0.097 0.175
GINPIC 9 0.053 0.061 0.149 0.198
HANBIH 9 0.058 0.031 0.147 0.204
HAZGAQ 8 0.030 0.052 0.051 0.077
JAXXOV 8 0.094 0.052 0.150 0.135
JUCZIQ 9 0.054 0.063 0.177 0.218
JUDBOZ 9 0.098 0.080 0.218 0.265
JUGBUI 10 0.071 0.128 0.123 0.175
KAFDOK 9 0.046 0.043 0.132 0.166
KAKPAN 8 0.077 0.037 0.362 0.345
KELNOE 8 0.063 0.041 0.350 0.197
KIFKOZ02 9 0.051 0.071 0.105 0.115
KIHSEZ 10 0.076 0.107 0.119 0.164
LAPJAN 10 0.062 0.092 0.110 0.168
LEJTAV 8 0.067 0.042 0.154 0.234
LELRUP 8 0.100 0.056 0.187 0.134
LOWBEE 10 0.100 0.088 0.136 0.151
LUHFUP 9 0.092 0.105 0.137 0.153
LUHGAW 9 0.093 0.101 0.122 0.142
MASKAS 8 0.072 0.026 0.228 0.194
MEBDUS 9 0.095 0.110 0.141 0.195
MIHNOG 8 0.073 0.027 0.134 0.132
MIHPOI 9 0.066 0.054 0.109 0.157
MOYJUF 9 0.078 0.101 0.110 0.140
Structurea CN Sparkle UME(Eu-L) / Å Sparkle UME / Å
PM3 AM1 PM3 AM1
MUHROW 9 0.097 0.102 0.138 0.141
MUHRUC 9 0.095 0.101 0.168 0.240
NIGWUV 9 0.065 0.077 0.097 0.156
NOHLUR 9 0.047 0.037 0.109 0.145
NUXHIX 7 0.103 0.143 0.159 0.225
PHASEU 10 0.079 0.144 0.123 0.199
PUHYEW01 10 0.087 0.128 0.129 0.245
PIEUAC01 8 0.061 0.023 0.208 0.144
PITCUQ 8 0.074 0.042 0.358 0.174
QAKWUU 8 0.065 0.032 0.133 0.145
QALFEO 9 0.089 0.100 0.230 0.276
QALFOY 8 0.047 0.040 0.182 0.208
QECGOU 6 0.124 0.066 0.256 0.211
QHDOEU 7 0.101 0.045 0.186 0.152
QIGJAR 9 0.201 0.188 0.228 0.215
QIMREJ 10 0.082 0.129 0.303 0.202
QIQHAZ 9 0.131 0.128 0.291 0.350
QUBWUF 10 0.053 0.138 0.154 0.205
SOPFUY 9 0.037 0.020 0.113 0.102
SUXXIS 12 0.076 0.230 0.117 0.313
TMHPEU10 8 0.100 0.059 0.132 0.127
TOKMUB 8 0.080 0.121 0.099 0.142
TUQTOO 9 0.100 0.065 0.239 0.274
VUSGOF 9 0.090 0.124 0.116 0.307
WAVNUC 9 0.056 0.077 0.105 0.094
WELBUK 11 0.065 0.173 0.294 0.274
WOMCIK 9 0.060 0.092 0.095 0.133
XECLEW 9 0.085 0.094 0.155 0.226
XECLIA 8 0.204 0.071 0.318 0.209
XICHIA 8 0.072 0.068 0.188 0.098
XICHOG 8 0.082 0.068 0.083 0.085
XICHUM 8 0.094 0.078 0.078 0.077
XIHQIO 9 0.192 0.205 0.142 0.171
XILGII 9 0.070 0.076 0.118 0.123
XIWTAY 9 0.095 0.103 0.145 0.199
XIWTUS 8 0.085 0.050 0.145 0.120
YEZFAK 8 0.069 0.031 0.153 0.186
YICSEI 8 0.107 0.103 0.136 0.122
YODYIZ 8 0.057 0.041 0.107 0.149
YOJDIK 8 0.073 0.031 0.161 0.131
YUXREO 9 0.080 0.103 0.173 0.245
ZAMHOK 9 0.042 0.055 0.262 0.291
ZACXAC 9 0.061 0.033 0.132 0.132
ZESSUL 8 0.123 0.095 0.136 0.159
ZEXJUH 8 0.068 0.055 0.119 0.161
ZIDCUK 8 0.107 0.121 0.177 0.184
ZUCCIJ 8 0.071 0.070 0.129 0.133
Freire et al. S11 Vol. 20, No. 9, 2009
Table S2. Values of the coordination numbers, CNs, and unsigned mean errors, UME(Gd-L)s,and UMEs, for Sparkle/PM3 and Sparkle/AM1, as compared to
the respective experimental crystallographic values, obtained from the Cambridge Structural Database, for each of the seventy gadolinium (III) complexes
Structurea CN Sparkle UME(Eu-L) / Å Sparkle UME / Å
PM3 AM1 PM3 AM1
ACAQGD 9 0.081 0.085 0.113 0.156
ADUPEU 7 0.153 0.116 0.092 0.088
BIFZEV 9 0.043 0.034 0.302 0.290
BUVVOD 9 0.068 0.061 0.169 0.283
BUVVOD01 9 0.065 0.058 0.081 0.277
COSTAF 9 0.130 0.136 0.288 0.462
CULNIG10 7 0.100 0.097 0.196 0.236
DIQBIO 10 0.104 0.093 0.182 0.186
DIYNEE 8 0.030 0.024 0.219 0.230
DUFBEL 8 0.030 0.026 0.110 0.156
EHAXEQ 8 0.073 0.062 0.103 0.099
FONMEA 8 0.062 0.057 0.124 0.154
FUHQUU 9 0.035 0.029 0.090 0.096
FUXPUJ 9 0.024 0.026 0.131 0.258
GAKYAS 8 0.033 0.026 0.194 0.227
GAWBEL 8 0.024 0.030 0.083 0.097
GEGCIE 9 0.046 0.038 0.069 0.066
GIDQUF 8 0.072 0.037 0.103 0.066
GINPOI 9 0.051 0.057 0.096 0.285
GIRKUN 9 0.089 0.101 0.103 0.352
GODMER 10 0.095 0.101 0.148 0.236
HEDMIM 9 0.061 0.067 0.120 0.198
JARBUZ 9 0.068 0.078 0.138 0.153
JOPJIH 9 0.061 0.063 0.100 0.142
JOPJIH01 9 0.042 0.040 0.066 0.090
LANITB 9 0.056 0.071 0.256 0.310
LASZOU 9 0.028 0.027 0.110 0.094
LASZIO 9 0.191 0.246 0.283 0.463
LEJVEB 8 0.035 0.025 0.156 0.254
LOKNEE 9 0.057 0.056 0.127 0.135
LOQKEH 9 0.055 0.039 0.077 0.092
MIPTOU 7 0.140 0.103 0.068 0.063
NAVWIQ 9 0.090 0.104 0.135 0.185
NIGHEQ 10 0.055 0.039 0.100 0.061
NIGXAC 9 0.070 0.056 0.099 0.105
NIVQEO 8 0.053 0.048 0.123 0.141
Structurea CN Sparkle UME(Eu-L) / Å Sparkle UME / Å
PM3 AM1 PM3 AM1
PADEGA10 10 0.054 0.077 0.099 0.120
PALHAL 8 0.131 0.109 0.140 0.126
PEBDOP 9 0.050 0.042 0.246 0.229
PROPGD 8 0.060 0.062 0.137 0.197
PUZHUN 10 0.074 0.094 0.106 0.134
SERYOD 8 0.053 0.068 0.101 0.301
TUFLUB 9 0.051 0.048 0.168 0.241
UDOMIJ 9 0.049 0.040 0.179 0.097
UDOMOP 9 0.043 0.043 0.118 0.096
VEDSEC 10 0.077 0.060 0.112 0.089
VETDON 9 0.047 0.039 0.096 0.094
VIGBOC 9 0.053 0.046 0.073 0.086
WALQAB 9 0.038 0.032 0.081 0.093
WAVPAK 9 0.052 0.068 0.218 0.140
WAXCIH 9 0.084 0.067 0.125 0.155
WEWNOB 6 0.050 0.017 0.084 0.051
WIRTUM 5 0.086 0.094 0.111 0.127
WUCCOM 9 0.084 0.069 0.180 0.158
XIVFOX 8 0.069 0.031 0.135 0.018
XUBGUW 10 0.057 0.073 0.094 0.096
YAVSUJ 9 0.079 0.087 0.149 0.344
YEGTOT 8 0.007 0.005 0.081 0.093
YEWGEM 8 0.089 0.082 0.110 0.136
YIYLAT 9 0.038 0.053 0.093 0.122
YOVFIY01 9 0.034 0.027 0.102 0.109
YUWZOF 6 0.028 0.044 0.177 0.185
ZAXQAQ 8 0.033 0.034 0.136 0.224
ZAZQEW 8 0.007 0.006 0.065 0.086
ZENGUU 6 0.101 0.119 0.136 0.157
ZIPJIR 9 0.043 0.036 0.122 0.146
ZIZNUR 8 0.055 0.051 0.147 0.150
ZUNCAM 8 0.112 0.097 0.103 0.110
ZZZARA01 9 0.063 0.055 0.174 0.265
Sparkle/PM3 for the Modeling of Europium(III) J. Braz. Chem. Soc.
S12
Figure S1. Probability densities of the Gamma distribution its of the UMEs
for the Eu(III) Sparkle/PM3 and Sparkle/AM1 models, superimposed to histograms of the same data for all 96 Eu(III) complexes considered; where k is the shape parameter and θ is the scale parameter of the gamma distribution; p-value is a measure of the signiicance of the gamma distribution it; and mean is the expected value of the itted gamma distribution, which is set to be equal to the arithmetic mean value of the 96 UMEs.
Table S3. Values of the coordination numbers, CNs, and unsigned mean
errors, UME(Tb-L)sand UMEs, for Sparkle/PM3 and Sparkle/AM1, as compared to the respective experimental crystallographic values, obtained from the Cambridge Structural Database, for each of the forty-two terbium (III) complexes
Structurea CN Sparkle UME(Eu-L) / Å Sparkle UME / Å
PM3 AM1 PM3 AM1
BACBUC 9 0.130 0.156 0.187 0.234
BAFWUB 9 0.040 0.035 0.110 0.138
BAFZOY 9 0.079 0.096 0.132 0.127
BUVXEV01 9 0.070 0.051 0.171 0.206
COSVOV 9 0.130 0.134 0.140 0.370
CULSEH 8 0.052 0.053 0.129 0.118
DIFHEF 8 0.062 0.034 0.100 0.092
DUCQEX 9 0.070 0.085 0.129 0.166
FAGZAP 8 0.044 0.029 0.196 0.250
FOPPUV 9 0.053 0.046 0.146 0.155
HANBUT 9 0.027 0.030 0.130 0.180
IDOZEG 9 0.088 0.100 0.128 0.139
JAXWOU01 8 0.093 0.116 0.186 0.241
JAXWOU 9 0.077 0.097 0.199 0.246
JEXWOY 9 0.031 0.034 0.112 0.117
KITGAV 9 0.032 0.021 0.140 0.219
KUYBEL 9 0.025 0.050 0.230 0.245
LEJTEZ 8 0.031 0.038 0.178 0.180
LEYHOM 9 0.028 0.074 0.177 0.244
LIFJEP 10 0.070 0.092 0.125 0.147
MIHNUM 8 0.060 0.027 0.121 0.137
MIHPIC 8 0.056 0.028 0.121 0.137
MIWTAN 10 0.078 0.083 0.115 0.150
NASTUW 10 0.076 0.097 0.108 0.135
NAXRAF 10 0.099 0.102 0.141 0.143
NIGYUX 9 0.065 0.063 0.105 0.136
PAGBOO 4 0.059 0.043 0.071 0.055
PEJZAF 8 0.027 0.023 0.189 0.163
QALFUE 8 0.029 0.029 0.194 0.162
QAWHIF 8 0.065 0.049 0.081 0.079
SEGVEF 8 0.020 0.018 0.089 0.058
TOKVIY 9 0.095 0.123 0.117 0.173
VAPTEL01 6 0.154 0.120 0.212 0.181
VAPTEL 6 0.165 0.131 0.227 0.166
XARXET 8 0.055 0.059 0.270 0.228
XAXXUP 7 0.092 0.064 0.167 0.176
XEXJIT 7 0.118 0.084 0.111 0.103
XOCDIC 8 0.070 0.084 0.152 0.202
XORGAM 8 0.061 0.052 0.434 0.292
XUGBUW 7 0.092 0.074 0.161 0.183
ZUNCEQ 8 0.107 0.096 0.115 0.124
ZZZARD01 9 0.068 0.051 0.173 0.244
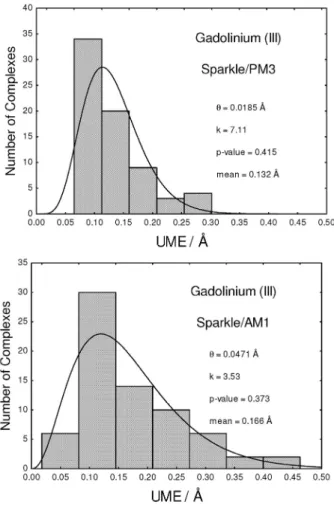
Figure S2. Probability densities of the Gamma distribution its of the UMEs for the Gd(III) Sparkle/PM3 and Sparkle/AM1 models, superimposed to histograms of the same data for all 70 Gd(III) complexes considered; where k is the shape parameter and θ is the scale parameter of the gamma distribution; p-value is a measure of the signiicance of the gamma distribution it; and mean is the expected value of the itted gamma distribution, which is set to be equal to the arithmetic mean value of the 70 UMEs.
Figure S3. Probability densities of the Gamma distribution its of the UMEs
for the Tb(III) Sparkle/PM3 and Sparkle/AM1 models, uperimposed to histograms of the same data for all 42 Tb(III) complexes considered; where k is the shape parameter and θ is the scale parameter of the gamma distribution; p-value is a measure of the signiicance of the gamma distribution it; and mean is the expected value of the itted gamma distribution, which is set to be equal to the arithmetic mean value of the 42 UMEs.