Qualidade de vida em indivíduos com gagueira
desenvolvimental persistente*****
Quality of life of individuals with persistent developmental stuttering
*Fonoaudióloga. Professora Titular do Departamento de Fisioterapia, Fonoaudiologia e Terapia Ocupacional da Faculdade de Medicina da Universidade de São Paulo. Endereço para correspondência:
Rua Cipotanea, 51 São Paulo SP -CEP 05360-160
**Fonoaudióloga. Doutora em Ciências pela Faculdade de Medicina da Universidade de São Paulo. Fonoaudióloga do Departamento de Fisioterapia, Fonoaudiologia e Terapia Ocupacional da Faculdade de Medicina da Universidade de São Paulo.
***Fonoaudióloga. Pós-Doutoranda em Ciências pela Faculdade de Medicina da Universidade de São Paulo.
****Fonoaudióloga. Especialização em Motricidade e Funções Orofaciais pelo Curso de Fonoaudiologia da Faculdade de Medicina da Universidade de São Paulo. Fonoaudióloga da Prefeitura de São Bernardo do Campo - São Paulo.
*****Trabalho Realizado no Departamento de Fonoaudiologia, Fisioterapia e Terapia Ocupacional da Faculdade de Medicina da Universidade de São Paulo.
Artigo Original de Pesquisa
Artigo Submetido a Avaliação por Pares
Conflito de Interesse: não
Recebido em 25.05.2008. Revisado em 10.10.2008.
Aceito para Publicação em 29.10.2008.
Claudia Regina Furquim de Andrade*
Fernanda Chiarion Sassi**
Fabiola Staróbole Juste***
Beatriz Ercolin****
Abstract
Background: quality of life. Aim: to verify the influence of the readiness of speech - regarding affective, behavioral and cognitive reactions - over the life quality of fluent individuals and those with persistent developmental stuttering (PDS). Method: 40 adults divided in two groups, paired by gender and age. The research group (GI) consisted of 20 individuals with PDS, with no other associated deficit. The research group (GII) consisted of 20 fluent individuals. All of the participants answered a Self-Assessment Protocol - version for adults. This protocol is composed by three thematic sessions, each one presenting five questions. Each question should be answered by choosing a number on a scale that varies from 1 (completely disagree) to 7 (completely agree). The first session corresponds to the affective reactions, the second to the behavioral reactions and the third to the cognitive reactions. All of the participants answered all of the 15 questions. Results: the findings indicate that a difference in the perception of speech and speech fluency exists between fluent individuals and individuals with PDS. For the individuals with PDS, the different stuttering severity levels did not present divergent points; on the contrary, even the individuals with mild PDS presented the same affective, behavioral and cognitive profiles of those with a more severe stuttering. Conclusion: the results indicate that the experience with stuttering is different among the individuals in terms of the observable speech characteristics, functional communication difficulties experienced by the individual in everyday situations, having a negative impact in the quality of life.
Key Words: Quality of Life; Stuttering; Methods.
Resumo
Tema: qualidade de vida. Objetivo: conhecer a influência da habilidade de fala - quanto as reações afetivas, comportamentais e cognitivas - sobre a qualidade de vida de indivíduos fluentes e com gagueira persistente do desenvolvimento (GPD). Método: 40 indivíduos adultos divididos em dois grupos, pareados por gênero e idade. O grupo de pesquisa (GI) foi composto por 20 indivíduos com PDS, sem qualquer outro déficit associado. O grupo controle (GII) foi composto por 20 indivíduos fluentes. Todos os participantes responderam ao Protocolo de Auto-Avaliação - versão para adultos. O protocolo é composto por três sessões de temáticas, cada uma delas com cinco questões, sendo que cada pergunta pode ser respondida numa escala de 1 (discordo plenamente) a 7 (concordo plenamente). A primeira sessão corresponde aos componentes afetivos, a segunda aos componentes comportamentais e a terceira aos componentes cognitivos. Todos os participantes responderam a todas as 15 questões. Resultados: os achados indicaram que existe diferença na percepção da fala e da fluência entre indivíduos fluentes e com PDS. No grupo de indivíduos com PDS os diferentes graus de gravidade da patologia não identificaram pontos de divergência, ao contrário, mesmo os indivíduos com PDS leve apresentaram o mesmo perfil afetivo, comportamental e cognitivo que os indivíduos com maior comprometimento da fluência da fala. Conclusão: pelos resultados do estudo foi observado que a experiência com a gagueira diferencia os indivíduos em termos das características observáveis de fala, das dificuldades funcionais de comunicação vivida pelo falante no seu dia a dia gerando impacto negativo na qualidade de vida do indivíduo.
Palavras-Chave: Qualidade de Vida; Gagueira; Métodos.
Referenciar este material como:
Introduction
In the last two decades there has been a
growing discussion about the importance of
evidence-based practice in the field of the
Speech-Language and Hearing Sciences. The need for
clinicians to document the results of their
intervention has been particularly apparent in the
field of fluency disorders (1-7).
One of the central tenets of an evidence-based
approach is the measurement and evaluation of
treatment outcomes. In fluency disorders numerous
studies have documented the effects of existing
treatments on factors such as clinician-rated
frequency of speech disruptions, speech
naturalness, and speaking rate (8-10). Results from
these studies have clearly demonstrated that
treatment can effectively minimize these observable
symptoms of the disorder.
However, a few authors have been discussing
a few aspects of stuttering other than those that
can be objectively measured (6-7,11-14). These
authors point that stuttering can affect an
individual's life, in the sense that this individual
can, over time, develop feelings of shame and guilt
associated to his/hers speech performance. In this
sense, researches that investigate the
self-assessment and self-perception of individuals with
stuttering are of great importance.
Several studies have focused primarily on the
impact stuttering has over the quality of life of those
who stutter, focusing on the social and professional
negative experiences, as well as on the negative
emotions associated to the ability to speak and
communicate (6-8).
Quality of life is the perception of individuals
of their positions in life in the culture and value
system in which they live, relative to their goals,
expectations, standards and concerns (15-21).
To describe stuttering based on the point of
view of those who stutterer, broadens the knowledge
about the possible negative effects that the
involuntary speech disruptions have over the life
of these individuals.
The purpose of this research is to investigate
the influence of the ability to speak - regarding
affective, behavioral and cognitive reactions - over
the quality of life of fluent individuals and those
with persistent developmental stuttering.
Method
The selection and assessment procedures of
the participants only began after the pertinent
ethical procedures: approval by the Ethics
Committee (CAPPesq HCFMUSP0823/07) and
informed signed consent of all of the participants.
The research did not involve any invasive or
experimental technique, characterizing the research
as a no risk study.
Participants
Participants of this study were 40 adults (ages
above 18 years; mean age of 34.5 years), of both
genders (20 females and 20 males), divided in two
groups paired by age and gender.
The research group (GI) consisted of 20
individuals with persistent developmental
stuttering (PDS), with no other associated
communicative, neurologic or cognitive deficit.
Stuttering was diagnosed according to the following
criteria:
. fluency profile scores outside the reference values
for age (22);
. 11 points or more (a stuttering severity of at least
"mild") on the Stuttering Severity Instrument - 3
(SSI-3) (23). Participants of this group were
sub-divided according to their severity of stuttering: 5
mild; 5 moderate; 5 severe and 5 very severe.
The control group (GII) consisted of 20 fluent
individuals, with no stuttering complaints and with
no communicative, neurologic and cognitive
deficits. The inclusion criteria of the participants of
GII were:
. fluency profile scores within the reference values
for age (22);
. 10 points (severity equivalent to "very mild") or
less in the SSI-3 (23);
. no family history of recuperated or persistent
stuttering.
Procedures
In order to obtain the research data, the
participants individually filled in a Self-Assessment
Protocol (which can also be used to assess the
functional results of stuttering treatment) - Version
for Adults (24).
reactions and the third is related to the cognitive
reactions. All of the participants answered all of
the 15 questions.
Results
The obtained data were statistically treated
using the Test of Equal Proportions. This is a
non-parametric test and compares the proportion of
answers of two determined variables and/or their
levels, indicating their statistical significance. The
adopted level of significance was of p=0.05, with
all intervals at 95% of statistical confidence.
Although the classification of the answers varied
in seven points, it was decided for this analysis
that the intermediate values corresponded to very
close concepts and for this reason the 3 points that
corresponded to answers of disagreement were
grouped together. The neutral point was maintained
and the other 3 points that corresponded to
answers of agreement were also grouped together.
Thus, for statistical purposes, each question had 3
possible answers (1/disagree; 2/neutral; 3/agree).
In the inter-group comparison, the results
consistently indicate that a significant statistical
difference exists between the groups for the answers
1 and 3, were Answers 1 (disagree) occur more
frequently (<0.001 to 0.037) in GI and Answers 3
(agree) occur more frequently (<0.001 to 0.037) in
group GII. These differences are consistent for all
of the reactions: affective, behavioral and cognitive
(except for the cognitive reaction in question E,
related to the need for therapy). It is important to
highlight that the individuals with PDS have doubts
about the effectiveness of treatment for stuttering.
The comparison between the different
stuttering severity levels of the individuals with
PDS is described in the tables below:
The statistically significant results were:
Affective Reactions (Table 1):
. question A: difference between moderate and very
severe (0.003) - like less to communicate;
. question B: difference for all, worse for the mild
(0.003 to <0.001) - all feel discomfort to
communicate;
. question C: difference for mild and moderate (0.012
to <0.001) - don't like the sound of their own voice;
. question D: difference for all, worse for the mild
(0.041 to <0.001) - do not control speech in difficult
situations;
. question E: difference for all (<0.001) - are not
satisfied with their own fluency.
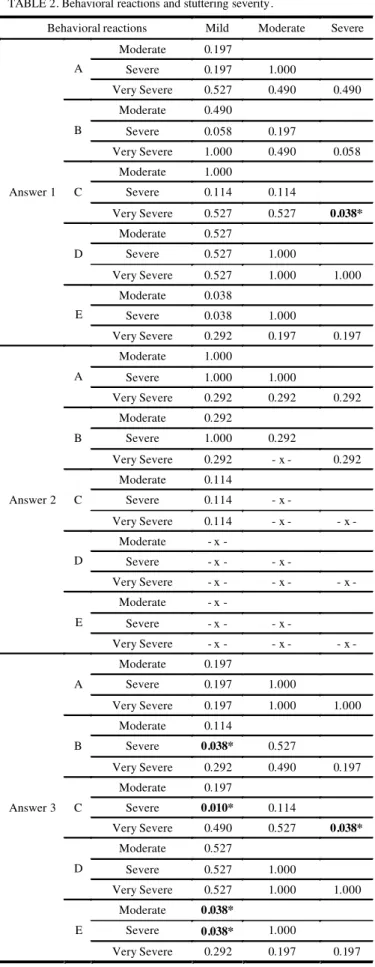
Behavioral Reactions (Table 2):
. question A: difference for all with the expection of
the mild (0.012) - avoid communication situations;
. question B: difference for all (<0.001) - all avoid
words;
. question C: difference for all, worse for the very
severe (0.003 to <0.001) - to not observe fluency in
their speech;
. question D: difference for all (0.031 to 0.003) - use
strategies to improve speech fluency;
. question E: difference for all (0.031 to <0.001)
-observe physical concomitants.
Cognitive Reactions (Table 3):
. question A: difference for all (<0.001) - agree that
they need therapy;
. question B: difference for all (<0.001) - agree that
their speech affects negatively their professional
success;
. question C: difference for all (<0.001) - agree that
their speech affects negatively their social success;
. question D: difference for all (<0.001) - do not
understand their speech problem;
TABLE 1. Affective reactions and stuttering severity.
Affective reactions Mild Moderate Severe Moderate 0.114
Severe - x - 0.114
A
Very Severe 0.114 1.000 0.114 Moderate 0.490
Severe 0.197 0.527
B
Very Severe 0.490 1.000 0.527 Moderate 0.114
Severe 0.038* 0.002*
C
Very Severe 0.527 0.038* 0.114 Moderate 0.197
Severe 0.197 1.000
D
Very Severe 0.197 1.000 1.000 Moderate 0.292
Severe 1.000 0.292
Answer 1
E
Very Severe 1.000 0.292 1.000 Moderate 1.000
Severe 0.292 0.292
A
Very Severe 0.292 0.292 - x - Moderate - x -
Severe 0.292 0.292
B
Very Severe - x - - x - 0.292 Moderate - x -
Severe - x - - x - C
Very Severe 0.292 0.292 0.292 Moderate - x -
Severe - x - - x - D
Very Severe - x - - x - - x - Moderate - x -
Severe - x - - x - Answer 2
E
Very Severe - x - - x - - x - Moderate 0.197
Severe 0.292 0.038*
A
Very Severe 0.490 0.527 0.114 Moderate 0.490
Severe 0.490 1.000
B
Very Severe 0.490 1.000 1.000 Moderate 0.114
Severe 0.038* 0.002*
C
Very Severe 1.000 0.114 0.038*
Moderate 0.197
Severe 0.197 1.000
D
Very Severe 0.197 1.000 1.000 Moderate 0.292
Severe 1.000 0.292
Answer 3
E
TABLE 2. Behavioral reactions and stuttering severity.
Behavioral reactions Mild Moderate Severe Moderate 0.197
Severe 0.197 1.000
A
Very Severe 0.527 0.490 0.490 Moderate 0.490
Severe 0.058 0.197
B
Very Severe 1.000 0.490 0.058 Moderate 1.000
Severe 0.114 0.114
C
Very Severe 0.527 0.527 0.038*
Moderate 0.527
Severe 0.527 1.000
D
Very Severe 0.527 1.000 1.000 Moderate 0.038
Severe 0.038 1.000
Answer 1
E
Very Severe 0.292 0.197 0.197 Moderate 1.000
Severe 1.000 1.000
A
Very Severe 0.292 0.292 0.292 Moderate 0.292
Severe 1.000 0.292
B
Very Severe 0.292 - x - 0.292 Moderate 0.114
Severe 0.114 - x - C
Very Severe 0.114 - x - - x - Moderate - x -
Severe - x - - x - D
Very Severe - x - - x - - x - Moderate - x -
Severe - x - - x - Answer 2
E
Very Severe - x - - x - - x - Moderate 0.197
Severe 0.197 1.000
A
Very Severe 0.197 1.000 1.000 Moderate 0.114
Severe 0.038* 0.527 B
Very Severe 0.292 0.490 0.197 Moderate 0.197
Severe 0.010* 0.114 C
Very Severe 0.490 0.527 0.038*
Moderate 0.527
Severe 0.527 1.000
D
Very Severe 0.527 1.000 1.000 Moderate 0.038*
Severe 0.038* 1.000 Answer 3
E
TABLE 3. Cognitive reactions and stuttering severity
Cognitive reactions Mild Moderate Severe Moderate 0.197
Severe 0.038* 0.292 A
Very Severe 0.038* 0.292 - x - Moderate - x -
Severe 0.292 0.292
B
Very Severe 0.292 0.292 1.000 Moderate 0.292
Severe 0.292 1.000
C
Very Severe - x - 0.292 0.292 Moderate 1.000
Severe 0.527 0.527
D
Very Severe 0.490 0.490 0.197 Moderate 1.000
Severe 0.292 0.292
Answer 1
E
Very Severe 0.292 0.292 - x - Moderate 0.292
Severe 0.292 - x - A
Very Severe 0.292 - x - - x - Moderate - x -
Severe - x - - x - B
Very Severe - x - - x - - x - Moderate 0.292
Severe - x - 0.292
C
Very Severe - x - 0.292 - x - Moderate 0.292
Severe - x - 0.292
D
Very Severe 0.292 1.000 0.292 Moderate 0.292
Severe 1.000 0.292
Answer 2
E
Very Severe 1.000 0.292 1.000 Moderate 0.490
Severe 0.114 0.292
A
Very Severe 0.114 0.292 - x - Moderate - x -
Severe 0.292 0.292
B
Very Severe 0.292 0.292 1.000 Moderate - x -
Severe 0.292 0.292
C
Very Severe - x - - x - 0.292 Moderate 0.490
Severe 0.527 0.197
D
Very Severe 0.114 0.292 0.038*
Moderate 0.490
Severe 0.490 1.000
Answer 3
E
Discussion
The results of the present study indicate that
there is a difference in the perception of speech
and speech fluency between fluent individuals and
those with PDS. For the group of individuals with
PDS, the different severity levels of the pathology
did not identify divergent points; on the contrary,
even individuals with mild PDS present affective,
behavioral and cognitive reactions similar to those
with a more severe stuttering problem.
As pointed in the consulted literature, although
many people who stutter have written about their
personal experiences of stuttering, very little
systematic research appears to have been
conducted regarding the perceived impact of this
communication disability on quality of life (25-26).
Findings of the present study agree with those
pointed in the literature, indicating that the
experience of stuttering for the person who stutters
may include negative affective, behavioral, and
cognitive reactions and may also involve
significant limitations in the individual's ability to
participate in daily activities and a negative effect
on the person's overall quality of life (6-7,25).
A few authors believe that severe
communication disabilities are likely to exert a
negative impact on the quality of life as they cause
frustration for those individuals who experience
them. The enjoyment of many of life's activities can
be severely restricted when people attend to the
manner of speaking more than the message it
carries, which may be the cause of stuttering
(6-7,25). Consequently, communication disorders such
as stuttering, are likely to exert profound influence
on the person at all stages of the life cycle; for
example during the school-age, studies have shown
that children who stutter tend to perform below
average when compared to their fluent pairs (13).
Conclusion
Through the results of the present study, it was
possible to observe that the experience with
stuttering differentiates individuals in terms of the
observable speech characteristics and in terms of
the functional communication difficulties
experienced daily, thus having a negative impact
on the individual's overall quality of life.
References
1. Thomas C, Howell P. Assessing efficacy of stuttering treatments. Journal of Fluency Disorders. 2001;26:311-33.
2. Bothe AK. Evidence-based treatment of stuttering: V. The art of clinical practice and the future of clinical research. Journal of Fluency Disorders. 2003;28:247-58. 3. Finn P. Evidence-based treatment of stuttering: II. Clinical significance of behavioral stuttering treatments. Journal of Fluency Disorders. 2003;28:209-18.
4. Ingham JC Evidence-based treatment of stuttering: I. Definition and application. Journal of Fluency Disorders. 2003;28:197-208.
5. Onslow M. Evidence-based treatment of stuttering: IV. Empowerment through evidence-based treatment practices. Journal of Fluency Disorders. 2003;28:237-46.
6. Yaruss JS, Quesal RW. Stuttering and the International Classification of Functioning, disability, and health (ICF): an update. Journal of Communication Disorders. 2004;37:35-52.
7. Yaruss JS, Quesal RW. Overall assessment of the speaker´s experience of Stuttering (OASES): documenting multiple outcomes in stuttering treatment. Journal of Fluency Disorders. 2006;31:90-115.
8. Onslow M, Costa L, Andrews, C, Harrison, E. Speech outcomes of a prolonged-speech treatment for stuttering. Journal of Speech and Hearing Research. 1996;39:734-49. 9. Schiavetti N, Metz, DE. Stuttering and the measurement of speech naturalness. In R. F. Curlee & G. M. Siegel (Eds.), Nature and treatment of stuttering: New directions. Boston: Allyn & Bacon; 1997. p. 398-412.
10. Andrade CRF de. Protocolo para avaliação da fluência da fala. Pró-Fono. 2000;12(2):131-4.
11. Starkweather CW. Issues in the efficacy of treatment for fluency disorders. Journal of Fluency Disorders. 1993;18:151-68.
12. St. Louis KO. Living with stuttering. Morgantown, WV: Populore Publishing Company; 2001.
15.Carroll REO, Smith K, Couston N, Cossar JA, Hayes PC. A comparison of the WHOQOL-100 and the WHOQOL-bref in detecting change in quality of life following liver transplantation. Quality of life research. 2000;9:121-4.
16. Glatzer W. Quality of life in the Europian Union and the United States of America: evidence from comprehensive indices. Applied research in quality of life. 2006;1:169-88. 17. Kober R, Eggleton IRC. Using quality of life to assess performance in the disability services sector. Applied research in quality of life. 2006;1:63-77.
18. Michalos AC, Sirg MJ, Estes RJ. Introducing the Official Journal of he International Society for quality of life studies: applied research in quality of life (ARQOL). Applied research in quality of life. 2006;1:1-3.
19. Ferris AL. Atheory of social structure and quality of life. Applied research in quality of life. 2006;1:117-23. 20. Ciconelli RM, Soarez PC, Kowalski CCG, Ferraz MB. The Brazilian Portuguese version of the work productivity and activity impairment - general health (WPAI_GH) questionnaire. São Paulo Medical Journal. 2006;124(6):325-32.
21. Flect MPA, et al. Aplicação da versão em português do instrumento abreviado de avaliação da qualidade de vida WHOOQOL-bref. Journal of Public Health. 2000;34(2):178-83.
22. Andrade CRF de. Perfil da fluência da fala:parâmetros comparativos diferenciado por idade para crianças, adolescentes, adultos e idosos. Série livros digitais de pesquisa financiados por agências de fomento. Barueri: Pró-Fono; 2006.
23. Riley G.D. A Stuttering Severity Instrument for children and adults. Austin, Pro-Ed; 1994. p. 21.
24. Campanatti-Ostiz H, Andrade CRF de. Gagueira: Manutenção, generalização e transferência. Pró-Fono. 2000;12(2):121-30.
25. O'Keefe, B. M. Communication disorders. In R. Renwick, Brown I, Nagler M. (eds.), Quality of life in health promotion and rehabilitation. London: Sage Publications; 2006. p. 219-36.