Tuberculosis as a marker of inequities in
the context of socio-spatial transformation
Alexandre San PedroI, Gerusa GibsonII, Jefferson Pereira Caldas dos SantosI, Luciano Medeiros deToledoI, Paulo Chagastelles SabrozaI, Rosely Magalhães de OliveiraI
I Departamento de Endemias Samuel Pessoa. Escola Nacional de Saúde Pública. Fundação Oswaldo Cruz. Rio de Janeiro, RJ, Brasil
II Instituto de Estudos em Saúde Coletiva. Universidade Federal do Rio de Janeiro. Rio de Janeiro, RJ, Brasil
ABSTRACT
OBJECTIVE: his study aims to analyze the association between the incidence of tuberculosis and diferent socioeconomic indicators in a territory of intense transformation of the urban space. METHODS: his is an ecological study, whose analysis units were the neighborhoods of the city of Itaboraí, state of Rio de Janeiro, Brazil. he data have been analyzed by generalized linear models. he response variable was incidence of tuberculosis from 2006 to 2011. he independent variables were the socio-demographic indicators. he spatial distribution of tuberculosis was analyzed with the elaboration of thematic maps.
RESULTS: he results have shown a signiicant association between the incidence of tuberculosis and variables that relect diferent dimensions of living conditions, such as consumer goods, housing conditions and its surroundings, agglomeration of population, and income distribution. CONCLUSIONS: he disproportionate incidence of tuberculosis in populations with worse living conditions highlights the persistence of socioeconomic determinants in the reproduction of the disease. Diferent municipal public sectors need to better articulate with local tuberculosis control programs to reduce the social burden of the disease.
DESCRIPTORS: Tuberculosis, epidemiology. Socioeconomic Factors. Health Inequalities. Social Inequity. Ecological Studies.
Correspondence: Alexandre San Pedro Rua Leopoldo Bulhões, 1480 Manguinhos
21041-210 Rio de Janeiro, RJ, Brasil E-mail: [email protected]
Received: 6 Jul 2015 Approved: 11 Dec 2015
How to cite: San Pedro A, Gibson G, Santos JPC, Toledo LM, Sabroza PC, Oliveira RM. Tuberculosis as a marker of inequities in the context of socio-spatial transformation. Rev Saude Publica. 2017;51:9.
Copyright: This is an open-access article distributed under the terms of the Creative Commons Attribution License, which permits unrestricted use, distribution, and reproduction in any medium, provided that the original author and source are credited.
INTRODUCTION
Among the individual and contextual determinants related to tuberculosis, socioeconomic conditions are seen as important factors associated with the reproduction of the disease4,9,12,15,18. Tuberculosis operates as a marker of social inequities in health linked to
precarious living conditions. hat is why the World Health Organization has listed the reduction of the socioeconomic burden of the disease as one of the most important goals to be achieved until 2015a.
However, the focus of programmatic activities that are predominantly ixated on the identification and timely treatment of cases, as well as the lack of dialog with other government sectors, limits the scope of municipal control programs for the reduction of the social burden of the disease. Such a situation can be exacerbated in territories undergoing an important process of transformation of urban space induced by the implementation of major economic development projects. he expectation of increased land values, increased economic inequalities and deepened social division, in addition to other factors such as the arrival of a migrant population with a low degree of technical training and little prospect of integration into the formal economy circuit1, can exert strong inluence on the reproduction
of tuberculosis.
he city of Itaboraí, State of Rio de Janeiro, Brazil, has a history of high incidence of tuberculosis and it is undergoing important transformations of its urban space to host the largest petrochemical complex in the Latin America. The city suffers significant transformations in its urbanization pattern since the beginning of the implementation of the project in 2008, with an increase in housing informality and in the precariousness of housing conditions arising from deprivation of environmental sanitationb. he number of
households in precarious settlements increased 79.0% between 2000 and 2010, concurrently with the increase in land values since the enunciation of the implementation of the project in the cityb,c.
he rapid process of socio-spatial reorganization of the region results in the formation of conlicting territorial arrangements in which urban patterns with appropriate infrastructure and services live next to spaces marked by housing informality and precarious urban infrastructure1. his demand a high adaptive and analytical capacity from local control
programs regarding the ongoing changes in the epidemiological situation of the disease.
The importance of socioeconomic factors related to the process of reproduction of tuberculosis in intra-urban agglomerations is known5,15,19. Nevertheless, little progress has
been made in the discussion of socio-spatial patterns related to the evolution of the disease in contexts under intense transformation, as in Itaboraí. his study has aimed to analyze the relationship between the occurrence of tuberculosis and diferent socioeconomic dimensions linked to the living conditions of an endemic city undergoing a process of transformation of its urban space.
METHODS
his is an ecological study, whose analysis units were the seventy-nine neighborhoods of Itaboraí. he city is located in the region Leste Fluminense, 46 km from the city of Rio
de Janeiro. he association between the incidence of tuberculosis from 2006 to 2011 and the socioeconomic indicators related to the neighborhoods of the city were analyzed by generalized linear models.
Historically, Itaboraí is characterized by its importance in the economic dynamics of the region in which it is inserted. In the colonial period, it was considered the main trading post of the sugar production of Eastern Baixada da Guanabara, a place of
convergence of herdsmen transporting the sugar and coffee production from neighboring
regions to the city of Rio de Janeirod. Currently, it has strategic importance for the
economic development of the State of Rio de Janeiro and even Brazil, as it hosts the largest petrochemical industrial complex of Latin America. With the beginning of the implementation of the Petrochemical Complex of Rio de Janeiro (COMPERJ) in 2008, the city started experiencing a significant transformation of its urban space. Economic activities proliferated, aimed at the service and real estate speculation sectors, with expectations of increased migratory flow after the implantation of downstream petroleum industries.
Itaboraí had a census population of 218,000 inhabitants in 2010, with its Municipal Human Development Index (MHDI) being considered as intermediate (0.69), in addition to a monthly average income of R$1,860, and Gini index relecting reasonable inequality of income distribution (0.48)e,f.
The tuberculosis control program has been decentralized since 2003. That year, the strategy Tratamento Diretamente Observado (TDO – Directly Observed Treatment)
was implemented in thirty-four Family Health Units (FHU), responsible for forty-five teams of the Family Health Strategy (FHS), whose percentage of territorial coverage was approximately 77.0%g. The strategy of the TDO was extended to patients not covered
by the FHS in 2005, and important results were achieved in the five-year period, such as the reduction from 30.0% to 5.0% in the abandonment of the treatment and increase from 60.0% to 88.0% in the percentage of cases cured16. Despite these important results,
Itaboraí is one of the 181 priority Brazilian cities for the control of the disease as it presents incidence rates above 80.0% of the estimated rate for the country (32 new cases /100,000 inhabitants)6 since 2007.
The study sample consisted of new cases of pulmonary tuberculosis registered in the
Sistema Nacional de Agravos de Notificação (SINAN – Notifiable Diseases Information
System) from 2006 to 2011. We organized the cases according to the neighborhood of residence. For the records that had no information about the neighborhood, we crossed the street address with the registration of streets and land developments of the neighborhoods provided by the Local Government, resulting in completeness of 93.4% for this variable. We obtained the socioeconomic data used for the construction of indicators from the 2010 Census of the Brazilian Institute of Geography and Statistics (IBGE) and aggregates for the territorial level of neighborhoods. We based the population estimates for the intercensal period on the geometric growth model, assuming constant linear variation per unit of time (year).
he criteria for the initial selection of indicators considered the importance in determining the production and living conditions of tuberculosis, based on a study of systematic review15
on the topic, as well as the availability of data in the 2010 Census. We did not seek the directionality of the indicators a priori; on the contrary, wewanted a broader analysis
of the relationship between socioeconomic inequality and occurrence of tuberculosis. We constructed indicators grouping them according to diferent dimensions of living conditions (Table 1).
he response variable was the number of cases of pulmonary tuberculosis according to the neighborhoods of Itaboraí between 2006 and 2011. We analyzed the data by generalized linear model (GLM) with Poisson distribution. However, we decided to use GLM with negative binomial distribution because of the great dispersion of the multiple inal model8.
The model used assumes the form log (µ) = βx (log link function), where xi is the explanatory variable. The population was included as offset level considering its logarithm of each neighborhood. The exponential of regression coefficients βi represents the Incidence Rate Ratio (IRR)9. We tested the explanatory variables separately.
Those that showed statistical significance (p < 0.20) were included, one by one, in the negative binomial regression with log link function ( forward method). Before the
d Machado LO. Diagnóstico socioeconômico da Bacia do Caceribu: gente de Caceribu, sua geografia, sua história. 1998 [cited 2015 Oct 20]. Available from: http://acd.ufrj.br/fronteiras/ trabtec/caceribu.htm
e Instituto Brasileiro de Geografia e Estatística. Censo 2010. Rio de Janeiro: IBGE [cited 2015 Oct 20]. Available from: http://www. censo2010.ibge.gov.br/resultados f Programas das Nações Unidas para o Desenvolvimento. Atlas de desenvolvimento humano no Brasil. 2013 [cited 2015 Oct 20]. Available from em: http://www. pnud.org.br/IDH/Atlas2013. aspx?indiceAccordion=1&li=li_ Atlas2013
analysis, we tested for multicollinearity using VIF (Variance Inflation Factor) among the independent variables, with tolerance of less than ten. We selected the multiple model with best fit by the likelihood ratio test8, which consists of a hypothesis test that
compares the quality of fit between two models, in which one of the models is the subset of the other (nested models). We used Moran’s I index for spatial autocorrelation in the residuals from the final multiple model.
We carried out a descriptive analysis of the spatial distribution of tuberculosis from thematic maps of the average incidence by neighborhoods for the times related to the period of enunciation and beginning of works (2006 to 2008) and the period in which the installation process of the projects was intensiied (2009 to 2011). To compare the periods, we divided the classes by quartile from the set of rates (2006 to 2011), which were smoothed by the Empirical Bayes method, assuming a matrix of neighborhood by contiguity. We decided to smooth in this step because of the neighborhoods with small population, as they result in greater instability of the estimated gross rates.
his study was carried out according to the determinations of the Research Ethics Committee of the Escola Nacional de Saúde Pública Sergio Arouca (Opinion 71,237/2012).
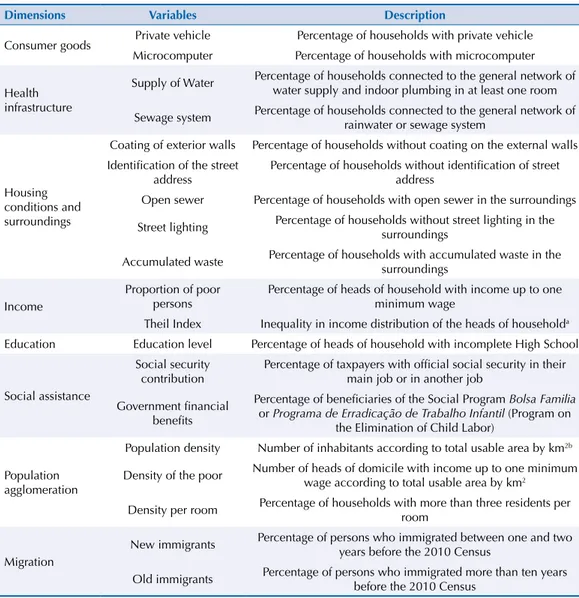
Table 1. Selected socioeconomic variables according to different dimensions of living conditions.
Dimensions Variables Description
Consumer goods Private vehicle Percentage of households with private vehicle Microcomputer Percentage of households with microcomputer
Health infrastructure
Supply of Water Percentage of households connected to the general network of water supply and indoor plumbing in at least one room
Sewage system Percentage of households connected to the general network of rainwater or sewage system
Housing conditions and surroundings
Coating of exterior walls Percentage of households without coating on the external walls Identification of the street
address
Percentage of households without identification of street address
Open sewer Percentage of households with open sewer in the surroundings
Street lighting Percentage of households without street lighting in the surroundings
Accumulated waste Percentage of households with accumulated waste in the surroundings
Income
Proportion of poor persons
Percentage of heads of household with income up to one minimum wage
Theil Index Inequality in income distribution of the heads of householda Education Education level Percentage of heads of household with incomplete High School
Social assistance
Social security contribution
Percentage of taxpayers with official social security in their main job or in another job
Government financial benefits
Percentage of beneficiaries of the Social Program Bolsa Familia
or Programa de Erradicação de Trabalho Infantil (Program on the Elimination of Child Labor)
Population agglomeration
Population density Number of inhabitants according to total usable area by km2b
Density of the poor Number of heads of domicile with income up to one minimum wage according to total usable area by km2
Density per room Percentage of households with more than three residents per room
Migration
New immigrants Percentage of persons who immigrated between one and two years before the 2010 Census
Old immigrants Percentage of persons who immigrated more than ten years before the 2010 Census
a Souza PFL, Salvato MA. Decomposição hierárquica da desigualdade de renda brasileira. In: XXXVI Encontro Nacional de Economia. 2008, Salvador – Bahia. Anais do XXXVI Encontro Nacional de Economia. 2008. p.1-21. Available from: http://www.anpec.org.br/encontro2008/artigos/200807211123470-.pdf
b Buildable portion of the neighborhood, estimated by the merged image of the sensors PRISM (Panchromatic Remote-sensing Instrument for Stereo Mapping) and AVINIR (Advanced Visible and Near Infrared
RESULTS
Eight hundred and four new cases of pulmonary tuberculosis were reported in Itaboraí from 2006 to 2011, with an annual average of 134 cases (min. = 103, max = 158) and average annual rate of incidence of 64.4 cases per 100,000 inhabitants. Table 2 presents the measures of central tendency and dispersion of the indicators according to the neighborhoods of Itaboraí. Regarding the spatial distribution of the disease, neighborhoods with higher rates in the irst period were located in the two main urban axes of the city (Southwest and Center). On the other hand, the second period (2009 to 2011) suggested a reduction of rates in the neighborhoods located in these urban axes, but with persistence in some neighborhoods with higher densities of poor persons (Figure – A, B, C). he proximity to the main highways that go through Itaboraí was a common characteristic between the territorial units with higher rates of the disease in both periods analyzed.
he univariate analysis between incidence of tuberculosis and socioeconomic indicators pointed to signiicant association with variables related to living conditions (Table 3). We have observed inverse associations between incidence of tuberculosis and the variables related to consumer goods and direct associations with variables related to housing conditions and surroundings and appropriate infrastructure (Table 3).
We have observed inverse association between incidence of tuberculosis and percentage of social security taxpayers and direct association with percentage of beneiciaries of income transfer programs. he greater inequality of income distribution, measured by the heil index, was directly associated with occurrence of tuberculosis (Table 3).
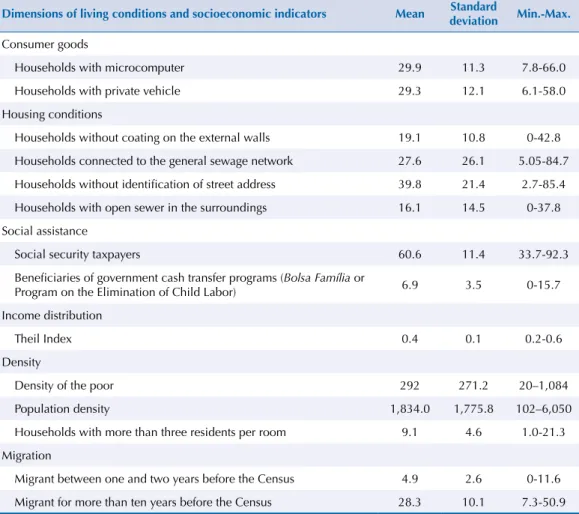
Table 2. Measure of central tendency (arithmetic mean) and dispersion of socioeconomic indicators pre-selected in the univariate analysis, according to neighborhoods. Itaboraí, RJ, Southeastern Brazil, 2010.
Dimensions of living conditions and socioeconomic indicators Mean Standard
deviation Min.-Max.
Consumer goods
Households with microcomputer 29.9 11.3 7.8-66.0
Households with private vehicle 29.3 12.1 6.1-58.0
Housing conditions
Households without coating on the external walls 19.1 10.8 0-42.8
Households connected to the general sewage network 27.6 26.1 5.05-84.7
Households without identification of street address 39.8 21.4 2.7-85.4
Households with open sewer in the surroundings 16.1 14.5 0-37.8
Social assistance
Social security taxpayers 60.6 11.4 33.7-92.3
Beneficiaries of government cash transfer programs (Bolsa Família or
Program on the Elimination of Child Labor) 6.9 3.5 0-15.7
Income distribution
Theil Index 0.4 0.1 0.2-0.6
Density
Density of the poor 292 271.2 20–1,084
Population density 1,834.0 1,775.8 102–6,050
Households with more than three residents per room 9.1 4.6 1.0-21.3
Migration
Migrant between one and two years before the Census 4.9 2.6 0-11.6
Migrant for more than ten years before the Census 28.3 10.1 7.3-50.9
We have also observed direct association with recent migration and population agglomeration in the territory and density per room (Table 3).
he model with best it in the multiple analysis had these variables: percentage of households with private vehicle, percentage of households with more than three residents per room, percentage of households with presence of open sewer in the surroundings, density of the poor, heil index and percentage of recent migrants (Table 3).
Moran’s I index, related to the residuals of the inal multiple model, showed no statistical signiicance (p = 0.483), thus indicating the absence of spatial autocorrelation.
Figure. (A) Spatial distribution of tuberculosis according to neighborhoods. Itaboraí, RJ, Southeastern Brazil, from 2006 to 2008; (B) Spatial distribution of tuberculosis according to neighborhoods. Itaboraí, RJ, Southeastern Brazil, from 2009 to 2011; (C) Spatial distribution of the indicator “density of the poor” according to neighborhoods. Itaboraí, RJ, Southeastern Brazil, 2010.
Highways
Neighborhoods of Itaboraí
Smoothed incidence rate (2006-2008) Q1 - (2.5 - 11.0)
Q2 - (11.0 - 15.4) Q3 - (15.4 - 21.7) Q4 - (21.7 - 67.1)
Highways
Neighborhoods of Itaboraí
Smoothed incidence rate (2009-2011) Q1 - (2.5 - 11.0)
Q2 - (11.0 - 15.4) Q3 - (15.4 - 21.7) Q4 - (21.7 - 67.1)
Neighborhoods of Itaboraí Density of the poor
Q1 - (3 - 37) Q2 - (37 - 148) Q3 - (148 - 354) Q4 - (354 - 1083) 0 1.53 6 9
km RJ-114 BR-101
BR-493
BR-101
RJ-114 BR-493
RJ-116 RJ-116
N
S
W E
(A) (B)
DISCUSSION
he remarkable relationship between the occurrence of tuberculosis and socioeconomic inequalities observed in this study highlights an important framework of social inequities in health, evidenced not only in our results, but also in other studies using diferent territorial units3,7,10,13.
he pattern of spatial distribution of tuberculosis for the study area can be the result of a socio-spatial reorganization, with the displacement of the low-income population to areas that lack health and housing infrastructure because of the increased real estate speculationb,c.
he limits and scope of the local control program to reduce the rates in these new urban agglomerations in socioeconomic vulnerability situation should be assessed.
he higher incidence of tuberculosis in neighborhoods with higher coverage of the general sewage network in the study area suggests the existence of socio-spatial heterogeneity because of the presence of pockets of poorer populations in neighborhoods with better health infrastructure. Such aspect is reinforced by the higher incidence of tuberculosis in
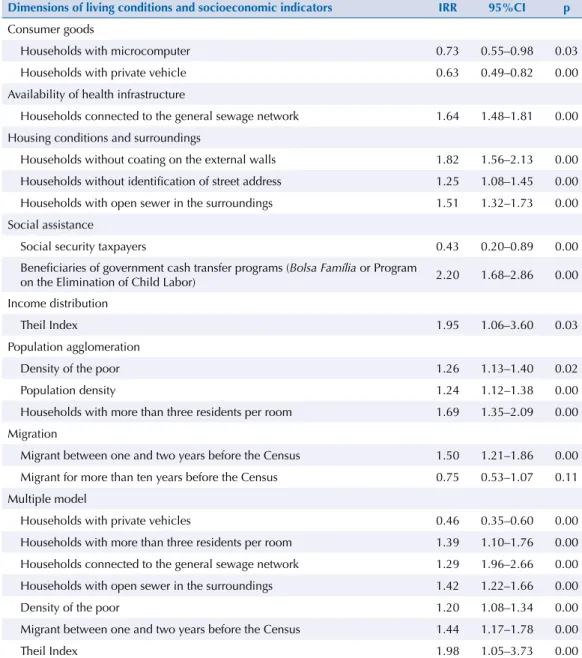
Table 3. Parameters of the univariate analysis and multiple model with the respective tuberculosis incidence rate ratios according to neighborhoods. Itaboraí, RJ, Southeastern Brazil, 2006 to 2011.
Dimensions of living conditions and socioeconomic indicators IRR 95%CI p
Consumer goods
Households with microcomputer 0.73 0.55–0.98 0.03
Households with private vehicle 0.63 0.49–0.82 0.00
Availability of health infrastructure
Households connected to the general sewage network 1.64 1.48–1.81 0.00
Housing conditions and surroundings
Households without coating on the external walls 1.82 1.56–2.13 0.00
Households without identification of street address 1.25 1.08–1.45 0.00
Households with open sewer in the surroundings 1.51 1.32–1.73 0.00
Social assistance
Social security taxpayers 0.43 0.20–0.89 0.00
Beneficiaries of government cash transfer programs (Bolsa Família or Program
on the Elimination of Child Labor) 2.20 1.68–2.86 0.00
Income distribution
Theil Index 1.95 1.06–3.60 0.03
Population agglomeration
Density of the poor 1.26 1.13–1.40 0.02
Population density 1.24 1.12–1.38 0.00
Households with more than three residents per room 1.69 1.35–2.09 0.00
Migration
Migrant between one and two years before the Census 1.50 1.21–1.86 0.00
Migrant for more than ten years before the Census 0.75 0.53–1.07 0.11
Multiple model
Households with private vehicles 0.46 0.35–0.60 0.00
Households with more than three residents per room 1.39 1.10–1.76 0.00
Households connected to the general sewage network 1.29 1.96–2.66 0.00
Households with open sewer in the surroundings 1.42 1.22–1.66 0.00
Density of the poor 1.20 1.08–1.34 0.00
Migrant between one and two years before the Census 1.44 1.17–1.78 0.00
Theil Index 1.98 1.05–3.73 0.00
neighborhoods with greater inequality of income distribution (heil index). his information points to the need of studies to be developed at the local level that can identify particular characteristics not captured or included in analyses of higher level of spatial aggregation14.
Although we have identiied higher incidences of tuberculosis in neighborhoods with higher population density and higher density per room, these indicators do not always relate with the disease directly. he high concentration of persons in a given space does not necessarily mean poor living conditions, as discussed by Vicentin et al.18 (2002). he density of the poor proved
to be more suitable as the marker of these spaces, as it aggregates individual and territorial attributes, indirectly measuring the rate of social contact from the densiication of persons who live in situations of insecurity and who are less able to act/respond to tuberculosis2.
he higher incidence of tuberculosis in neighborhoods with higher percentage of beneiciaries of government cash transfer programs (Bolsa Família and Program on the Elimination of
Child Labor) suggests greater vulnerability because of the poverty or extreme poverty present in these areas.
Studies show positive efects of cash transfer programs on the health situation, with signiicant impacts on the reduction of inequality of income distribution in Brazil from 2000, as a result of the economic and social inclusion of families living in poverty17,h,i.
Although they grant improved nutritional status and greater access to health services11,
in this sectional study the highest incidence of tuberculosis in neighborhoods with higher proportions of beneiciaries of these programs is present as a marker of poor living conditions and, ultimately, of the greater vulnerability to tuberculosis. For a better understanding of the impact of these programs on the occurrence of tuberculosis, we need to consider the percentage of coverage, time of implementation and interaction of those programs with the Family Health Strategy, as emphasized by Rosela et al.17 (2013).
he contribution of recent residents is estimated to be approximately 4.4% of the city population, comprising persons in economically active age (15 to 59 years). Although the contribution of immigrants to this city is not very intense, its occurrence suggests the inluence of COMPERJ as an attractive hub and vector of organization of the territory. At the time of the initial implementation of the project, migration lows were low. However, a more signiicant contribution of immigrants may happen with the beginning of the operation of the reinery and installation of downstream petroleum industries, as in the city of Macaé, RJ, which experienced a process similar to what is happening in Itaboraíj.
he higher incidence of tuberculosis in neighborhoods with higher proportion of recent immigrants is an important challenge to the disease control program of the city. he arrival of immigrants with low degree of technical training and little prospect of integration into the formal economy circuit results in the occupation of areas with worse housing conditions and reduced public services. hese socio-spatial patterns imply a greater risk of exposure to tuberculosis. he great challenge of the local control program is the development and consolidation of a surveillance that can identify new urban spaces vulnerable to the disease.
he use of the neighborhood as unit of analysis could capture the relationship between socioeconomic inequalities and tuberculosis. However, the internal heterogeneity of these territorial units could not discriminate the presence of pockets of worse living conditions where actions to control tuberculosis could be intensiied. Considering the relevance of the service to control tuberculosis, another limitation that could not be controlled in this study is the unavailability of an indicator that would measure the quality of the care of the FHS in each neighborhood, as the good coverage in the city does not necessarily mean adequate assistance to the cases of tuberculosis.
Our results corroborate the findings in other studies regarding the importance of socioeconomic determinants for tuberculosis, showing the disproportionate incidence of the disease among population groups with worse living conditions7,16,19.
h Soares FV, Soares S, Medeiros M, Osorio R. Cash transfer programmes in Brazil: impacts on inequality and poverty. New York: United Nation Population Division; 2006. Available from: http://www.ideas.respec.org/ipc/ wpapper/21.html
i Santos LMP, Paes-Sousa R, Miazagi E, Silva TF, Fonseca AMM. The Brazilian experience with conditional cash
he implementation of an important vector of economic development in the study area provides a set of opportunities, stresses and vulnerabilities experienced in a rapidly changing territory. On the one hand, the implementation of this type of project generates opportunities for the Government to expand and improve housing, health, and education services because of the collection of taxes and royalties. On the other hand, the increase in socioeconomic inequalities and real estate speculation raises tensions and vulnerabilities related to the unequal appropriation of the territory, in which those with little economic power occupy neighborhoods with little public investment in housing infrastructure.
he collaboration of health services and other municipal public sectors focused on housing, infrastructure, social welfare, and education is very important to reduce the social burden of tuberculosis so that the problem is not solved solely based on the responsiveness of local disease control programs.
REFERENCES
1. Amaral D, Sánchez F, Bienenstein R. O leste fluminense, o COMPERJ e a questão urbano-habitacional. In: Oliveira FL, Cardoso AL, Costa HSM, Vainer CB, organizadores. Grandes projetos metropolitanos: Rio de Janeiro e Belo Horizonte. Rio de Janeiro (RJ): Letra Capital; 2012. p. 151-86.
2. Angelo JR, Toledo LM, Sabroza PC. Produção do espaço urbano e tuberculose no município de Juiz de Fora. In: Ramires JCL, organizador. Dinâmica socioespacial e saúde coletiva em cidades de Minas Gerais. Rio de Janeiro (RJ): Letra Capital; 2013. v. 1, p. 103-38.
3. Chan-yeung M, Yeh AG, Tam CM, Kam KM, Leung CC, YewWW et al. Socio-demographic and geographic indicators and distribution of tuberculosis in Hong Kong: a spatial analysis. Int J Tuberc Lung Dis. 2005;9(12):1320-6.
4. Dye C, Lönnroth K, Jaramillo E, Williams BG, Raviglione M. Trends in tuberculosis incidence and their determinants in 134 countries. Bull World Health Organ. 2009;87(9):683-91. https://doi.org/10.2471/BLT.08.058453
5. Leung CC, Yew WW, Tam CM, Chan CK, Chang KC, Law WS et al. Socioeconomic factors and tuberculosis: a district-base ecological analysis in Hong Kong. Int J Tuberc Lung Dis. 2004;8(8):958-64.
6. Ministério da Saúde, Secretaria de Vigilância em Saúde, Departamento de Vigilância de Doenças Transmissíveis. Panorama da tuberculose no Brasil: indicadores epidemiológicos e operacionais. Brasília (DF): Ministério da Saúde; 2014.
7. Molina Serpa I, López Pardo C, Alonso Hernandez R. Un estudio ecológico sobre tuberculosis en un municipio de Cuba. Cad Saude Publica. 2003;19(5):1305-12. https://doi.org/10.1590/S0102-311X2003000500009
8. Myers AL, Allore H, Gill TM, Peduzzi PN. Application of negative binomial modeling for discrete outcomes: a case study in aging research. J Clin Epidemiol. 2003;56:559564. https://doi.org/10.1016/S0895-4356(03)00028-3
9. Myers WP, Westenhouse JL, Flood J, Riley LW. An ecological study of tuberculosis transmission in California. Am J Public Health. 2006;96(4):685-90. https://doi.org/10.2105/AJPH.2004.048132
10. Oren E, Koepsell T, Leroux BG, Mayer J. Area-based socio-economic disadvantage and tuberculosis incidence. Int J Tuberc Lung Dis. 2012;16(7):880-5. https://doi.org/10.5588/ijtld.11.0700
11. Paes-Sousa R, Santos LMP, Miazaki ES. Effects of a conditional cash transfer programme on child nutrition in Brazil. Bull World Health Organ. 2011;89(7):496-503. https://doi.org/10.2471/BLT.10.084202
12. Pang PT, Leung CC, Lee SS. Neighbourhood risk factors for tuberculosis in Hong Kong. Int J Tuberc Lung Dis. 2010;14(5):585-92.
13. Ponticiello A, Sturkenboom MC, Simonetti A, Ortolani R, Malerba M, Sanduzzi A.
Deprivation, immigration and tuberculosis incidence in Naples, 1996–2000. Eur J Epidemiol.
2005;20(8):729-34. https://doi.org/10.1007/s10654-005-0615-9
15. San Pedro A, Oliveira R. Tuberculose e indicadores socioeconômicos: revisão sistemática da literatura. Rev Panam Salud Publica. 2013;33(4):294-301. https://doi.org/10.1590/S1020-49892013000400009
16. Silva DF, Pereira MJF. Reestruturação do modelo de atenção do Programa de Controle de Tuberculose do município de Itaboraí, Rio de Janeiro. J Bras Pneumol. 2008;34 supl:1-70
17. Rosela D, Aquino A, Santos CAT, Paes-Sousa R, Barreto ML. Effect of a conditional cash transfer programme on childhood mortality: a nationwide analysis of Brazilian municipalities. Lancet. 2013;382(9886):57-64. https://doi.org/10.1016/S0140-6736(13)60715-1
18. Vincentin G, Santo AH, Carvalho MS. Mortalidade por tuberculose e indicadores sociais no município do Rio de Janeiro. Cienc Saude Coletiva. 2002;7(2):253-63. https://doi.org/10.1590/S1413-81232002000200006
19. Ximenes RAA, Albuquerque MFPM, Souza WV, Montarroyos UR, Diniz GTN, Luna CF et al. Is it better to be rich in a poor area or a poor in a rich area? A multilevel analysis of a case-control study of social determinants of tuberculosis. Int J Epidemiol. 2009;38(5):1285-96. https://doi.org/10.1093/ije/dyp224
Authors’ Contribution: Design and planning of the study: ASP, RMO, PCS. Analysis and interpretation of the data: ASP, GG, JPCS. Drafting of the study: ASP, GG. Critical review of the study: ASP, LMT, RMO, GG.