Vulnerability to the transmission of
human visceral leishmaniasis in a
Brazilian urban area
Celina Roma Sánchez de ToledoI, Andréa Sobral de AlmeidaII, Sergio Augusto de Miranda ChavesII,
Paulo Chagastelles SabrozaII, Luciano Medeiros ToledoII, Jefferson Pereira CaldasIII
I Divisão de Vigilância em Saúde. Secretaria Municipal de Saúde do Rio de Janeiro. Rio de Janeiro, RJ, Brasil II Departamento de Endemias Samuel Pessoa. Escola Nacional de Saúde Pública. Fundação Oswaldo Cruz.
Rio de Janeiro, RJ, Brasil
III Programa de Pós-Graduação em Epidemiologia em Saúde Pública. Escola Nacional de Saúde Pública. Fundação Oswaldo Cruz. Rio de Janeiro, RJ, Brasil
ABSTRACT
OBJECTIVE: To analyze the determinants for the occurrence of human visceral leishmaniasis linked to the conditions of vulnerability.
METHODS: his is an ecological study, whose spatial analysis unit was the Territorial Analysis Unit in Araguaína, State of Tocantins, Brazil, from 2007 to 2012. We have carried out an analysis of the sociodemographic and urban infrastructure situation of the municipality. Normalized primary indicators were calculated and used to construct the indicators of vulnerability of the social structure, household structure, and urban infrastructure. From them, we have composed a vulnerability index. Kernel density estimation was used to evaluate the density of cases of human visceral leishmaniasis, based on the coordinates of the cases. Bivariate global Moran’s I was used to verify the existence of spatial autocorrelation between the incidence of human visceral leishmaniasis and the indicators and index of vulnerability. Bivariate local Moran’s I was used to identify spatial clusters.
RESULTS: We have observed a pattern of centrifugal spread of human visceral leishmaniasis in the municipality, where outbreaks of the disease have progressively reached central and peri-urban areas. here has been no correlation between higher incidences of human visceral leishmaniasis and worse living conditions. Statistically signiicant clusters have been observed between the incidences of human visceral leishmaniasis in both periods analyzed (2007 to 2009 and 2010 to 2012) and the indicators and index of vulnerability.
CONCLUSIONS: he environment in circumscribed areas helps as protection factor or increases the local vulnerability to the occurrence of human visceral leishmaniasis. he use of methodology that analyzes the conditions of life of the population and the spatial distribution of human visceral leishmaniasis is essential to identify the most vulnerable areas to the spread/maintenance of
the disease.
DESCRIPTORS: Leishmaniasis, Visceral, epidemiology. Health Vulnerability. Socioeconomic Factors. Ecological Studies.
Correspondence:
Andréa Sobral de Almeida Departamento de Endemias Samuel Pessoa – ENSP/Fiocruz
Rua Leopoldo Bulhões, 1480 6º andar Manguinhos
21041-210 Rio de Janeiro, RJ, Brasil E-mail: [email protected]
Received: 6 Jul 2015
Approved: 4 Dec 2015
How to cite: Toledo CRS, Almeida AS, Chaves SAM, Sabroza PC, Toledo LM, Caldas JP. Vulnerability to the transmission of human visceral leishmaniasis in a Brazilian urban area. Rev Saude Publica. 2017;51:49.
Copyright: This is an open-access article distributed under the terms of the Creative Commons Attribution License, which permits unrestricted use, distribution, and reproduction in any medium, provided that the original author and source are credited.
INTRODUCTION
Visceral leishmaniasis (VL) is a vector-borne parasitic disease whose importance in the context of public health in Brazil has increased signiicantly in recent years. his fact is mainly due to the expansion of urbanization processes and the modiication of habitats of the species involved in the transmission cycle5,22.
he geographical areas with transmission of VL are increasingly expanding. he disease, considered one of the priorities among tropical diseases by the World Health Organization (WHO), is endemic in ninety-eight countries, including Brazila, whose areas of occurrence increase progressively9,13. here is a great gap in scientiic knowledge about VL. Studies are
needed on new drugs and therapeutic regimes, as well as studies that address the efectiveness of disease control actions with greater methodological strength, among others aspects22.
Araguaína, in the State of Tocantins, Brazil, presents a recent endemic-epidemic process of VL. There has been an alarming increase in the number of confirmed human cases mainly between 2006 (56) and 2007 (251), when it presented the greatest number of records of the disease in Brazil (7.0% of all reported cases in the country). Since then, it remains among the four Brazilian municipalities with the highest absolute number of annual records of VL.
he analysis of the vulnerability20 of the region for the transmission of VL using indicators and
the analysis of the spatial distribution of urban VL can contribute to the better understanding of the heterogeneous transmission process, resulting from the socio-territorial organization of the municipality1,2,5.
his study aimed to analyze the determining circumstances for the occurrence of human visceral leishmaniasis (HVL), linked to the conditions of vulnerability in Araguaína. he data can provide elements for the formulation of public policies adapted to this situation.
METHODS
Araguaína (Figure 1) is located in northern Brazil, in the northern portion of the State of Tocantins. It has an altitude of 227 m, under the geographical coordinates 7°11’28” South latitude and 48°12’26” West longitude. It is 380 km from Palmas, capital of the State (IBGE, 2014). It presents high temperatures throughout the year, approximately 28°C. he population distribution is predominantly urban, with great rural emptiness. Between the 2000 and 2010 Demographic Censuses (Brazilian Institute of Geography and Statistics – IBGE)b,c, we
can observe a growth of 33% ( from 113,143 to 150,484 inhabitants) of the total population of the municipality and approximately 35% of the urban population ( from 105,874 to 142,925 inhabitants).
he urban territory of Araguaína is characterized by a central region with high density and intermediate and peripheral areas, discontinuous among themselves. he growth model of this municipality is discontinuous and segregated. For the most part, the areas with increased population density have vast unoccupied areas with considerable spacing between the buildings. In addition, most of the streets in these areas are not paved.
This is an ecological study, with cases of HVL notified between 2007 and 2012 in Araguaína residents. he cases reported and conirmed in residents were obtained from the Municipal Health Department of the Municipality and the Sistema de Agravos de
Notiicação (SINAN – System of Reportable Diseases)/ Department of Health Surveillance (SVS)/ Ministry of Health. he deinition of conirmed case of VL is based on criteria adopted by the Ministry of Health to guide the actions of epidemiological surveillance of the disease throughout the country15.
a World Health Organization. Global Health Observatory (GHO) Data. Leishmaniasis: situation and trends. Geneva: World Health Organization; 2010 [cited 2010 Oct 28]. Available from: http://www. who.int/gho/neglected_diseases/ leishmaniasis/en/
b Instituto Brasileiro de Geografia e Estatística. Censo demográfico 2000: características da população e dos domicílios: resultados do universo. Rio de Janeiro: IBGE; s.d. [cited 2017 Feb 21]. Available from: http://www.ibge.gov.br/home/ estatistica/populacao/censo2000/ defaulttab_brasil.shtm
We performed the analysis of the situation of vulnerability to the transmission of the disease based on the construction of indicators related to the conditions of urban, social, and household infrastructure for 2010, the analysis of the distribution of HVL in time and space in two three-year periods (2007-2009 and 2010-2012), in addition to the descriptive analysis of the cases of canine visceral leishmaniasis (CVL) notiied by the Municipal Health Department between 2006 and 2008. he analysis in three-year periods was used because the disease has a cyclical nature. In addition, this approach helps to reduce the variability in the number of cases reported between the years of the study.
The digital base of the territorial analysis units (TAU) was made from the compatibility of the bases of urban census tracts of the 2000 and 2010 Demographic Censuses of the IBGEd. The compatibility was carried out because those geographical bases are very distinct (Figure 1).
We generated polygons of the areas occupied by the human population, based on the methodology referred to in the Land Use Manual11. he polygons of the occupied areas were
vectorized by the method of visual interpretation of satellite images. We identiied the spaces with urban characteristics at a 1:5,000 scale, using geoprocessing tools in a Georeferenced Information System (GIS). his step was developed based on the Digital Globe satellite images for 2014, obtained by the software Google Earth, with spatial resolution of one meter. he software used was ArcGis 10.2.
he autochthonous cases of HVL reported between 2007 and 2012 were georeferenced from the address found in the database of the SINAN, with the use of Google Earth. his generated a digital data mesh.
The mesh containing the specific data relating to the cases of the disease was superimposed to the digital base of TAU and the areas occupied by human populations in each TAU. This allowed the aggregation of cases of HVL based on these units of territorial analysis.
For the calculation of incidence of the two three-year periods (2007-2009 and 2010-2012), we used the cases reported and conirmed in the periods in the numerator and the population
d Instituto Brasileiro de Geografia e Estatística. Downloads: Geociências. Rio de Janeiro: IBGE; 2016 [cited 2017 Feb 21]. Available from: http://downloads. ibge.gov.br/downloads_ geociencias.htm
Brazil Tocantins
TAU: Territorial Analysis Units Outline of Araguaína
Scale 1:128.171
0 1,500 6,000 9,000
meters 3,000
Transversal Universal Projection of Mercator Datum SIRGAS 2000
N
obtained from the population projection per TAU, based on the 2000 and 2010 Census populations, in the denominator. he calculation of the density of cases was carried out based on the area actually occupied by the human population of the TAU.
Kernel density estimation was used to evaluate the density of cases of HVL, based on the coordinates of the cases. hematic maps were prepared for the spatial and temporal analysis of the evolution of the endemic disease, as well as their correlation with the information about the situation of social and household structure and urban infrastructure. he application ArcGis 10.2 was used for this analysis.
Official information, available on the website of IBGE on the 2010 Demographic Census, was used for the analysis of the conditions of urban, social, and household infrastructure of the municipality. This analysis identified the most vulnerable areas in the urban and social infrastructure, in order to reveal differences between the various areas of the municipality.
Primary indicators were calculated based on the variables of the 2010 Demographic Census. Such indicators had their values normalized according to the methodology used by Tiburcio and Corrêa20. We applied T1 (positive indicators: high values represent
lower vulnerability situations) and T2 (negative indicators: low values represent lower vulnerability situations) equations. The highest values observed (MaximumI), the lowest
values observed (MinimumI), and the individual value of each primary indicator (IObserved)
were used for the calculation:
T1: Ip =
MaximumI – IObserved
MaximumI – MinimumI
T2: Ip = IObserved – MinimumI
MaximumI – MinimumI
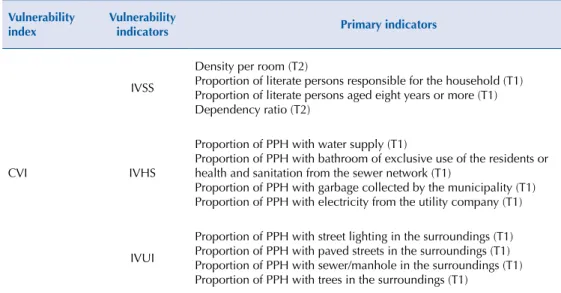
Indicators of vulnerability of social structure (IVSS), household structure (IVHS), and urban infrastructure (IVUI) were created from normalized indicators. he indicators had their values converted into scores that ranged from 0 to 1, with cutof points deined according to quartiles of distribution, assigning the lowest values to the best conditions (Table 1). he composite vulnerability index (CVI) was prepared based on these indicators
Table 1. Primary indicators used in the construction of the indicators of vulnerability and composite vulnerability index. Araguaína, State of Tocantins, Brazil.
Vulnerability index
Vulnerability
indicators Primary indicators
CVI
IVSS
Density per room (T2)
Proportion of literate persons responsible for the household (T1) Proportion of literate persons aged eight years or more (T1) Dependency ratio (T2)
IVHS
Proportion of PPH with water supply (T1)
Proportion of PPH with bathroom of exclusive use of the residents or health and sanitation from the sewer network (T1)
Proportion of PPH with garbage collected by the municipality (T1) Proportion of PPH with electricity from the utility company (T1)
IVUI
Proportion of PPH with street lighting in the surroundings (T1) Proportion of PPH with paved streets in the surroundings (T1) Proportion of PPH with sewer/manhole in the surroundings (T1) Proportion of PPH with trees in the surroundings (T1)
of vulnerability. he CVI was prepared by the arithmetic average of the three indicators of vulnerability (IVSS, IVHS, and IVUI).
The IVSS was created to combine the information from various sociodemographic indicators into a synthetic indicator to establish an order in relation to the level of social vulnerability. he IVHS was prepared with the information of various indicators of household structure, allowing a synthetic measure of the housing conditions of the population. he IVUI was created to synthesize the information on the urban infrastructure surrounding the household into a single indicator.
Bivariate Global Moran’s I was used to verify the existence of spatial autocorrelation between the incidence rate of HVL and the Vulnerability Indices. The index tests whether the values of an indicator in a given region is related to the values of another variable in neighboring regions. Statistics can have the values from -1 to +1, positive for direct correlation and negative when inverse3,16,e. Bivariate Global Moran’s I does not show
where the spatial cluster are. Thus, we used Bivariate Local Moran’s I, which provides the degree of spatial autocorrelation, statistically significant, in each regional unit. According to Anselin, this index provides an indication of the degree of linear association between the value for a variable in a given area and the average of another variable in the surrounding areas. The matrix of the neighborhood W defined by contiguity was the Queen matrix, which considers two neighboring regions that have common borders, in addition to common nodes (vertices).
The statistical significance of Moran’s I Index was tested using permutations. We generated subsequent permutations of the values of the data associated with the TAU. Each permutation produces a new spatial arrangement, in which values are distributed randomly between the TAU. That way, we can create an empirical distribution of statistics I under the null hypothesis of spatial randomness. The empirical pseudo-significance was based on ninety-nine random permutations. The program used in this analysis was GeoDa 1.6.63.
The information about the cases of CVL was provided according to neighborhood by the Center of Control of Zoonosis (CCZ) of Araguaína. As there was incompatibility of the sketch of neighborhoods with the digital cartographic bases of the census tracts and TAU, the analyses were restricted to the municipal level. We calculated the positivity of cases of CVL from the absolute number of samples collected and the number of samples per year.
his study has been approved by the Research Ethics Committee of the EscolaNacional de Saúde Pública Sérgio Arouca of the Fundação Oswaldo Cruz (Protocol 142/11).
RESULTS
We observed an increase of approximately 30% of the resident population in the urban area of the municipality of Araguaína between the 2000 and 2010 Censuses. We could also identify a more marked growth (6.7%) in the population aged 60 years or more and a less accentuated growth (5.9%) among individuals aged between zero and four years. The illiteracy rate of the population aged 15 years or more decreased in the same period (13.4%, 2000 Census; 8.6%, 2010 Census), as well as the proportion of permanent private homes with sanitation considered by the IBGE as inadequate (7.5%, 2000 Census; 4.7%, 2010 Census).
We found a signiicant number of cases of the disease in the municipality during the period, although there was a decrease of 44.6% when we compared the irst year (2007) of the historical series analyzed with the last one (2012). his decrease followed what was observed in the country to a lesser degree (decrease of 4.8% between 2007 and 2012). Approximately 251 cases were reported in 2007, 262 cases in 2008, 164 cases in 2009, 96 cases e Anselin L. An introduction
in 2010, 184 cases in 2011, and 139 cases in 2012. Two epidemic waves were observed in the city; the irst with a peak in 2008 and the second one with a peak in 2011. Epidemic waves were deined based on the signiicant increase in the number of human cases of VL when observed the historical series.
Of the 1,096 cases of HVL notiied and conirmed between 2007 and 2012, 84.8% were georeferenced. Georeferencing losses occurred because of the incompleteness of the address ield in the SINAN or because we could not properly locate the address on Google Earth. he conirmed cases of VL were superimposed to the digital cartographic base of the occupied areas in the TAU to observe the dispersion of the disease throughout the municipality.
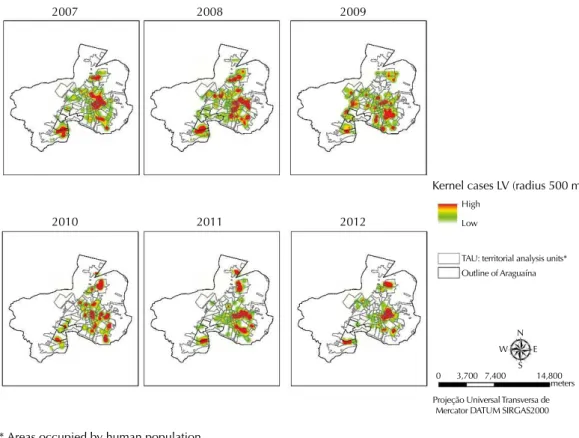
he areas with greater intensity of occurrence of HVL in Araguaína were estimated using the Kernel method (Figure 2). We observed a more expressive cluster in the central urban area and other smaller clusters in the peripheral areas of the municipality in the irst year of the period. he centrifugal spread of the disease, with greater spreading of cases throughout the territory, occurred over time. A pattern close to the one for 2007 was observed in the last two years of the period.
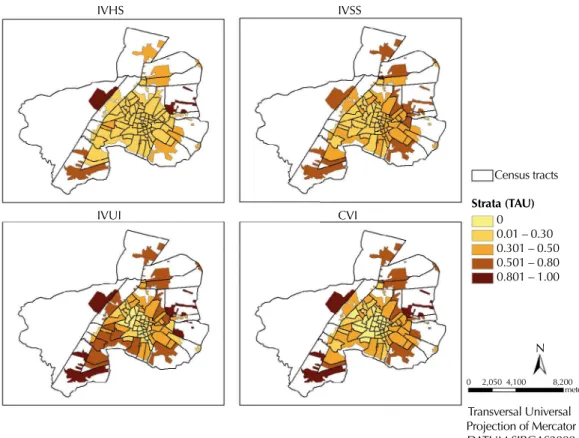
The worst scores of IVSS, IVHS, and IVUI are located in the occupied areas of the outskirts of the municipality (Figure 3). The IVUI had the worst score values (close to one), showing the precarious conditions of the urban infrastructure in most of the area analyzed.
The indicators of vulnerability with greater significant global spatial autocorrelation (Bivariate Moran’s I; p value) with the incidence of HVL of the two periods, respectively, were: IVSS (I = 0.132554; p = 0.05 – I = 0.221152; p = 0.03) and IVUI (I = 0.127157; p = 0.03 – I = 0.148091; p = 0.04). he IVHS had spatial autocorrelation only for the incidence of HVL of the irst period, while CVI had spatial autocorrelation for both periods (I = 0.140858; p = 0.04 – I = 0.143946; p = 0.01) (Table 2).
2007 2008 2009
2010 2011 2012
Kernel cases LV (radius 500 m)
TAU: territorial analysis units* Outline of Araguaína High
Low
N
S W E
0 3,700 7,400 14,800 meters
Projeção Universal Transversa de Mercator DATUM SIRGAS2000
* Areas occupied by human population.
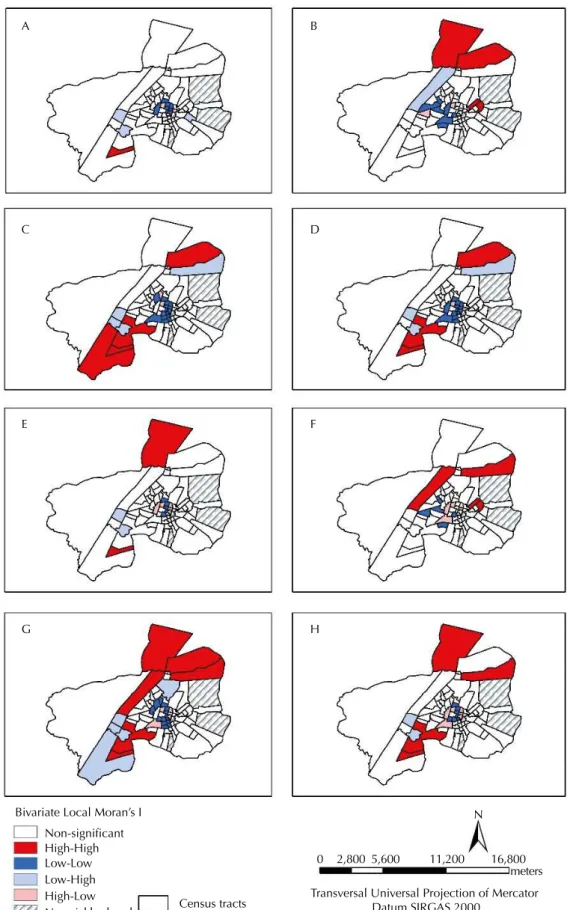
Bivariate Local Moran’s I showed the presence of statistically signiicant clusters between the incidences of HVL in both periods and the indicators of vulnerability for the census tracts (Figure 4).
Main clusters (Low-Low in central areas and High-High in the northern and southern peripheral regions) were evidenced, as well as intermediate clusters (Low-High and High-Low) in all combinations tested in the period analyzed (Figure 4). The main clusters located in the central region showed areas of low incidence of HVL circumscribed by better living conditions (those with low scores), while the peripheral clusters revealed areas of high incidence of HVL circumscribed by areas with worse living conditions (those with high scores). The High-High clusters located in the southern peripheral region of the municipality remained virtually unchanged in both periods for the indicators IVUI and CVI (Figure 4).
No signiicant variations were observed regarding canine seropositivity: 33% was observed in 2006, 37.9% in 2007, and 37.1% in 2008.
Table 2. Index of correlation of Bivariate Moran’s I between the incidence of visceral leishmaniasis in the periods of 2007–2009 and 2010–2012 and indicators and index of vulnerability. Araguaína, State of Tocantins, Brazil, 2010.
Incidence rate
IVHS IVSS IVUI CVI
Biv Moran’s I p Biv Moran’s I p Biv Moran’s I p Biv Moran’s I p
Inc 07_09 0.093865 0.05 0.132554 0.05 0.127157 0.03 0.140858 0.04
Inc 10_12 -0.02625 0.41 0.221152 0.03 0.148091 0.04 0.143946 0.01
IVSS: Indicator of vulnerability of social structure; IVHS: Indicator of vulnerability of household structure; IVUI: Indicator of vulnerability of urban infrastructure; CVI: Composite vulnerability index
IVHS IVSS
IVUI CVI
Census tracts
Transversal Universal Projection of Mercator DATUM SIRGAS2000
Strata (TAU)
0 0.01 – 0.30 0.301 – 0.50 0.501 – 0.80 0.801 – 1.00
N 0 2,050 4,100 8,200
meters
IVHS: Indicator of vulnerability of household structure; IVSS: Indicator of vulnerability of social structure; IVUI: Indicator of vulnerability of urban infrastructure; CVI: Composite vulnerability index; TAU: Territorial analysis units
Bivariate Local Moran’s I Non-significant High-High Low-Low Low-High High-Low
No neighborhood Census tracts
Transversal Universal Projection of Mercator Datum SIRGAS 2000
N
0 2,800 5,600 11,200
meters 16,800
A B
C D
E F
G H
A: Incidence (2007-2009) versus Indicator of vulnerability of household structure (IVHS). B: Incidence (2007-2009) versus Indicator of vulnerability of social structure (IVSS). C: Incidence (2007-2009) versus Indicator of vulnerability of urban infrastructure (IVUI). D: Incidence (2007-2009) versus composite vulnerability index (CVI).
E: Incidence (2010-2012) versus IVHS. F: Incidence (2010-2012) versus IVSS. G: Incidence (2010-2012) versus IVUI. H: Incidence (2010-2012) versus CVI.
DISCUSSION
We observed a pattern of centrifugal spread of human visceral leishmaniasis in Araguaína. Outbreaks of the disease reached progressively, from 2008, the occupied central and peri-urban areas of the municipality. However, the pattern of spread had important annual intensity variations.
Other Brazilian municipalities, also in the process of increasing urbanization and precarious living conditions, have diferent epidemiological patterns of spread of VL. Among these patterns, we can identify: restricted peri-urban pattern (outbreaks of the disease restricted to areas of the urban periphery), difuse peri-urban pattern (outbreaks of the disease mainly afecting the urban peripheries and, secondarily, central/urbanized areas), epidemiological pattern of centrifugal spread (outbreaks of the disease spread within the municipality, and also, increasingly, in neighboring municipalities), and, inally, pattern of network dissemination (outbreaks of the disease sequentially affecting interconnected municipalities)1,4,6,13,18.
Few municipalities have a rural epidemiological pattern, dominated by rural outbreaks with occurrence of sporadic human cases19.
The centrifugal process of spread of the disease in Araguaína is characterized by important changes in the territory, such as: disorderly expansion of the city – which has advanced through the natural habitat of the vector of VL –, lack of basic and sanitary infrastructure – which enable the urbanization of the vector –, and the spread of the disease in the municipality5,7,17,18,21.
he increase of approximately 30% of the population living in the municipality between the 2000 and 2010 Censuses and the changes of the urban space that are inherent to it can help to explain the maintenance of the high number of human cases of VL notiied in the historical series (2007-2012), although we can observe a wide variation in the number of reported cases over the years. here was an increase of susceptible and vulnerable persons inserted in that territory, as well as individuals – migrants and their animals, for example – from endemic areas for VL8,14,f.
Although the notiication of cases of VL is the main strategy for surveillance of the disease in Brazil, the process of notiication and conirmation of cases can be slow. he HVL is considered a mandatory notiiable disease in the country since 1975. Its vigilance is decentralized and especially uses the data of notiications recorded in the SINAN. he analysis of these data allows the space-temporal monitoring of the disease in the country, subsidizing the actions for its control15.
A correlation was observed between higher incidences of HVL and worse living conditions, although it was not high. Although the TAU presented certain uniformity regarding the indicators analyzed, we could observe clusters from the calculation of Bivariate Local Moran’s I. his approach identiied that the environment in circumscribed areas contributes as a factor of protection or increase for the relative local vulnerability concerning HVL in speciic locations in Araguaína17. his reinforces the theory that the occurrence of HVL is closely
related to the situation of social vulnerabilityg in which parts of the population are inserted18,g.
he use of indicators of vulnerability regarding the territory contributed to the knowledge on the intra-urban diferences more associated with the occurrence of HVL. he analysis of spatial variability based on the combination of these indicators of vulnerability and the incidence of VL allowed the identiication of particularly distinct areas, i.e. with their own socioeconomic characteristics that can contribute to the process of reproduction of the disease in the municipality. Such areas should be the target of local public policies aiming to reduce the vulnerability and decrease the number of cases of the disease in the territory of Araguaína20,h.
he occupation of the urban space arises from the actions of society on the nature. Its coniguration incorporates social and economic structure and its dynamics, establishing the lows of the local movement of goods and services.
f Glória MRB. Leishmaniose visceral: situação epidemiológica e distribuição espacial,
he lack of consistent data about the canine reservoir is one of the limitations of the study. We highlight the annual variation of the areas included in the canine serological surveys conducted by the CCZ of Araguaína and the lack of regularity of the survey in each area for the years of study. he variation of the number of dogs included in the surveys annually has not allowed further evaluations on the seroprevalence of VL.
he scenario of visceral leishmaniasis in Brazil is complex. Researchers need to seek new methodologies of analysis that can cover the various elements involved in the process of introduction, dissemination, and maintenance of the disease. he diiculties related to its control must be considered, from the control of the canine population and vectors and the identiication of infected animals up to the elimination of risk factors.
he use of methodologies that enable the analysis of the living conditions of the population, along with the spatial distribution of human visceral leishmaniasis, becomes essential to identify the areas that present greater vulnerability for the spread and maintenance of the disease in the territory2,10,17.
We believe that this approach may contribute to the deinition of control strategies for VL. It can reduce not only operating costs but also provide increased efectiveness of the actions of surveillance and control of this endemic disease.
REFERENCES
1. Almeida AS, Medronho RA, Werneck, GL. Identification of risk areas for visceral leishmaniasis in Teresina, Piaui State, Brazil. Am J Trop Med Hyg. 2011;84(5):681-7. https://doi.org/10.4269/ajtmh.2011.10-0325
2. Almeida AS, Werneck GL. Prediction of high-risk areas for visceral leishmaniasis using socioeconomic indicators and remote sensing data. Int J Health Geogr. 2014;13(1):13. https://doi.org/10.1186/1476-072X-13-13
3. Anselin L. Exploring spatial data with GeoDaTM: a workbook. Urbana-Champaign: Univesity of
Illinois; 2005.
4. Cardim MFM, Rodas LAC, Dibo MR, Guirado MM, Oliveira AM, Chiaravalloti Neto F. Introdução e expansão da Leishmaniose visceral americana em humanos no estado de São Paulo, 1999-2011. Rev Saude Publica. 2013;47(4):691-700. https://doi.org/10.1590/S0034-8910.2013047004454
5. Cerbino Neto J, Werneck GL, Costa CHN. Factors associated with the incidence of urban visceral leishmaniasis: an ecological study in Teresina, Piauí State, Brazil. Cad Saude Publica. 2009;25(7):1543-51. https://doi.org/10.1590/S0102-311X2009000700012
6. Costa CHN, Werneck GL, Rodrigues Junior L, Santos MV, Araújo IB, Moura LS et al. Household structure and urban services: neglected targets in the control of visceral leishmaniasis. Ann Trop
Med Parasitol. 2005;99(3):229-36. https://doi.org/10.1179/136485905X28018
7. Furlan MBG. Epidemia de leishmaniose visceral no Município de Campo Grande-MS, 2002 a 2006. Epidemiol Serv Saude. 2010;19(1):16-25. https://doi.org/10.5123/S1679-49742010000100003
8. Garcez LM, Cardoso JF, Chagas AP, Miranda JFC, Souza GCR, Soares DC et al. Surveillance of visceral leishmaniasis in epidemiologically distinct locations in Juruti, a mining municipality in Pará State, Brazil. Rev Pan-Amaz Saude. 2010;1(1):107-16. https://doi.org/10.5123/S2176-62232010000100016
9. Gontijo CMF, Melo MN. Leishmaniose visceral no Brasil: quadro atual, desafios e perspectivas.
Rev Bras Epidemiol. 2004;7(3):338-49. https://doi.org/10.1590/S1415-790X2004000300011
10. Gracie R, Barcellos C, Magalhães M, Souza-Santos R, Barrocas PRG. Geographical scale effects on the analysis of leptospirosis determinants. Int J Environ Res Public Health. 2014;11(10):10366-83. https://doi.org/10.3390/ijerph111010366
12. Silva AVM, Magalhães MA, Brazil RP, Carreira JC. Ecological study and risk mapping of leishmaniasis in an endemic area of Brazil based on a geographical information systems approach. Geospat Health. 2011;6(1):33-40. https://doi.org/10.4081/gh.2011.155
13. Maia-Elkhoury ANS, Alves WA, Sousa-Gomes ML, Sena JM, Luna EA. Visceral
leishmaniasis in Brazil: trends and challenges. Cad Saude Publica. 2008;24(12):2941-7. https://doi.org/10.1590/S0102-311X2008001200024
14. Marcondes M, Rossi CN. Leishmaniose visceral no Brasil. Braz J Vet Res Anim Sci.
2014;50(5):341-52. https://doi.org/10.11606/issn.2318-3659.v50i5p341-352
15. Ministério da Saúde, Secretaria de Vigilância em Saúde, Departamento de Vigilância Epidemiológica. Manual de vigilância e controle da leishmaniose visceral. Brasília (DF): Ministério da Saúde; 2014. (Série A. Normas e manuais técnicos).
16. Razaeian M, Dunn G, St Leger S, Appleby L. Geographical epidemiology, spatial analysis and geographical information systems: a multidisciplinary glossary. J Epidemiol Community Health.
2007;61:98-102. https://doi.org/10.1136/jech.2005.043117
17. Silva AVM, Magalhães MA, Brazil RP, Carreira JCA. Ecological study and risk mapping of leishmaniasis in an endemic area of Brazil based on a geographical information systems approach. Geospat Health. 2011;6(1):33-40. https://doi.org/10.4081/gh.2011.155
18. Silva AR, Tauil PL, Cavalcante MN, Medeiros MN, Pires BN, Gonçalves EGR. Situação
epidemiológica da leishmaniose visceral, na Ilha de São Luís, Estado do Maranhão. Rev Soc Bras
Med Trop. 2008;41(4):358-64. https://doi.org/10.1590/S0037-86822008000400007
19. Teles EJC, Soares DC, Gasparetto D, Veiga IN, Fontelles, MJP, Garcez LM. Leishmaniose visceral no Município minerário de Barcarena, Estado do Pará, Brasil: evolução de 2004 a 2008 e bases para a vigilância epidemiológica. Rev Pan-Amaz Saude. 2014;5(2):21-7. https://doi.org/10.5123/S2176-62232014000200003
20. Tibúrcio LH, Corrêa MP. Análise da vulnerabilidade da microrregião de Itajubá por meio do IVG com vistas à mitigação dos impactos causados pelas mudanças climáticas. Ambient Soc.
2012;15(3):123-39. https://doi.org/10.1590/S1414-753X2012000300008
21. Vasconcelos Filho JM, Soares BR. Os conflitos e as contradições na aquisição da moradia social nos enclaves de pobreza urbana no Brasil: uma análise sobre a cidade de Araguaína, TO.
Rev Geogr Am Central. 2011;2(47E):1-14.
22. Werneck GL. Geographic spread of visceral leishmaniasis in Brazil. Cad Saude Publica. 2010;26(4):644-5. https://doi.org/10.1590/S0102-311X2010000400001
Authors’ Contribution: Design and planning of the study: CRST, ASA. Analysis and interpretation of the data: CRST, ASA, SAMC, PCS, LMT, JPC. Review and approval of the inal version of the article: CRST, ASA, SAMC, PCS, LMT, JPC.