1UniversidadeFederal do Rio de Janeiro, Centro de Ciências da Saúde, Departamento de Nutrição Social e Aplicada. Av. Carlos
Chagas Filho, 373, Bloco J, 2º andar, 21941-902, Rio de Janeiro, RJ, Brasil. Correspondência para/Correspondence to: RA PEREIRA. E-mails: <[email protected]>; <[email protected]>.
2UniversidadeFederal do Mato Grosso, Faculdade de Nutrição, Departamento de Alimentos e Nutrição. Cuiabá, MT, Brasil.
Validity of self-reported weight and
stature in adolescents from
Cuiabá
,
Central-Western Brazil
Validade de peso e estatura autorreferidos
em adolescentes de Cuiabá, Região
Centro-Oeste do Brasil
Paulo Rogério Melo RODRIGUES1
Regina Maria Veras GONÇALVES-SILVA2
Rosangela Alves PEREIRA1
A B S T R A C T
Objective
This study assessed the agreement between self-reported and measured weight and stature in adolescents. Methods
Ninety-seven students from public and private high schools of Cuiabá, in the state of Mato Grosso, Brazil (14 to 19 years old), were examined to assess the validity of self-reported weight and stature. The adolescents reported their weight and stature, which were subsequently measured by standard procedures. The body mass index was calculated from both self-reported and measured data. Weight status was classified according to body mass index Z-score and World Health Organization criteria. The differences between the self-reported and measured means were tested by the Student’s paired t-test. Weighted Kappa’s coefficient of agreement was used to assess the variations in weight status categorization using informed and measured data. Agreement between measurements was assessed by the Bland-Altman method and intraclass correlation coefficient. Results
Conclusion
Given the excellent agreement with measured data, self-reported weight and stature are considered valid to be used in epidemiological studies on adolescents of Cuiabá, Mato Grosso, Brazil.
Indexing terms: Agreement. Anthropometry. Body mass index. Intraclass correlation coefficient. Nutritional status.
R E S U M O
Objetivo
Avaliar a concordância entre as medidas de peso e estatura autorreferidas e aferidas em adolescentes.
Métodos
Noventa e sete estudantes de 14 a 19 anos de idade do ensino médio público e privado de Cuiabá, (Mato Grosso) foram examinados a fim de se avaliar a validade de medidas de peso e estatura autorreferidas. Os adolescentes referiram o peso e a estatura e, na sequência, as respectivas medidas foram aferidas com base em procedimentos padronizados. O índice de massa corporal foi determinado a partir das medidas estimadas e aferidas. O status de peso foi classificado com base no escore-Z do índice de massa corporal segundo proposta da Organização Mundial da Saúde. Utilizou-se o teste t de Student pareado para avaliar as diferenças entre as médias das medidas autorreferidas e aferidas. O coeficiente de concordância Kappa ponderado foi utilizado para se avaliarem as variações na categorização do status de peso estimado a partir de medidas informadas e aferidas. A concordância entre as medidas foi avaliada pelo método de Bland-Altman e pelo coeficiente de correlação intraclasse.
Resultados
Não se observaram diferenças entre as médias das medidas autorreferidas e aferidas de peso (p=0,30), estatura (p=0,76) e índice de massa corporal (p=0,47). Houve elevada concordância entre as medidas autorreferidas e aferidas de acordo com o coeficiente de correlação intraclasse (peso: r=0,99; estatura: r=0,96; índice de massa corporal; r=0,97) e segundo o método de Bland-Altman (concordância média: peso=99%; estatura=100%).
Conclusão
Dada a excelente concordância com as medidas aferidas, o peso e a estatura autorreferidos são considerados válidos para serem utilizados em estudos epidemiológicos com adolescentes de Cuiabá.
Termos de indexação: Concordância. Antropometria. Índice de massa corporal. Coeficiente de correlação
intraclasse. Estado nutricional.
I N T R O D U C T I O N
Obesity in childhood and adolescence is a risk factor for the early development of metabolic
complications1, in addition to being strongly
related with excess weight in adulthood2. Hence,
the monitoring of overweight and obesity indicators in children and adolescents is critically important in public health.
Body Mass Index (BMI=weight/stature2) is
widely used for the nutritional assessment of
adolescents in epidemiological studies3 because
weight and stature are relatively easy to measure with simple and low-cost equipment. However, situations in which anthropometric measurements
are unfeasible are not uncommon, whether because of costs or logistics4. Thus, self-reported
information has been used as a proxy of measured data in epidemiological surveys that assess adolescents’ nutritional status5-12.
However, different study designs, sample characteristics, statistical analysis techniques, and socio-cultural factors may cause divergences in studies evaluating the agreement between the measured and self-reported weights and statures of adolescents. So it may not be possible to extrapolate the self-reported and measured agreement found for one population to other groups, especially if they live in distinct
The objective of this study was to assess the agreement between self-reported and measured weights and statures used in the nutritional assessment of adolescents in a school-based study carried out in Cuiabá (MT), Brazil13.
M E T H O D S
A cross-sectional study was performed with a sample of 97 students aged 14 to 19 years from a state public high school, a federal public
high school, and a private high school of Cuiabá,
the capital of the state of Mato Grosso, in Central-Western Brazil. The sample size was estimated using an equation appropriate for validation studies (Equation 1)14:
Where:
n = total number of individuals required for the validation;
Zα = standard deviation for α;
Zβ = standard deviation for β and;
, where r is the
expected correlation coefficient and ln, the
natural logarithm.
Therefore, to estimate a correlation coefficient of at least 0.80, with statistical power of 95% (β=0.05; Zβ=1.65), and significance level
of 99% (α=0.01; Zα=2.33), approximately 16
adolescents would be required for the study. Considering the possibility of non-response bias, the sample size was increased by 30%, totaling 21 adolescents.
Having as base the sample selected for a school-based cross-sectional study carried out in
the same city13, three classes were randomly
selected, one from each of the sample strata (state public schools, federal public school, and private
schools) and all students in each selected class were examined.
All adolescents and/or their parents or legal guardians signed an Informed Consent Form confirming their agreement to participate in the study. The study was approved by the Research
Ethics Committee of Hospital Universitário Júlio
Müller, of Universidade Federal do Mato Grosso under protocol number 459/CEP-HUJM/07. Data collection was also authorized by the schools’ principals.
The adolescents were asked to inform their weight (kg) and stature (m) and were subsequently measured. Weight was measured using an electronic scale (Tanita, model UM-080) with accuracy of 0.1kg and capacity of 150.0kg. Stature was measured by means of a portable
stadiometer (Sanny, São Paulo, Brazil) with
accuracy of 1mm and total length of 210cm. The measurements were done as recommended by the Brazilian Ministry of Health15. The adolescents
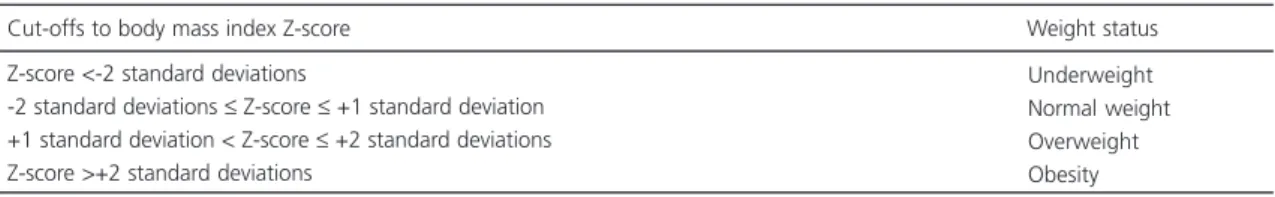
were asked to take off their shoes, use light clothes, and stand upright with the head in the Frankfort plane. Stature was measured twice admitting a maximum difference of 0.5cm between the measurements and the mean of the two measurements was used in the analyses. The weight status of the adolescents was classified according to BMI Z-score as proposed by the
World Health Organization16 (Table 1).
The statistical analyses were performed by the Statistical Package for the Social Sciences version 19.0. The continuous variables were tested by the Kolmogorov-Smirnov test to verify the normality of the distributions. The difference between self-reported and measured data was calculated by subtracting the measured from the self-reported data. The paired Student’s t-test was used for comparing the self-reported and measured weight, stature, and BMI means. Analysis of Variance (ANOVA) was used for assessing the differences according to type of school.
The weighted Kappa coefficient of agreement was used for estimating the In (1 + r)
In (1 – r)
C=0.5*
2
(
Zα + Zβ)
Cagreement between self-reported (BMI calculated from self-reported data) and measured (BMI calculated from measured data) weight status (underweight, normal weight, overweight, and obesity). The following limits determined the degree of agreement: 0.00 to 0.20=slight agreement; 0.21 to 0.40=fair agreement; 0.41 to 0.60=moderate agreement; 0.61 to 0.80=substantial agreement; and 0.81 to
1.00=almost perfect agreement17. Additionally,
the proportion of adolescents categorized in the same weight status category (exact agreement), adjacent categories (adjacent agreement) and opposite categories (disagreement) according to the two measurements (self-reported and measured) was determined.
The Intraclass Correlation Coefficients (ICC) and respective 95% Confidence Intervals (95%CI) were estimated to evaluate the agreement between self-reported and measured data. The ICC estimates the proportion of the total variability that can be attributable to the variability between individuals; it is considered high when greater than 0.7518.
The self-reported and measured weights and statures were transformed into their
logarithms to apply the Bland-Altman method19,
and the mean agreement and Limits Of Agreement (LOA) were estimated. The mean agreement is represented by the mean difference between self-reported and measured data. The LOA provide an interval that contains 95% of the individual differences between the two data. The lower and upper LOA are estimated by: [mean difference ± (1.96 x the standard deviation of the differences between the measurements)]. As the analyzed
data were log transformed, both the mean agreement and LOA are expressed in percentages, since the exponential of a difference is a ratio (x100).
Additionally, simple linear regression models were performed, having the differences between the measures as dependent variables
and the means as independent variables20. In this
analysis, the regression coefficient (β) is expected to be close to zero and not statistically significant, showing that the agreement between the two measurements is not influenced by their magnitude.
R E S U L T S
The study included 97 adolescents with a mean age of 16 years (standard deviation=1 year); 59% were boys, 35% studied in the federal public high school, 34% in a state public high school, and 31% in a private high school (data not shown).
Weight, stature, and BMI distributions
were symmetric (p>0.05; Kolmogorov-Smirnov
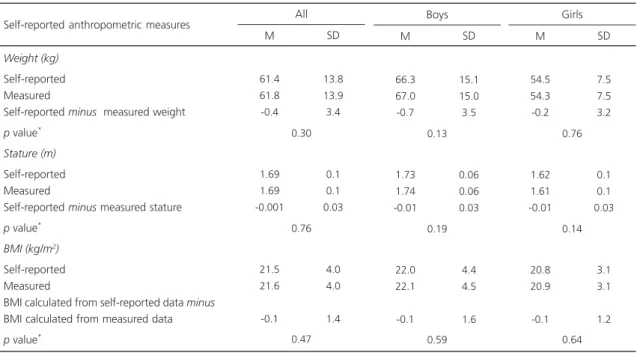
test). There were no significant differences between self-reported and measured weight
(p=0.30), stature (p=0.76), and BMI (p=0.47)
means (Table 2) and the ICCs between those measures were high (>0.90) for all gender, age, and type of school strata (Table 3). Additionally, the self-reported and measured weight, stature, and BMI means did not differ according to gender (p=0.21; p=0.06 and p=0.94, respectively) or age (p=0.33; p=0.26 and p=0.79, respectively) (data not shown).
Table 1. Criteria used for classifying the weight status of the adolescents*.
Z-score <-2 standard deviations
-2 standard deviations ≤ Z-score ≤ +1 standard deviation +1 standard deviation < Z-score ≤ +2 standard deviations Z-score >+2 standard deviations
Underweight Normal weight Overweight Obesity
Note: *Based on the World Health Organization proposal.
There was perfect agreement between the weight status categories estimated from self-reported and measured data (kappa=0.85; 95%CI
0.77; 0.93): underweight (3% vs. 3%), normal
weight (71% vs. 74%), overweight (19% vs.
12%), and obesity (7% vs. 10%). Thus, the exact
agreement between the categories of weight
status was of 86% and the exact agreement plus the adjacent agreement was 100% (data not shown).
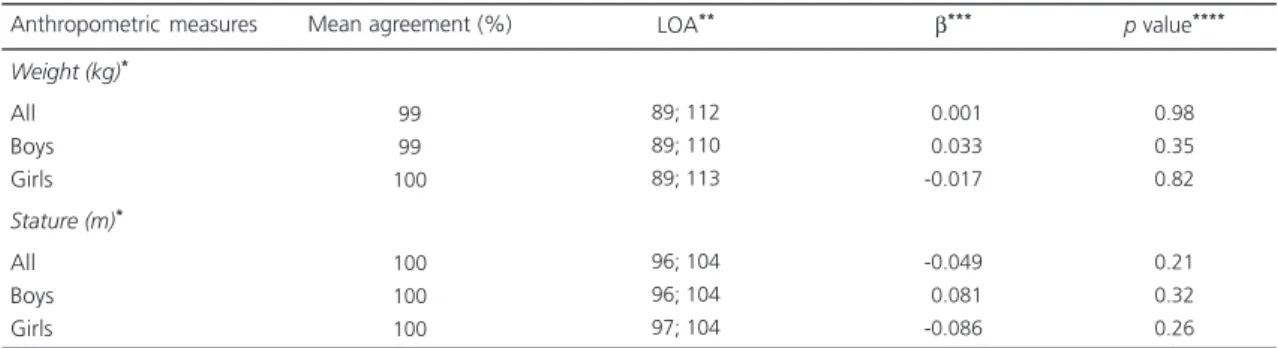
According to the Bland-Altman method19,
weight and stature mean agreements were 99% (LOA=89% and 112%) and 100% (LOA=96% and 104%), respectively. The agreement between
Table 2. Mean and standard deviation of measured and self-reported weights, statures, and body mass indices of the adolescents (n=97). Cuiabá (MT), Brazil, 2008.
Weight (kg)
Self-reported Measured
Self-reported minus measured weight
p value*
Stature (m)
Self-reported Measured
Self-reported minus measured stature
p value*
BMI (kg/m2)
Self-reported Measured
BMI calculated from self-reported data minus
BMI calculated from measured data
p value*
Self-reported anthropometric measures
61.4 61.8 -0.4 1.69 1.69 -0.001 21.5 21.6 -0.1 13.8 13.9 3.4 0.1 0.1 0.03 4.0 4.0 1.4 SD M 0.76 0.30 0.47 All 66.3 67.0 -0.7 1.73 1.74 -0.01 22.0 22.1 -0.1 15.1 15.0 3.5 0.06 0.06 0.03 4.4 4.5 1.6 SD M 0.19 0.13 0.59 Boys 54.5 54.3 -0.2 1.62 1.61 -0.01 20.8 20.9 -0.1 7.5 7.5 3.2 0.1 0.1 0.03 3.1 3.1 1.2 SD M 0.14 0.76 0.64 Girls
Note: *Paired Student’s t-test. M: Mean; SD: Standard Deviation; BMI: Body Mass Index.
Table 3. Intraclass correlation coefficient between self-reported and measured weights, statures, and body mass indices according to gender, age, and type of school (n=97). Cuiabá (MT), Brazil, 2008.
All Gender
Male Female
Age (years)
14 - 16 17 - 19
Type of high school
State Federal Private Adolescents’ characteristics 0.99 0.99 0.95 0.99 0.98 0.98 0.98 0.99 0.98-0.99 0.98-0.99 0.91-0.97 0.98-0.99 0.97-0.99 0.96-0.99 0.97-0.99 0.98-0.99 Weight ICC 95%CI 0.96 0.91 0.94 0.96 0.97 0.97 0.97 0.95 0.94-0.98 0.85-0.95 0.89-0.97 0.94-0.98 0.93-0.98 0.95-0.99 0.94-0.99 0.90-0.98 Stature ICC 95%CI 0.97 0.97 0.96 0.97 0.96 0.97 0.97 0.96 0.95-0.98 0.95-0.98 0.92-0.98 0.95-0.98 0.92-0.98 0.93-0.98 0.94-0.98 0.92-0.98 BMI ICC 95%CI
the self-reported and measured data did not vary
with data magnitude for weight (β=0.001;
p=0.98) or stature (β=-0.049; p=0.21). Similar
results were obtained for the adolescents stratified by gender (Table 4).
D I S C U S S I O N
This study evaluated self-reported weight and stature, considered valid for use in epidemiological studies with adolescents from Cuiabá (MT), Brazil. High school students of Cuiabá (MT), Brazil were able to report reliable weight and stature measures, which were highly concordant with measured weight and stature according to various statistical procedures used for assessing agreement.
In the present study, there were no statistical differences between the boys’ and girls’ mean self-reported and measured weights, statures, and BMI. Similar results were obtained
by Wang et al.5 while studying Australian
adolescents; nevertheless, the agreement between self-reported and measured weights and statures of different populations may diverge, especially among adolescents. Analogous studies have shown that adolescents tend to underestimate weight and overestimate stature when reporting anthropometric data, resulting in underestimated
BMI. Fonseca et al.11 assessed the agreement
between BMI calculated from self-reported and measured weights and statures in Portuguese
adolescents and found that, on average, weight was underestimated by -0.99kg, stature was overestimated by 0.70cm, and BMI was
underestimated by -0.55kg/m2. Comparable
results were obtained by Zhou et al.12 who found
that Chinese adolescents underestimated their weight by -2.35kg and overestimated their stature by 1.36cm; consequently, BMI was underestimated by -1.23kg/m2. Farias-Júnior9 also found that, on
average, boys from Florianópolis (SC) (Southern
Brazil) underestimated their weight by -0.26kg
and girls, by -0.87kg (p=0.02). Conversely, those
boys overestimated their stature by 0.08cm and girls, by 0.92cm (p=0.01)9. Brug et al.8 assessed
Dutch adolescents (13 to 19 years old) and found that both boys and girls overestimated their weight; nevertheless, overestimation of weight was higher among girls than among boys.
The high agreement between weight status evaluated from self-reported weight and stature, and weight status analyzed from measured weight and stature indicates that self-reported measurements can be used in epidemiological studies that assess the weight
status of adolescents from Cuiabá (MT), as seen
in other studies7,9,11. Yet, these results differ from
those observed by other authors. Brener et al.6
assessed adolescents from the district of Columbia and found that the overweight prevalence was underestimated when the classification of weight status relied on BMI calculated from self-reported weight and stature. Zhou et al.12 concluded that Table 4. Mean agreement and Limits Of Agreement (LOA) of the measured and self-reported weights and statures of adolescents
(n=97). Cuiabá (MT), Brazil, 2008.
Weight (kg)*
All Boys Girls
Stature (m)*
All Boys Girls
Anthropometric measures
99 99 100
100 100 100
89; 112 89; 110 89; 113
96; 104 96; 104 97; 104
-0.001 -0.033 -0.017
-0.049 -0.081 -0.086
0.98 0.35 0.82
0.21 0.32 0.26
Mean agreement (%) LOA** β*** p value****
Note: *Data were log-transformed for the agreement analysis; **LOA determined as mean difference ± 1.96 x standard deviation of the differences; ***Slope of the differences between the methods regressed on the averages of the methods. (H
0: β=0; α=0.05);
weight and stature reported by Chinese adolescents should be used with caution, considering the sensitivity of self-reported measurements for detecting overweight (56%) in spite of the estimated high weighted Kappa coefficients (weight=0.859; stature=0.906; BMI=0.754).
In this study, the accuracy of adolescents’ self-reported weight and stature (and estimated BMI) was not affected by their ages, similar to
the findings of Farias-Júnior9 when Southern
Brazilian adolescents were evaluated. However, it should be pointed out that the present study only included adolescents aged 14 years or more, which may have favored the results, since Himes et al.7 observed that the accuracy of self-reported
weight and stature increased with age among adolescents from Minnesota aged 12 to 18 years.
In the present study, the agreement between self-reported and measured weights and statures according to ICC was high. These results
are similar to those found by Farias-Júnior9, who
reported ICCs of 0.96, 0.95 and 0.94 for weight, stature and BMI, respectively. On the other hand,
Zhou et al.12 found slightly lower ICCs: 0.85
(weight), 0.90 (stature), and 0.80 (BMI). Other studies with adolescents that estimated the Pearson’s correlation coefficients also found high correlations between self-reported and measured data6,7,11.
The slight differences observed between the self-reported and measured weights and statures may stem from the fact that the adolescents reported their data considering a measurement made in the past. Thus, information about the last occasion that the adolescent had his/her weight and stature measured may be useful in this type of study as a confounder to be controlled.
Even though Page et al.21 reported that
adolescents may measure their weight and stature frequently because of their excessive concern with body image and hope for a “perfect body,” a characteristic of the contemporary Western
society9, anthropometric variables may not be
measured as often as desirable among adolescents, which, coupled with their fast growth, may cause them to have outdated information about their weight and stature9,22.
In this study, the sample size far exceeded that required for generalizing the results for high
school adolescents from Cuiabá (MT). Moreover,
the fact that the studied adolescents were probabilistically selected using a school-based study sample minimizes the chance of selection bias and optimizes the sample’s representativeness.
C O N C L U S I O N
Comparing the study results with those of similar studies with adolescents living in different locations indicates the need of studies assessing the accuracy of self-reported weight and stature prior to the use of these measures. Identifying the characteristics associated with differences in self-reported weight and stature helps to reduce information bias and enhance the quality of adolescents’ weight status classification.
When financial or logistic restrictions prevent the measurement of weight and stature, self-reported measures can be used as a valid alternative to calculate the BMI of adolescents
from Cuiabá (MT), Brazil. Therefore, the present
results support the hypothesis that BMI calculated from self-reported weight and stature may be used in epidemiological and surveillance studies assessing the weight status of high school adolescents in this city.
C O L L A B O R A T O R S
R E F E R E N C E S
1. Cali AMG, Caprio S. Obesity in children and adolescents. J Clin Endocrinol Metab. 2008; 93(1 Suppl):S31-S6. doi: 10.1210/jc.2008-1363. 2. Rooney BL, Mathiason MA, Schauberger CW.
Predictors of obesity in childhood, adolescence, and adulthood in a birth cohort. Matern Child Health J. 2011; 15(8):1166-75. doi: 10.1007/s10995-010-0689-1.
3. Gomes FS, Anjos LA, Vasconcellos MTL. Anthropometry as a tool for assessing the nutritional status of adolescents. Rev Nutr. 2010; 23(4):591-605. doi: 10.1590/S1415-5273201000 0400010.
4. Silveira EA, Araújo CL, Gigante DP, Barros AJD, Lima MS. Weight and height validation for diagnosis of adult nutritional status in Southern Brazil. Cad Saúde Pública. 2005; 21(1):235-45. doi: 10.1590/ S0102-311X2005000100026.
5. Wang Z, Patterson CM, Hills AP. A comparison of self-reported and measured height, weight and BMI in Australian adolescents. Aust N Z J Public Health. 2002; 26(5):473-8. doi: 10.1111/j.1467-842X.20 02.tb00350.x.
6. Brener ND, McManus T, Galuska DA, Lowry R, Wechsler H. Reliability and validity of self-reported height and weight among high school students. J Adolesc Health. 2003; 32(4):281-7. doi: 10.1016/S1 054-139X(02)00708-5.
7. Himes JH, Hannan P, Wall M, Neumark-Sztainer D. Factors associated with errors in self-reports of stature, weight, and body mass index in Minnesota adolescents. Ann Epidemiol. 2005; 15(4):272-8. doi: 10.1016/j.annepidem.2004.08.010.
8. Brug J, Wammes B, Kremers S, Giskes K, Oenema A. Underestimation and overestimation of personal weight status: Associations with socio-demographic characteristics and weight maintenance intentions. J Hum Nutr Diet. 2006; 19(4):253-62. doi: 10.1111/ j.1365-277X.2006.00707.x.
9. Farias-Júnior JC. Validity of self-reported weight and height for adolescent nutritional status diagnosis. Rev Bras Saúde Matern Infant. 2007; 7(2):167-74. doi: 10.1590/S1519-38292007000200007. 10. Araújo CL, Dumith SC, Menezes AMB, Hallal PC.
Measured weight, self-perceived weight, and associated factors in adolescents. Rev Panam Salud Pública. 2010; 27(5):360-7. doi: 10.1590/S1020-49 892010000500006.
11. Fonseca H, Silva AM, Matos MG, Esteves I, Costa P, Guerra A, et al. Validity of BMI based on self-reported weight and height in adolescents. Acta Paediatr. 2010; 99(1):83-8. doi: 10.1111/j.1651-2 227.2009.01518.x.
12. Zhou X, Dibley MJ, Cheng Y, Ouyang X, Yan H. Validity of self-reported weight, height and resultant body mass index in Chinese adolescents and factors associated with errors in self-reports. BMC Public Health. 2010; 10:190. doi: 10.1186/14 71-2458-10-190.
13. Pivetta LA, Gonçalves-Silva RMV. Binge eating and associated factors among teenagers in Cuiabá, Mato Grosso State, Brazil. Cad Saúde Pública. 2010; 26(2):337-46. doi: 10.1590/S0102-311X201000 0200012.
14. Browner WS, Newman T, Cummings SR, Hulley SB. Estimating Sample Size and Power: The Nitty-gritty. In: Hulley SB, Cummings SR, Browner WS, Grady DG, Hearst N, Newman TB, editors. Designing clinical research. 2nd ed. Philadephia: Lippincott Williams & Wilkins; 2001.
15. Brasil. Ministério da Saúde. Vigilância alimentar e nutricional - SISVAN: orientações básicas para a coleta, processamento, análise de dados e informa-ção em serviços de saúde. Brasília: MS; 2004. 16. Onis M, Onyango AW, Borghi E, Siyam A, Nishida
C, Siekmanna J. Development of a WHO growth reference for school-aged children and adolescents. Bull World Health Organ. 2007; 85:660-7. doi: 10.2471/BLT.07.043497.
17. Landis JR, Koch GG. The measurement of observer agreement for categorical data. Biometrics. 1977; 33:159-74.
18. Fleiss JL. Statistical methods for rates and proportions. 2nd ed. New York: John Wiley & Sons; 1999.
19. Bland JM, Altman DG. Statistical methods for assessing agreement between two methods of clinical measurement. Lancet. 1986; 8:307-10. 20. Bland JM, Altman DG. Measuring agreement in
method comparison studies. Stat Methods Med Res. 1999; 8(2):135-60. doi: 10.1177/096228029 900800204.
21. Page RM, Lee C, Miao N. Assessing prevalence of overweight and obesity through self-reports of height and weight by high school students in Taipei, Taiwan. J Sch Health. 2004; 74(10):401-7. doi: 10.1 111/j.1746-1561.2004.tb06606.x.
22. Abraham S, Luscombe G, Boyd C, Olesen I. Predictors of the accuracy of self-reported height and weight in adolescent female school students. Int J Eat Disord. 2004; 36(1):76-82. doi: 10.1002/ eat.20015.