33
Universidade de São Paulo Faculdade de Saúde Pública
VO LU M E 33
N Ú M ERO 1
FEVEREIRO 1999
© Copyright Faculdade de Saúde Pública da USP. Proibida a reprodução mesmo que parcial sem a devida autorização do Editor Científico. Proibida a utilização de matérias para fins comerciais. All rights reserved.
Revista de Saúde Pública
Journal of Public Health
p. 16-23
Reliability of self-reported weight and height
among State bank employees
Confiabilidade da informação de peso e
estatura em funcionários de banco estatal
D óra Chor, Evandro da Silva Freire Coutinho and Ruy Laurenti
Departamento de Epidemiologia da Escola Nacional de Saúde Pública. Rio de Janeiro, RJ – Brasil (D.C., E.S.F.C.), Departamento de Epidemiologia da Faculdade de Saúde Pública da Universidade de São Paulo. São Paulo, SP – Brasil (R.L.)
Abstract
Introduction
Self-reported weight and height were compared with direct measurements in order to evaluate the agreement between the two sources.
Methods
Data were obtained from a cross-sectional study on health status from a probabilistic sample of 1,183 employees of a bank, in Rio de Janeiro State, Brazil. Direct measurements were made of 322 employees. Differences between the two sources were evaluated using mean differences, limits of agreement and intraclass correlation coefficient (ICC).
Results and Conclusion
Men and women tended to underestimate their weight while differences between self-reported and measured height were insignificant. Body mass index (BMI) mean differences were smaller than those observed for weight. ICC was over 0.98 for weight and 0.95 for BMI, expressing close agreement. Combining a graphical method with ICC may be useful in pilot studies to detect populational groups capable of providing reliable information on weight and height, thus minimizing resources needed for field work.
Resumo
Introdução
Peso e estatura informados através de questionário autopreenchido foram comparados à medida direta, com o objetivo de avaliar a concordância entre as duas fontes.
Métodos
Estudo transversal sobre condições de saúde e fatores de risco cardiovasculares, realizado em amostra aleatória simples de 1.183 funcionários de um banco no Estado do Rio de Janeiro, Brasil. As medidas diretas foram tomadas em 322 funcionários de quatro unidades do banco. As diferenças entre medida e informação de peso e estatura foram avaliadas através de diferenças médias, “limites de concordância”, gráficos, e ainda do coeficiente de correlação intra-classe (CCIC).
Reliability of self-reported weight and height
among State bank employees
Confiabilidade da informação de peso e
estatura em funcionários de banco estatal
D óra Chor, Evandro da Silva Freire Coutinho and Ruy Laurenti
Departamento de Epidemiologia da Escola Nacional de Saúde Pública. Rio de Janeiro, RJ – Brasil (D.C., E.S.F.C.), Departamento de Epidemiologia da Faculdade de Saúde Pública da Universidade de São Paulo. São Paulo, SP – Brasil (R.L.)
Keywords
Obesity, epidemiology. Data collection. Body weight. Workers.
D escritores
Obesidade, epidemiologia. Coleta de dados.
Peso corporal. Trabalhadores.
Correspondence to:
Dóra Chor
Rua Leopoldo Bulhões, 1480 - 8o andar
21041-210 Rio de Janeiro, RJ - Brasil. E-mail: dorinha@ensp. fiocruz.br
Reliability of self-reported w eight and height Chor, D. et al. Rev. Saúde Pública, 33 (1), 1999
www.fsp.usp.br/ ~rsp
17
Resultados e Conclusão
Homens e mulheres tenderam a subestimar o peso, sendo este comportamento mais marcante entre os homens de peso mais elevado. Em relação à estatura, as diferenças entre informação e medida foram irrelevantes. Ao se considerar o índice de massa corporal (IMC), as diferenças médias entre medida e informação foram menores do que no caso isolado do peso. Os CCIC situaram-se acima de 0,98 para o peso e de 0,95 para o IMC, indicando elevada concordância. Concluiu-se que grupos populacionais específicos podem fornecer informação confiável e barata para estudos epidemiológicos relacionados à obesidade. O método gráfico utilizado permitiu a visualização de vieses e padrões distintos de confiabilidade segundo diferentes estratos e níveis da variável mensurada. O CCIC forneceu um índice sumário da confiabilidade entre as medidas. A utilização simultânea de ambos os métodos é vantajosa, e pode permitir que, através de estudos-piloto, boa confiabilidade da informação de peso e estatura seja estimada em grupos populacionais específicos. Neste caso, estaria justificada a utilização da informação em lugar da medida direta, economizando recursos e simplificando o trabalho de campo.
IN TRO D U CTIO N
Obesity has been increasingly related to chronic health problems like cardiovascular disease, diabetes and cancer13
. There is evidence that average body weight has been increasing during the last decades in several countries12
. In a study carried out in 19898
, prevalence of overweight in Brazil was 27% for men and 38% for women over 18 years of age. In fact, changes in nutritional status in Brazil are impressive: between 1974/1975 and 1989, prevalence of overweight and obesity in men increased 56.3% and 92.0%, respectively; women showed increments of 39.7% and 69.6% in the same period19. As a
consequence of these considerable changes, weight, height and body mass index (BMI) have been increasing by stressed in epidemiological research.
Direct methods such as body density and total potassium can be used to classify individuals as obese (excess of body fat)6. Nevertheless, most clinical and
epidemiological investigations have used BMI, which can be calculated very easily. BMI can be considered a proxy measurement for the amount of fat, as body constitution can vary between individuals with the same weight and height13. Its limitations are
related to the fact that BMI does not measure the body fat distribution, which has been related to the risk of coronary disease, and does not distinguish lean body mass, fat body mass and edema10,13. Taking
these limits into account, individuals with BMI over a specific cut-off level are classified as obese, as there is a high correlation between this index and direct measurement of body fat. Another advantage of the BMI is that it is not related to height. According to
Anjos2, BMI seems to be a valid index for measuring
nutritional status in populational groups and has been widely used for this purpose.
Although direct measurements of weight and height can be easily obtained, they are not always collected. In this case, self-information is used. Comparing self-information with direct measurement is essential and several studies have shown its validity in Brazil and in other countries5,15,16,20
.
In the present paper self-reported weight, height and estimated BMI are compared with the direct measurement of a group of employees in a State Bank in Brazil. Measures of reliability were estimated and their advantages and disadvantages are discussed.
M ETH O D S
Study Design
Direct Measurements
Weight was measured after the questionnaire has been filled out. Portable electronic scales (Filizola) were used on flat, hard surfaces. Individuals took off their shoes and removed all objects from their pockets. Measurements were recorded in kilograms and grams (intervals=100 g). Height was measured using a metallic tape (Stanley) fixed on the wall according to instructions. Height was recorded in meters and centimeters (intervals=1 cm).
Training of Examiners
Measurements were taken by two researchers trained according to the methods proposed by Habicht9. Training sessions included repeated
measurements made by each research assistant at intervals of 15 min. These measurements were compared to those performed by the instructor, used as the gold standard. Intra-rater comparisons evaluated reliability, and differences between research assistants and instructor were used to evaluate validity.
Data Analysis
Errors in reporting weight and height were calculated by the difference between self-reported and direct measurements. Positive values represent an overestimation and negative values represent underestimation of the true value.
Self-reported and direct measurements were also compared using the methodology proposed by Bland and Altman4
and Altman1
, which consists of a graphical display of the differences (self-reported - measured) against their mean (self-reported + measured / 2), the limits of agreement and respective confidence intervals. The limits of agreement are estimated by the mean difference ± (1.96 * standard deviation of the differences), assuming the differences are normally distributed. Confidence intervals for these limits are calculated by the limits of agreement ± (t * standard error of the limit), where t-value is provided by the t-Student distribution with n - 1 degrees of freedom and significance level of 95%. The standard error of the limits of agreement is approximated by (3s2/n)1/2,
where n represents the sample size and s is the standard deviation of the differences.
Agreement between information and direct measurement was also investigated using the
intraclass correlation coefficient (ICC), which is appropriate for continuous variables, like weight and BMI. It has a simple and direct interpretation and can vary from -1 to + 117
. The coefficient was estimated using information on mean squares obtained from the analysis of variance (ANOVA) table, where each individual was regarded as a level of the factor “INDIVIDUAL”. Two-way ANOVA was used as the information on weight and BMI was obtained using the same sources (questionnaire and direct measurement) for every participant. Individuals and researchers were regarded as a random factor (the opposite of fixed) as they were selected to represent the target population. ICC was calculated using the following expression18.
IC =
where BMS = between targets mean square EMS = mean square expectations
JMS = between judges mean square n = number of targets
k = measurement sources
BMS, EMS and JMS were obtained using SPSS for Windows 6.1214 for: statistics/scale/reliability
analysis/statistics/F test.
RESU LTS
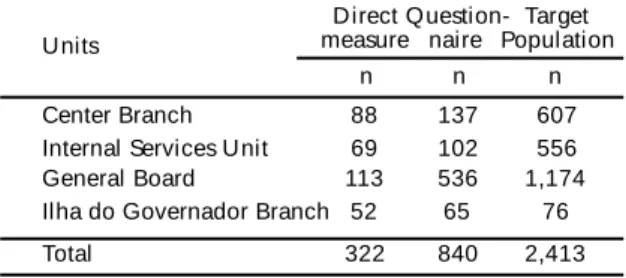
Weight and height were measured in a subsample of 322 employees (51% of men) in four units of the bank, of the 1,183 who filled out the self-reported questionnaire (Table 1). Mean age was 38.5 years with a median of 39.3. Educational level was high: 89.0% of the population had been to university, although not all had finished it.
Self-reported weight was underestimated as compared to direct measurement for men and women
BMS-EMS
BMS+(k-1)EMS+k(JMS-EMS)/n
Table 1 - Distribution of employees by unit and source of information.
Direct Question- Target
Units measure naire Population
n n n
Center Branch 88 137 607
Internal Services Unit 69 102 556
General Board 113 536 1,174
Ilha do Governador Branch 52 65 76
Reliability of self-reported w eight and height Chor, D. et al. Rev. Saúde Pública, 33 (1), 1999
www.fsp.usp.br/ ~rsp
19
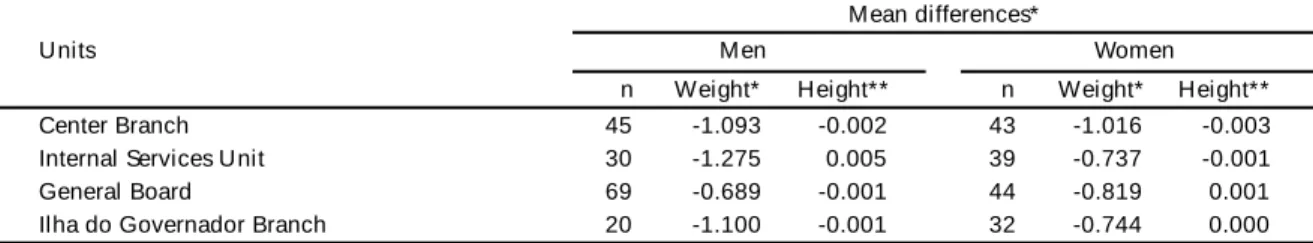
from all four units. Maximum mean differences were -1.016 kg and -1.275 kg for women and men, respectively (Table 2). There was no uniform pattern for height, and differences were considered insignificant.
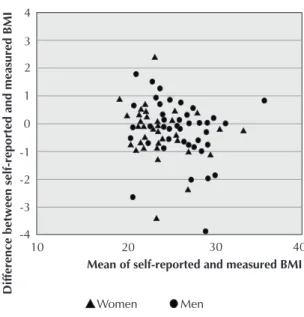
Figures 1-4 present the differences between self-reported and directly measured weight plotted against their means (self-reported + measured / 2). All units showed a trend for underestimation as there were
Table 2 - M ean differences between self-reported and measured weight and height by unit and under gender. M ean differences*
Units M en Women
n Weight* Height** n Weight* Height**
Center Branch 45 -1.093 -0.002 43 -1.016 -0.003
Internal Services Unit 30 -1.275 0.005 39 -0.737 -0.001
General Board 69 -0.689 -0.001 44 -0.819 0.001
Ilha do Governador Branch 20 -1.100 -0.001 32 -0.744 0.000
* Self-reported w eight - M easured w eight/n (kilograms) ** Self-reported height - M easured height/n (meters)
Figure 1 - M ean and difference between self-reported and measured weight (Center Branch).
Figure 2 - M ean and difference between self-reported and measured weight (Internal Services Unit).
Figure 3 - M ean and difference between self-reported and measured weight (General Board).
more points under the horizontal line representing the zero value (which means no difference between self-reported and measured values). Moreover, it was possible to identify distinct patterns of agreement for men and women, which were also dependent on weight values. At Central Branch (Figure 1) most women underestimated their weight, regardless of its value. For men, there was no trend below 80 kg. Above this value, men tended to underestimate their weight. In the Ilha do Governador Branch the same trend was observed for men.
Although the mean difference between self-reported and measured weight was never greater than 1.275 kg (see Table 2), the limits of agreement (mean difference ± 1.96 * sd) ranged from -5.8 kg to +3.8 kg. Thus 95% of the differences must be within these limits, meaning that self-reporting can underestimate weight by almost 6.0 kg or overestimate it by almost 4.0 kg (Table 3). If one takes into account the confidence intervals of the limits of agreement, the difference may be even greater.
When the BMI was studied instead of weight, the mean differences, limits of agreement and confidence intervals were found to be smaller (Tables 4 and 5).
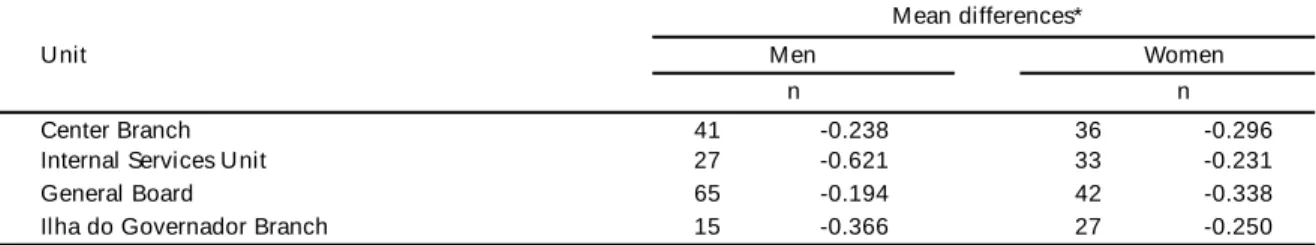
The BMI estimated on the basis of self-reported information was also understated, and the mean differences in the four units ranged from -0.621 kg/ m2
to -0.194 kg/m2
(Table 4). The limits of agreement ranged from -2.29 kg/m2 to 1.74 kg/m2 (Table 5).
Figures 5 to 8 present closer agreement for the BMI than for weight. Actually, 75% of the disagreements were under 0.237 kg/m2 at the Center
Branch, 0.292 kg/m2 at the Internal Services unit,
0.302 at the General Board, and 0.173 kg/m2 at the
Ilha do Governador Branch. Differently from the trend observed for self-reported weight in some units, no systematic error concerning the information on BMI was found.
Agreement between measured and self-reported weight was almost perfect (Table 6). The intraclass correlation coefficients (ICC) were over 0.98 at all units. These coefficients were also very high for BMI (over 0.95). Although mean differences were smaller for BMI than for weight, ICC were smaller for BMI, employing lower levels of reliability. This difference is probably to be explained by the fact that variability was smaller for BMI than for weight, which influenced ICC values.
Table 5 - Limits of agreement and confidence intervals for BM I by unit (kg/m2).
Limits of Confidence Intervals
Unit
agreement lower limit upper limit
Center Branch -2.270 - 1.740 -2.672 - -1.868 1.338 - 2.142
Internal Services Unit -2.290 - 1.478 -2.719 - -1.860 1.047 - 1.907
General Board -1.647 - 1.145 -1.883 - -1.410 0.908 - 1.381
Ilha do Governador Branch -1.615 - 1.031 -1.979 - -1.251 0.667 - 1.395
Table 3 - Limits of agreement and confidence intervals for weight by unit (kg).
Limits of Confidence intervals
Unit agreement
lower limit upper limit
Center Branch -5.382 - 3.269 -6.239 - -4.527 2.413 - 4.125
Internal Services Unit -5.799 - 3.757 -6.858 - -4.741 2.699 - 4.816
General Board -4.183 - 2.700 -4.762 - -3.603 2.121 - 3.280
Ilha do Governador Branch -3.965 - 2.201 -4.793 - -3.137 1.373 - 3.029
Table 4 - M ean differences between self-reported and measured BM I by unit and gender.
M ean differences*
Unit Men Women
n n
Center Branch 41 -0.238 36 -0.296
Internal Services Unit 27 -0.621 33 -0.231
General Board 65 -0.194 42 -0.338
Ilha do Governador Branch 15 -0.366 27 -0.250
Reliability of self-reported w eight and height Chor, D. et al. Rev. Saúde Pública, 33 (1), 1999
www.fsp.usp.br/ ~rsp
21
D ISCU SSIO N
Agreement between self-reported and measured weight was very high among employees of the State
Bank. The mean of the differences between the two sources ranged from -0.741 kg (sd=1.76 kg) to -1.057 kg (sd=2.21 kg). Agreement measured by the intraclass correlation coefficient (ICC) was also very high not only for weight, but also for body mass index (BMI). It is unlikely that the high reliability observed could be explained by the fact that employees knew that their information would be compared to direct measurements. This hypothesis is based on the lack of difference between mean BMI in the group that was investigated with direct measurements and the one without it (p>0.10)7. Those findings suggest that
Table 6 - Intraclass correlation coefficient for self-reported and measured weight and BM I by unit.
Unit Weight BM I
Center Branch 0,984 0,949
Internal Services Unit 0,989 0,980
General Board 0,992 0,979
Ilha do Governador Branch 0,992 0,984
Figure 5 - M ean and difference between self-reported and measured BM I (Center Branch).
Figure 6 - M ean and difference between self-reported and measured BM I (Internal Services Unit).
Figure 7 - M ean and difference between self-reported and measured BM I (General Board).
self-reported weight and height can provide reliable information for epidemiological studies on overweight and obesity in groups with a high level of education and health care.
Despite the small magnitude, the means of the difference between self-reported and measured weight in our population were greater than that observed by Schmidt et al.16 in a sample of the general
population of Porto Alegre, in Southern Brazil, between 15 and 64 years old (mean=-0.06 kg; sd=3.16 kg). Another difference between these studies was that, in Porto Alegre, women tended to underestimate their weight and men to overestimate it, according to a pattern identified by others15. In
this case, employees from the State Bank tended to underestimate their weight, independently of gender. It is important to emphasize that, despite criticisms3,4,11, Pearson’s correlation coefficient has
been used as an index of reliability. Its main problem arised from the fact that Pearson’s coefficient measures correlation or linear relatedness, and not agreement. Consequently, Pearson’s coefficient can reach high values when there is disagreement between two measurements, since the bias is systematic. If one rater finds values that are twice as great as those of another rater (multiplicative bias), Pearson’s coefficient can reach its maximum value of +1. The same will happen if one rater finds values that are always two units above the values found by the other (additive bias). It is not correct to say that there is perfect agreement between the two raters.
The graphical method proposed by Bland and Altman4
provides the visualization of both
multiplicative and additive bias by the existence of points plotted above or below the horizontal line passing through the zero on the y-axis. Moreover, the presence of a heterogeneous pattern of reliability through different levels of the measured variable can be more easily identified by a quick look at the graph. In Figure 1, the distribution of the points suggested that women were more likely to underestimate their weights, but men usually did so if they were over 80 kg.
One limitation of the method proposed by Bland and Altman 4 is the absence of a standardized index
summarizing the agreement between the two sources of measurement. Nevertheless, one can deal with this limitation by using the intraclass correlation coefficient (ICC) which “combines a measure of correlation with a test in the difference of means”20.
In regression language, the intraclass correlation coefficient “assesses not only similarity of slopes, but also similarity of intercepts”11. So, differently
from Pearson’s coefficient, the ICC is not affected by systematic bias.
Combining the graphical approach of Bland and Altman4 with ICC allows the identification of
heterogeneous patterns of agreement. The presence of heterogeneity indicates the need to estimate ICC for different level of the variable studied (for example, below and above 80 kg for men). The two methods may complement each other in pilot studies aiming to evaluate the agreement between self-reported and measured weight and height. Identifying groups with reliable information for those variables may justify the use of self-reported values, thus making field work cheaper and easier.
REFEREN CES
1. Altman DG. Practical statistics for medical research. London: Chapman & Hall; 1993. Some common problems in medical research; 396-433.
2. Anjos LA. Índice de massa corporal como indicador do estado nutricional de adultos: revisão da literatura. Rev
Saúde Pública 1992; 26: 431-6.
3. Bartko JJ, Carpenter WT. On the methods and theory of reliability. J Nervous Mental Dis 1976; 163: 307-17.
4. Bland JM, Altman DG Statistical methods for assessing agreement between two methods of clinical measurement.
Lancet 1986; 1:307-9.
5. Bowlin SJ. Validity of cardiovascular disease risk factors assessed by telephone survey: the behavioral risk factor survey. J Clin Epidem 1993;46: 561-71.
6. Bray G.A. Obesity: definition, diagnosis and disadvantages.
Med J Australia 1995; 142 Suppl:52-8.
7. Chor D. Perfil de risco cardiovascular em funcionários
de banco estatal. São Paulo; 1997. [Tese de Doutorado
-Faculdade de Saúde Pública da USP]
8. Coitinho DC, Leão MM, Recine E, Everhart JE. Condições
nutricionais da população brasileira: adultos e idosos.
Reliability of self-reported w eight and height Chor, D. et al. Rev. Saúde Pública, 33 (1), 1999
www.fsp.usp.br/ ~rsp
23
9. Habicht JP Estandardización de métodos epidemiológicos quantitativos sobre el terrén. Bol Ofic Sanit Panamer 1978; 76:375-81.
10. Hortobagyi T, Israel RG, O’Brien KF. Sensitivity and specificity of the Quetelet index to assess obesity in men and women. European J Clin Nutr 1994;48:369-75.
11. Kramer MS, Feinstein AR Clinical biostatistics: the biostatis-tics of concordance. Clin Pharmacoll Ther 1981;29: 111-23.
12. Meisler JG, St.Jeor S. Foreword. Am J Clin Nutr 1996; 63 Suppl:4095-115.
13. National Institutes of Health Consensus Development Conference Statement. Health implications of obesity. Ann
Internal Med 1995; 103:147-51.
14. Norusis MS. SPSS for windows: base system user’s guide. Chicago; 1992.
15. Palta M, Prineas RJ, Berman R, Hannan P . Comparison of self-reported and measured height and weight. Am J
Epidem 1982; 115:223-30.
16. Schmidt MI, Duncan BB, Tavares M, Polanczyk CA, Pellanda L, Zimmer PM. Validity of self-reported weight - a study of urban Brazilian adults.
Rev Saúde Pública 1993; 27: 271-6.
17. Shrout PE Reliability. In: Tsuang MT, Tohen M, Zahner GEP. Textbook in psychiatric
epidemiology. New York: John Wiley & Sons;
1995. p. 213-27.
18. Shrout PE, Fleiss JL. Intraclass correlations: uses in assessing rater reliability. Psychol Bull 1979; 86: 420-8.
19. Sichieri R, Coitinho DC, Leão MM, Recine E, Everhart JE High temporal, geographic, and income variation in body mass index among adults in Brazil. Am J Public Health 1994; 85:793-8.