Revista Matéria, v. 15, n. 4, pp. 488 – 505, 2011 http://www.materia.coppe.ufrj.br/sarra/artigos/artigo11415
Selection of high strength natural fibers
S.N. MonteiroI, K.G. SatyanarayanaII; A.S. FerreiraI, D.C.O. NascimentoI, F.P.D. LopesI I.L.A. SilvaI, A.B. BevitoriI, W.P. Inácio, J. Bravo NetoI, T.G. PortelaI
I
Laboratory for Advanced Materials, LAMAV; State University of the Northern Rio de Janeiro, UENF; Av.Alberto Lamego, 2000, 28013-602, Campos dos Goytacazes, RJ, Brazil
II Visiting Researcher, PIPE/Department of Chemistry, Federal University of Paraná, Po. Box 19081, Jardim das Americas, CEP: 81531-980, Curitiba, PR, Brazil.
e-mail: [email protected] ; [email protected] ; [email protected].
ABSTRACT
By means of dimensional selection of natural lignocellulosic fibers, based on precise diameter measurements, it was recently possible to obtain fibers with relatively higher tensile strength. The present article overviews works on the statistical evaluation, through the Weibull analysis, of the ultimate tensile stress of eight lignocellulosic fibers: sisal, ramie, curaua, jute, bamboo, coir, piassava and buriti. It is shown that, for all of these fibers, the tensile strength holds an inverse relationship with the fiber diameter. Statistically this relationship conforms to a hyperbolic type of analytical equation, which discloses the possibility of unusually high strength fibers to be selected in association with very small diameters. A structural analysis using scanning electron microscopy offered an explanation to the strengthening mechanisms responsible for the superior performance of these dimensionally selected fibers.
Keywords: Lignocellulosic fibers, polymeric composites, statistical evaluation, Brazilian natural fibers.
1 INTRODUCTION
In recent years a growing tendency in the use of natural materials is taking place in many engineering applications motivated by worldwide events. The generalized pollution due to discard of non-degradable synthetic materials and climate changes attributed to CO2 emission during their industrial production are major events of global concern [1]. Additionally, the need to replace petroleum- based energy systems used in the production of synthetic materials by environmentally friendly alternatives is a strong motivation in favor of natural materials [2]. Natural fibers, mainly those lignocellulosic obtained from vegetables, constitute important examples of renewable and biodegradable materials. These lignocellulosic fibers are also less expensive than their synthetic counterparts and provide social benefits and major source of income to communities in developing countries where they are cultivated [3].
Lignocellulosic fibers have been since the beginning of our civilization used in basic items such as baskets, ropes, fabric for clothes, floor and roofing covers. In the past decades they were extensively investigated [4-8] and are nowadays already applied in industrialized items with greater aggregated value. In the automobile industry, for instance, the use of polymer composites reinforced with lignocellulosic fibers is continuously replacing synthetic fiber composites, and expanding at a fast rate [9-11]. In fact, several automobile makers in Europe are using natural fiber composites not only to comply with increasingly stiffer environmental legislation [12] but also to satisfy the public demand for “green” cars. Figure 1 illustrates the different components made of lignocellulosic reinforced polymer composite in a Mercedes Benz sedan [13].
those values for lignocellulosic fibers. Moreover, non-uniform dimensions and heterogeneous properties represent limitations for the use of lignocellulosic fibers as reinforcement in composites with required structural and mechanical performance.
Figure 1: Automobile components made of natural fiber reinforced composites [13].
In a recent work [18] it was shown that these comparative limitations against the glass fiber could be overcome through a selection of lignocellulosic fibers with smaller diameter. Actually, that work was part of a preliminary investigation involving three different fibers: curaua, sisal and ramie. In that investigation high tensile strength values, above 1000 MPa, were obtained for the three fibers in association with their smallest possible diameters. Additionally, inverse hyperbolic correlations were suggested to hold between the strength and the diameter of each type of fiber. The mentioned work [18] also indicated that correlations between lignocellulosic fibers dimensions and their mechanical properties have been early investigated [19-25]. For coir fiber [19], it was found that the strength and elongation seem to increase in the range of diameters from 100 to 200 µ m and then remain constant up to 450 µ m. By contrast, the initial modulus gradually decreases with increase in diameter within the entire range investigated. For banana fibers [20], no appreciable change in the mechanical properties was observed with an increase in the fibers’ diameter in the range of 50 to 250µm. However, a decrease in the strength was associated with a good linear correlation with the fiber test length. For sisal fibers [21], within the diameter range of 100 to 300 µ m, little variation in mechanical properties was reported. A linear decrease in the strength and elongation as well as increase in the average modulus was correlated to the increase in fiber test length.
For pineapple fibers [22], the strength decreases linearly with the diameter within the interval from 45 to 205 µm. Decrease in elastic modulus and elongation were also observe for increasing both the diameter and fiber test length. For talipot and palmyrah fibers [23], there was a tendency for the mechanical properties to increase with their diameters. In palmirah fibers, the strength and elongation decreased while the initial modulus increase with a variation of test length from 10 to 100 µm. However, talipot fibers variation was not found to be significant, except at small test lengths. It was mentioned [18] that the mechanical properties of the curaua fiber, one of the strongest lignocellulosic fibers, was investigated as a function of the fiber dimensions. It was found [24] that an increase in the fiber diameter, from 26 to 64 µm was associated with a decrease in the strength from 210 to 87 MPa. The elastic modulus also decreased but the elongation was not changed in the same diameter interval. With increasing test length, the strength and elongation decreased, while the modulus increased. The important points emphasized were the relatively low values obtained for the tensile strength as compared to others reported in the literature [25] and the significant non-linear variation with the diameter. These points indicate that a substantial increase in strength of curaua fibers might be attained for smaller diameters.
BEVITORI, W.P ; INÁCIO, W.P.; BRAVO NETO, J.; PORTELA, T.G.; Revista Matéria, v. 15, n. 4, pp.488 – 505, 2011.
Furthermore, the microstucture mechanism responsible for the correlation was discussed in more detail, by comparing results obtained for all fibers that were so far investigated. As a general conclusion from the overview presented in this article, it will be shown that the selection of lignocellulosic fibers with the smallest diameters permit to obtain, up to this moment, the strongest and most uniform fibers. In principle, the inverse hyperbolic equation could allow a quantitative prediction of the fiber tensile strength based on the selected diameter. Following this introduction, the items proposed for this overview are now presented and discussed.
2 LIGNOCELLULOSIC FIBERS STUDIED
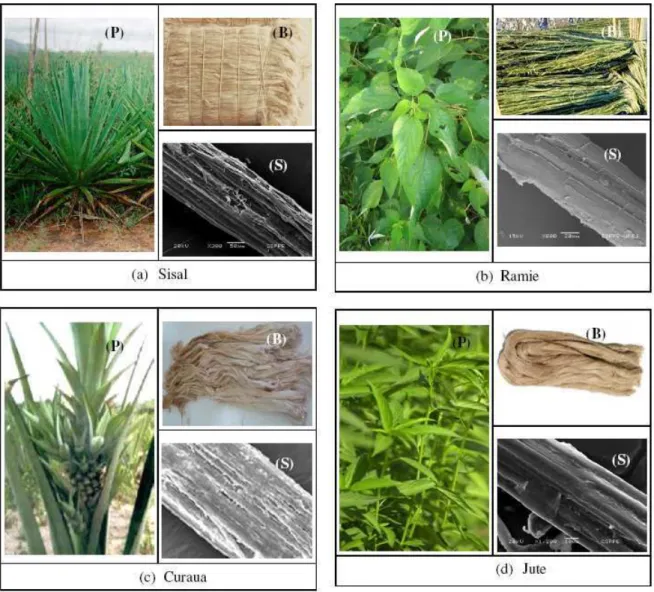
All the eight lignocellulosic fibers considered in this overview were from Brazilian origins [26-33]. The sisal, ramie and jute fibers were supplied by the firm Sisalsul, which commercializes regional lignocellulosic fibers. The curaua fiber was supplied by the firm Amazon Paper and the buriti fiber was donated by Dr. Nubia Santos from her own property, both located at the state of Para, north of Brazil. The bamboo fiber was obtained from culms extracted from a private property, while the piassava fibers purchased from a broom industry, both located at the north region of the state of Rio de Janeiro, southeast of Brazil. The coir fiber was supplied by the firm Coco Verde Reciclado in the city of Rio de Janeiro, capital of the state.
Figure 2 illustrates the plant, a bundle of fibers and a scanning electron microscopy (SEM) view of a single fiber corresponding to each one of the lignocellulosic fibers considered in this article.
Figure 2: Illustration of a plant (P); a bundle (B) and SEM surface (S) for the eight lignocellulosic fibers
Figure 2 (cont.): Illustration of a plant (P); a bundle (B) and SEM surface (S) for the eight lignocellulosic
fibers considered.
Regarding the bamboo and the buriti fibers, both were not supplied in the form of fibers and had to be prepared for this purpose. In the case of bamboo [30], Fig. 2(e), fibers were stripped off from the as-received dried culms by cutting with a sharp razor blade. Similar procedure was applied for the as-received petioles [33], Fig. 2(h), to obtain the buriti fibers. In both cases, the longitudinal cut that produces the fiber was made to coincide with the natural direction of the cellulose fibrils. In spite of the apparently uniform manual cutting procedure, different cross section diameters were obtained. This will be shown and discussed in the following sections.
3 DIAMETER MEASUREMENT TECHNIQUES
BEVITORI, W.P ; INÁCIO, W.P.; BRAVO NETO, J.; PORTELA, T.G.; Revista Matéria, v. 15, n. 4, pp.488 – 505, 2011.
(a)
(b)
Figure 3: SEM view of synthetic fibers: (a) glass and (b) carbon.
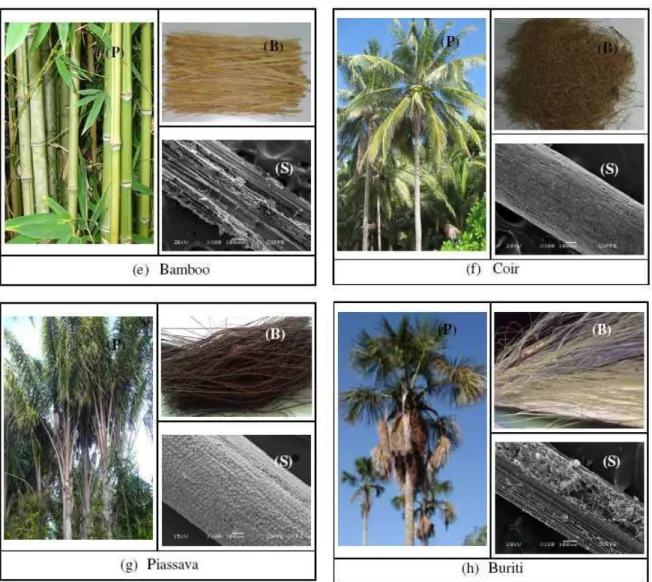
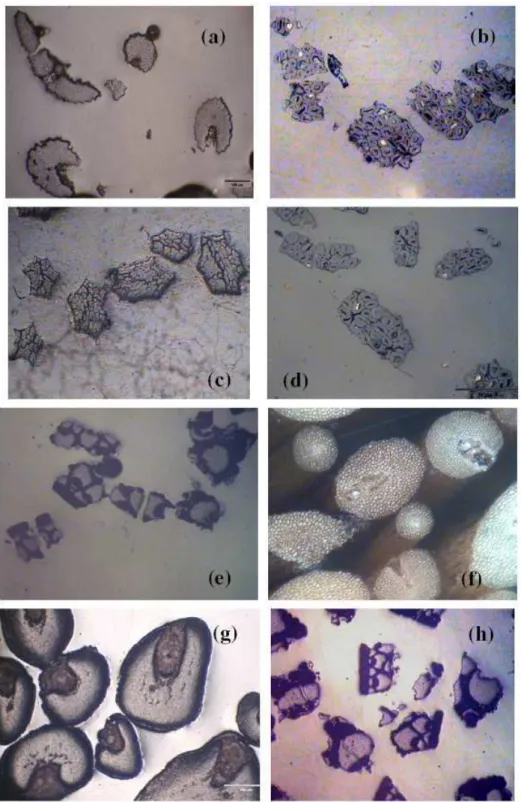
Figure 4 illustrates the typical cross sections of the lignocellulosic fibers considered. Fibers were embedded in polymer supports and then fine-polished for optical microscopy observation on a Neophot microscope One support was used for fibers of the same specie but with different cross section shapes and dimensions. One can observe in Fig. 4 that distinct shapes and sizes exist for the cross section of each type of lignocellulosic fiber. In the best cases, the cross section is approximately elliptical with small eccentricity. In fact, when visually observed, apparent round fibers may display microscopically quite distinct eccentric cross section shapes. Moreover, even in a single fiber, significant changes in cross section dimensions along the axial direction are common features of all lignocellulosic fiber. Therefore, a careful measurement of the transversal dimensions has to be conducted to permit a reliable estimation of the diameter mean value and, hence, allows an exact determination of the area for the correct evaluation of the tensile strength.
Another relevant question concerning the reliable diameter measurement is the fact that lignocellulosic fibers are relatively soft. This makes it difficult to measure the diameter by a contact procedure with any kind of metallic device. For example, the easier and common way to measure fiber diameter is to use a caliper or micrometer, normally fabricated on much harder steel or metallic alloys. As a consequence, when trying to hold a soft lignocellulosic fiber in between the grips of the metallic device, the operator naturally squeezes the fiber. In other words, to feel that the fiber is firmly grasped by the device, one needs to apply a pressure that deforms the surface and reduces the diameter. The only reliable way to measure lignocellulosic fiber diameter is by means of a profile projector. In this non-contact technique, a light beam projects the amplified image or shadow of the fiber, allowing measurements of one hundredth of a millimeter of precision to be made through a mobile graduated scale.
The works reviewed in this article [26-33] used the profile projector technique to measure the fiber diameter. In those works,, every fiber was measured at five locations along its length, which stays in between the grips during the tensile test. At each location, the equivalent diameter corresponding to the average of the larger and the smaller cross section dimensions was evaluated. The fiber diameter was determined as the mean value of the five measurements. This diameter d was used to calculate the fiber cross section area : A = ππππ d2/4. One should remember that the square exponent makes the area extremely sensitive to small changes
Figure 4: Typical cross-sections of fibers with different diameters for each one of the eight types of
lignocellulosic fibers considered: (a) sisal, (b) ramie, (c) curaua, (d) jute, (e) bamboo, (f) coir, (g) piassava, and (h) buriti.
4 SPECIFIC DISTRIBUTION OF DIAMETER
BEVITORI, W.P ; INÁCIO, W.P.; BRAVO NETO, J.; PORTELA, T.G.; Revista Matéria, v. 15, n. 4, pp.488 – 505, 2011.
associated with the thickest and thinnest fibers respectively found in the as obtained lot, delimitates the range covered by each histogram. This range was conveniently divided in diameter intervals for statistical purpose. Here, it should be mentioned that the limited number of fibers in the investigated lots, no more than one thousand for each type, imposed a limitation to the range of intervals in Fig. 5. In the hypothesis that lots with greater number of fibers could be investigated, maybe even thicker and thinner fibers would be possibly be found, extending the range of the histograms in Fig. 5.
F
re
q
u
en
cy
(
%
)
0.00 0.04 0.08 0.12 0.16 0.20 0.24 0.28 0.32 0.36 0.40
0 5 10 15 20 25
0.000 0.005 0.010 0.015 0.020 0.025 0.030 0.035 0.040 0 5 10 15 20 25 30 35 40
0.02 0.04 0.06 0.08 0.10 0.12 0.14 0 5 10 15 20 25
0.02 0.04 0.06 0.08 0.10 0.12 0.14 0.16 0.18 0
10 20 30 40
0.3 0 .4 0 .5 0 .6 0 .7 0 .8 0 .9 0 5 1 0 1 5 2 0 2 5 3 0 3 5 4 0
0.0 0.1 0.2 0.3 0.4 0.5 0.6 0.7
0 10 20 30 40 50
0.20 0.45 0.70 0.95 1.20 1.45 1.70 1.95 2.20 2.45 0 4 8 12 16 20 24 28 32
0.3 0.4 0.5 0.6 0.7 0.8 0.9
0 5 10 15 20 25 30 35
Diameter (mm)
Figure 5: Distribution frequency for the profile projector measured mean equivalent diameters of the eight
lignocellulosic fibers considered. Sisal Ramie Bamboo Jute Curaua Coir
Another relevant point is that different lots of the same type of lignocellulosic fibers may display changes in diameter distribution. This has been found in piassava [34] and curaua [35] fibers. Consequently, a comparison of results based on diameter analysis of distinct lots of a given lignocellulosic fiber might disclose dissimilarities. To the knowledge of the authors of this article, although relevant, this comparison has not yet been done and, thus, needs not to be discussed.
The arbitrarily considered diameter intervals in Fig. 5 indicate that the lignocellulosic fibers studied presented a reasonably normal distribution with one maximum in frequency associated with a fairly symmetrical dispersion. This can be interpreted as unimodal distribution of diameters, which permits a single Weibull correlation with the tensile strength, as further discussed in other sections. Another information regarding the Weibull statistical procedure is worth mentioning. For each diameter interval of a given type of fiber in Fig. 5, a minimum of 20 fibers was later selected to be tensile tested. Therefore, one should bear in mind that the statistical analysis for the correlation between the tensile strength and the diameter was carried out with at least 20 fibers for each interval of diameters represented by its mean value. For example, the sisal fiber histogram, Fig. 5(a), is composed of diameters experimentally obtained within a range from 0.04 to 0.4 mm. In this range, nine intervals with a diameter span of 0.04 mm were arbitrarily chosen [26]. They represent a diameter distribution based on nine bars, Fig. 5(a), with mean diameters from 0.06 to 0.38 mm and a total average diameter of 0.17 mm. After the construction of this sisal histogram, other fibers were then specifically selected to add a total of at least 20 individuals associated with each diameter interval represented by its mean value [26]. The same procedure was followed for the other type of fibers [27-33]. As the next step, all selected lignocellulosic fibers were tensile tested according to the procedure described in the ongoing section.
5 TENSILE TESTING AND FRACTURE OBSERVATION PROCEDURES
The Weibull analysis, which leads to the determination of the diameter dependence of the fiber strength, was based on experimental results of tensile tests. These tests were conducted in every selected individual fiber for the eight types considered in this article. As testing procedure, the fiber sample was sectioned with a total length of 200 mm. The gauge length of 100 mm allowed 50 mm at the fiber’s extremities to be hold by the grips of the testing machine. Pieces of cardboard were glued to the ends of the fiber sample to avoid direct contact of the fiber surface to the grip. This procedure permitted a tied holding and prevents slippage without damaging the fiber. Tensile tests were conducted in a model 5582 universal Instron or in a model DL 10000 EMIC machine, whichever was available. The test temperature was the acclimatized 25°C. A constant deformation velocity of 1 mm/s, corresponding to a strain rate of 10-2 s-1 was used.
In order to analyze the mechanism responsible for the diameter dependence of the fiber tensile strength, the fracture of representative fiber of each type were observed by scanning electron microscopy (SEM). Fractured tips of the fiber samples were attached by conducting carbon tape to a metallic support. These fracture samples were gold sputtered to allow observation in a model SSX-550 Shimadzu or in a model JSM 6460 Jeol microscopes, whichever was available. In both cases, the microscopes operated with secondary electrons accelerated at a maximum voltage of 15 kV.
6 RESULTS AND WEIBULL ANALYSIS
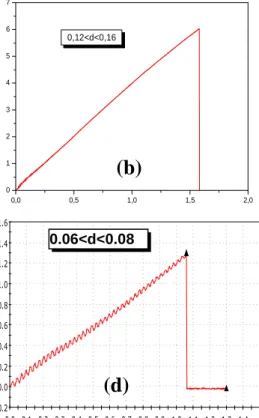
The large amount of experimental data regarding the tensile tests and Weibull analysis for the eight types of fibers considered, does not allow a complete presentation of all of them. Therefore, only a few examples will be shown to illustrate the existing results. Figure 6 depicts typical tensile forces versus elongation curves directly obtained from the machine digital recorded data, for each one of the eight types of lignocellulosic fibers.
BEVITORI, W.P ; INÁCIO, W.P.; BRAVO NETO, J.; PORTELA, T.G.; Revista Matéria, v. 15, n. 4, pp.488 – 505, 2011.
L
o
ad
(
N
)
0,0 0,5 1,0 1,5
0 1 2 3 4 5 6 7
0,16<d<0,2
0,0 0,5 1,0 1,5 2,0
0 1 2 3 4 5 6 7
0,12<d<0,16
0 2 4 6 8 10 12
0.0 0.5 1.0 1.5 2.0
0.5 < d < 0.6
0 5 1 0 1 5
0 2 0 4 0 6 0 8 0
0 .5 5 < d < 0 .6 5
Elongation (mm)
Figure 6: Typical forces versus elongation curves for each one of the eight types of lignocellulosic fibers
considered: : (a) sisal, (b) ramie, (c) curaua, (d) jute, (e) bamboo, (f) coir, (g) piassava, and (h) buriti.
0.03<d<0.04
0.06<d<0.08
0.7<d<0.8
0.20<d<0.45
(a)
(b)
(c)
(d)
(e)
(f)
(g)
From the maximum load forces, Fm, reached in curves such as the ones shown in Fig. 6, the tensile strength i.e. the ultimate tensile stress, σm, was calculated by
1 )
σ
m= 4F
m/
π
d
ewhere de is the equivalent diameter determined according to the procedure described in section 3 of this chapter.
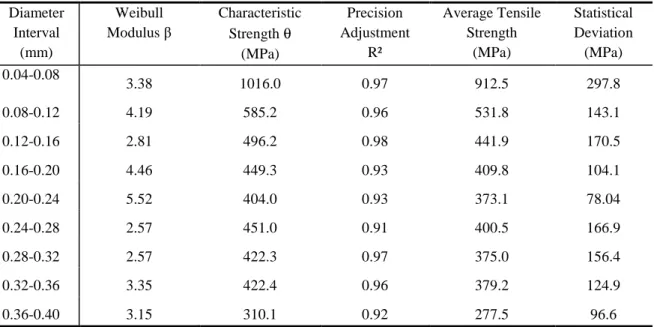
For the considered types of lignocellulosic fibers, the values of the tensile strength were analyzed by the Weibull statistic method for each one of the diameter intervals in the histograms of Fig.5. One must remember that the number of intervals was arbitrarily chosen depending on the fiber’s range of diameter. The applied Weibull Analysis computer program provided the following parameters: θ (characteristic strength), β (Weibull modulus), R2 (statistical precision) as well as the average strength,
σ
, based on the specific Weibull distribution, with its related deviation. Once again, it is beyond the scope of this chapter to show the values of all parameters for each one of the considered fibers. As an example, Table 1 presents the Weibull parameters for the nine diameter intervals, Fig. 5(a), of the sisal fiber [26].Table 1: Weibull parameter for the tensile strength of sisal fibers associated with different diameter intervals.
Diameter Interval
(mm)
Weibull Modulus β
Characteristic Strength θ
(MPa)
Precision Adjustment
R²
Average Tensile Strength
(MPa)
Statistical Deviation (MPa) 0.04-0.08
3.38 1016.0 0.97 912.5 297.8
0.08-0.12 4.19 585.2 0.96 531.8 143.1
0.12-0.16 2.81 496.2 0.98 441.9 170.5
0.16-0.20 4.46 449.3 0.93 409.8 104.1
0.20-0.24 5.52 404.0 0.93 373.1 78.04
0.24-0.28 2.57 451.0 0.91 400.5 166.9
0.28-0.32 2.57 422.3 0.97 375.0 156.4
0.32-0.36 3.35 422.4 0.96 379.2 124.9
0.36-0.40 3.15 310.1 0.92 277.5 96.6
BEVITORI, W.P ; INÁCIO, W.P.; BRAVO NETO, J.; PORTELA, T.G.; Revista Matéria, v. 15, n. 4, pp.488 – 505, 2011.
Weibull Probability Plot
ln [l n (1 /R e lia b ili ty )]
ln(X - Location Parameter) -0.6 -1.2 -1.8 -2.4 -3.0 -3.5 -4.1 -4.7 -5.3 -5.9 0.0 0.6 1.2 1.8 2.4
5.9 6.1 6.2 6.4 6.5 6.7 6.8 7.0 7.1 7.3 7.4
Weibull Probability Plot
ln [l n (1 /R e lia b ili ty )]
ln(X - Location Parameter) -0.6 -1.3 -1.9 -2.5 -3.2 -3.8 -4.5 -5.1 -5.7 -6.4 0.0 0.6 1.3 1.9 2.5
3.8 4.1 4.4 4.8 5.1 5.4 5.7 6.0 6.4 6.7 7.0
Weibull Probability Plot
ln [l n (1 /R e lia b ili ty )]
ln(X - Location Parameter) -0.6 -1.2 -1.8 -2.3 -2.9 -3.5 -4.1 -4.7 -5.3 -5.9 0.0 0.6 1.2 1.8 2.3
4.0 4.1 4.3 4.4 4.6 4.7 4.8 5.0 5.1 5.3 5.4
Weibull Probability Plot
ln [l n (1 /R e lia b ili ty )]
ln(X - Location Parameter) -0.5 -1.0 -1.5 -2.0 -2.5 -2.9 -3.4 -3.9 -4.4 -4.9 0.0 0.5 1.0 1.5 2.0
2.6 2.8 3.0 3.1 3.3 3.5 3.7 3.9 4.0 4.2 4.4
ln [l n (1 /R e lia b ili ty )]
ln(X - Location Parameter) -0.6 -1.3 -1.9 -2.5 -3.2 -3.8 -4.5 -5.1 -5.7 -6.4 0.0 0.6 1.3 1.9 2.5
1.8 2.3 2.7 3.2 3.6 4.1 4.6 5.0 5.5 5.9 6.4
Figure 7: Examples of Weibull graphs for the eight lignocellulosic fibers: (a) sisal, (b) ramie, (c) curaua, (d)
jute, (e) bamboo, (f) coir, (g) piassava, and (h) buriti.
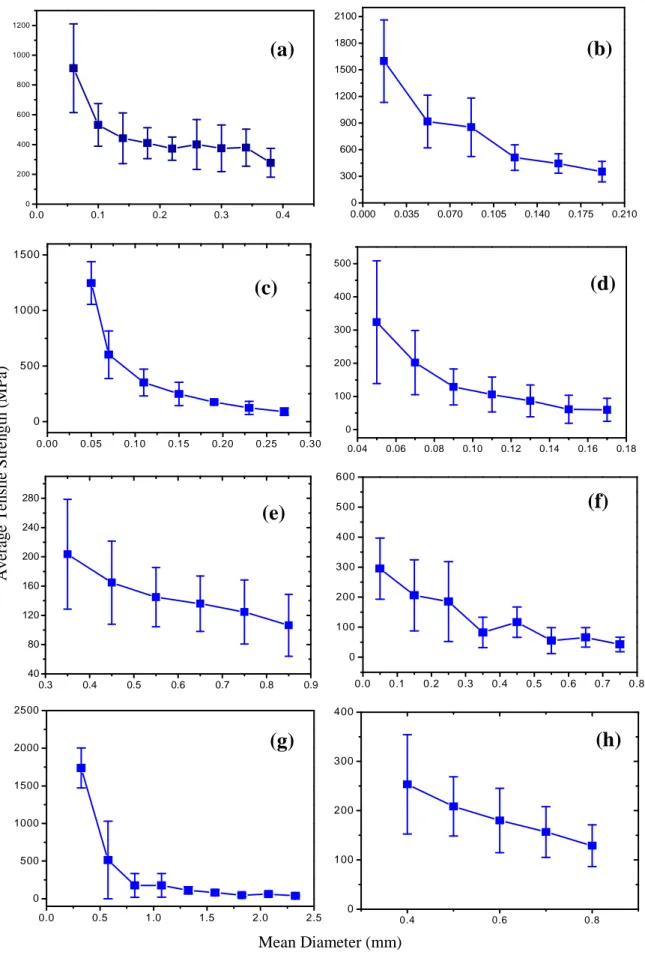
As the main objective of this article, Fig. 8 presents the Weibull average tensile strength, from data listed in tables for the considered lignocellulosic fibers [26-33] like Table 1 for sisal fiber, as a function of the mean diameter of corresponding intervals in Fig. 5.
0.04<d<0.08 0.070<d<0.105
0.11<d<0.12
0.04<d<0.06
0.6<d<0.7
d > 0.7
0.70<d<0.95 0.65<d<0.75
(a)
(b)
(c)
(d)
(e)
(f)
A
v
er
ag
e
T
en
si
le
S
tr
en
g
th
(
M
P
a)
0.0 0.1 0.2 0.3 0.4
0 200 400 600 800 1000 1200
0.000 0.035 0.070 0.105 0.140 0.175 0.210 0 300 600 900 1200 1500 1800 2100
0.00 0.05 0.10 0.15 0.20 0.25 0.30 0
500 1000 1500
0.04 0.06 0.08 0.10 0.12 0.14 0.16 0.18
0 100 200 300 400 500
0.3 0.4 0.5 0.6 0.7 0.8 0.9
40 80 120 160 200 240 280
0.0 0.1 0.2 0.3 0.4 0.5 0.6 0.7 0.8 0 100 200 300 400 500 600
0.0 0.5 1.0 1.5 2.0 2.5
0 500 1000 1500 2000 2500
0.4 0.6 0.8
0 100 200 300 400
Mean Diameter (mm)
Figure 8: Weibull average strength as a function of the mean diameter associated with intervals in Fig. 5 for
the fibers considered: (a) sisal, (b) ramie, (c) curaua, (d) jute, (e) bamboo, (f) coir, (g) piassava, and (h) buriti.
(a)
(b)
(c)
(d)
(e)
(f)
BEVITORI, W.P ; INÁCIO, W.P.; BRAVO NETO, J.; PORTELA, T.G.; Revista Matéria, v. 15, n. 4, pp.488 – 505, 2011.
For all curves in Fig. 8, there is a clear tendency for an inverse relationship between the strength and the diameter. In other words, the thinner the diameter, the stronger the fiber. Two points deserve attention in Fig. 8. First, by considering the error bars associated with the Weibull statistical deviation of each average strength, it is sometimes possible to consider a constant value (horizontal line) going through the limits. Such is the situation of Fig. 8(e) for the bamboo, Fig. 8(f), for the coir and Fig 8(h) and for the buriti fiber. Second, for the thinnest sisal, Fig. 8(a); ramie, Fig. 8(b); curaua, Fig. 8(c) and piassava, Fig. 8(g) values of tensile strength above 1000 MPa were obtained.
These results corroborate the first previous work on the subject [18] dealing with curaua, sisal and ramie fibers. In particular, the inverse correlation between the strength and the diameter is an undoubted evidence for the stronger sisal, ramie, curaua and piassava fibers. No constant horizontal line can fit the points through the error bars. Moreover, simple inverse straight lines are also not able to fit the points. It was commonly found [26-33] that a hyperbolic inverse correlation could reasonably translate the variation of strength with the fiber diameter:
2)
σ
= A/d - B
Table 2 shows the values of A and B in Eq. (2) associated with the hyperbolic equation for the eight lignocellulosic fibers considered. In this table, the correlation coefficients associated with the experimental fitting to the corresponding hyperbolic equation are also shown.
Table 2: Hyperbolic coefficients for the strength vs. diameter relationship.
Fiber Sisal Ramie Curaua Jute Bamboo Coir Piassava Buriti A
(MPa.mm)
39 21 67 19 54 13 620 96
B (MPa)
209 389 -196 -64 49 68 -349 15
Adjustment Coefficient
R2
0.93 0.88 0.95 0.99 0.98 0.74 0.92 0.99
The results presented in Fig 8 and Table 2 revealed a strong evidence that a non-linear inverse correlation could rule the tensile strength vs. equivalent diameter relationship in lignocellulosic fibers. Although limited to only eight types of fibers, this behavior may also apply to others such as cotton, flax, hemp, kenaf, pineapple, etc. The reason for a general relationship such as the proposed hyperbolic equation (2) can be related to the role played by defects and flaws in the fiber’s structure. This will further be discussed in the next section.
Table 3: Equivalent diameter associated with a tensile strength of 1000 MPa given by Equation (2).
Fiber Sisal Ramie Curaua Jute Bamboo Coir Piassava Buriti Diameter
(mm)
0.049 0.034 0.056 0.018 0.057 0.014 0.046 0.097
The data in Table 3 is consistent with the results of sisal, ramie, curaua and piassava fibers, for which experimental findings, Fig. 8, corroborates the equivalent diameters associated with 1000 MPa. Moreover, the extrapolated equivalent diameters of jute, bamboo, coir and buriti in Table 3 are feasible practical values to be obtained by cutting procedure (bamboo and buriti) or, by chance, found in nature (jute and piassava).
7 MICROSTRUCTURE AND FRACTURE ANALYSIS
A possible explanation suggested by the referred works, [18, 26-33] for the inverse tensile strength vs. diameter correlation, Fig. 8 and Equation (2) was based on the heterogeneous microstructure typical of any lignocellulosic fiber. As shown in Fig. 2 for the surface and in Fig. 4 for the cross section, these fibers possess defects, flaws and irregularities throughout their spacial three dimensions. In other words, lignocellulosic fibers are microstructurally non-uniform along any 3D orientation. This is a marked difference to synthetic fibers, Fig. 2, and certainly the major factor for the relatively lower strength performance of any natural fiber.
Experimentally, it was observed [3, 18, 26-33] that the density of defects/ flaws/ irregularities in lignocellulosic fibers varies with equivalent diameter, i.e., the size of the cross section. Smaller cross sections present comparatively lower density of defects/ flaws/ irregularities, both in the surface and inside the volume of the fiber. As a consequence, thinner fibers tend to be more homogeneous than thicker ones of the same species. Examples of this behavior can be seen in the cross section views in Fig. 4. In this figure, one may notice that the smaller fibers have a tendency to be less eccentric, more circular and with less porosity. The above mentioned non-uniform distribution of defects/ flaws/ irregularities density in fibers with different cross section sizes is apparently one of the main mechanisms responsible for the inverse strength vs. diameter correlation.
The most straightforward evidence of the mechanisms that causes the inverse correlation is provided by the SEM fractography analysis of tensile-ruptured fibers in Fig. 9. In this figure a comparison between the typical fracture of thinner and thicker fibers corresponding to the eight species is presented. For all of them, it was observed that the thinner fibers display a rupture associated with more homogeneous microstructure and less participations of fibrils. By contrast, the thicker fibers reveal a comparatively more heterogeneous rupture associated with relatively more fibrils.
The fractography results in Fig. 9 indicate that, statistically, there is a higher probability that a thicker fiber would break at a stress lower than that required for a thinner fiber. First, as observed [3, 18, 26-33], the thicker fibers with larger cross section possibly have a higher density of defects/ flaws/ irregularities. These correspond to weaker points and stress raisers that cause premature failure in comparison to thinner fibers. Second, owing to the greater dispersion in properties of lignocellulosic fibers [3-8], a thicker fiber with more fibrils has statistically a comparative larger distribution of both weaker and stronger fibrils. Consequently, during the tensile test, there is a higher probability that a weaker fibril in the thicker fiber breaks at a lower stress than the weaker fibril in the thinner fiber. Once the first fibril (weakest of the thicker fiber) is broken, it causes a flaw in the fiber structure. The flaw may act as a microcrack, which swiftly propagates in a brittle mode until total rupture. In other words, statistically the group of many fibrils composing a thicker fiber tends to have one of them breaking shortly during the tensile load as compared to any of the fewer fibrils of a thinner fiber.
BEVITORI, W.P ; INÁCIO, W.P.; BRAVO NETO, J.; PORTELA, T.G.; Revista Matéria, v. 15, n. 4, pp.488 – 505, 2011.
Figure 9: SEM fractographs of tensile-ruptured tips of thin and thicker fibers for the eight lignocellulosic
Figure 9 (cont.): SEM fractographs of tensile-ruptured tips of thin and thicker fibers for the eight
BEVITORI, W.P ; INÁCIO, W.P.; BRAVO NETO, J.; PORTELA, T.G.; Revista Matéria, v. 15, n. 4, pp.488 – 505, 2011.
8 CONCLUDING SUMMARY
Based on results recently obtained on eight lignocellulosic fibers (sisal, ramie, curaua, jute, bamboo, coir, piassava and buriti) it was experimentally characterized an inverse correlation between the tensile strength and the equivalent fiber diameter. Profile projector measurements were used to obtain precise diameter values and then allowed the correct calculation of the resisting cross section area for further stress evaluation.
The Weibull statistical method was applied for the stress evaluation and correlation with different intervals of diameter associated with the range of dispersion characteristic of lignocellulosic fibers. The method provided supports the suggestion that the tensile strength holds a hyperbolic type of inverse relationship with the equivalent fiber diameter. In practice, this raises the possibility of selecting very thin fibers with unusually high strength.
A microstructural study and SEM fractography analysis offered two possible mechanisms related to defects, flaws and irregularities as well as the distribution of fibrils that compose the fiber, as responsible for the superior performance of thinner fibers in tensile tests.
9 ACKNOWLEDGEMENTS
The authors thank the support to this investigation by the Brazilian agencies CNPq, CAPES, FINEP and FAPERJ. It is also acknowledged the collaboration of Eduardo Atem de Carvalho, Frederico Muylaert Margem, Helvio P. Guimarães Santafé Jr., Lucas Lopes da Costa and Romulo L. Loiola.
10 REFERENCES
[1] GORE, A., An Inconvenient Truth. The Planetary Emergency of Global Warming and What We can do
About It. 1sted., Emmaus, Rodale Press, 2006.
[2] CROCKER, J. “Natural materials innovative natural composites”, Materials Technology , v. 2-3, pp.174-178, 2008.
[3] MONTEIRO, S.N., LOPES, F.P.D., FERREIRA, A.S., NASCIMENTO, D.C.O., “Natural fiber polymer matrix composites: cheaper, tougher and environmentally friendly”,Journal of the Minerals, Metals and Materials Society, v. 61, pp. 17-22, 2009.
[4] BLEDZKI, A.K., GASSAN, J., “Composites reinforced with cellulose-based fibers”, Progress in
Polymer Science, v. 4, pp.221-274, 1999.
[5] NABI-SAHED, D., JOG, .J.P., “Natural fiber polymer composites: a review”, Advances in Polymer Technology, v. 18, pp. 221-274, 1999.
[6] MOHANTY, A.K., MISRA, M., HINRICHSEN, G., “Biofibers, biodegradable polymers and biocomposites: an overview”, Macromolecular Materials and Engineering, v. 276/277, pp. 1-24, 2000.
[7] EICHHORN, S.J., BAILLIE, C.A, ZAFEIROPOULOS, N. et al “Review of current international research into cellulosic fibres and composites”, Journal of Material Science, v. 36, pp. 2107-2113, 2001.
[8] MOHANTY, A.K., MISRA, M., DRZAL, L.T. “Sustainable biocomposites from renewable resources: opportunities and challenges in the green material world”, Journal Polymer Environmental, v. 10, pp. 9-26, 2002.
[9] HILL, S., “Cars that grow on trees”, New Scientists, v. 153, pp. 36-39, 1997.
[10] MARSH, G., “Next step for automotive materials”, Materials Today, v. 6, pp. 36-43, 2003.
[11] ZAH, R., HISCHIER, R., LEÃO, A.L. et al, “Curaua fibers in automobile industry – A sustainability assessment”, Journal Cleaner Production, v. 15, pp. 1032-1040, 2007.
[12] EUROPEAN COMMISSION, “Directive 2000-53/EC of the European Parliament and of the Council of September 18, 2000 on end-of-life vehicles”, Union OJOTE, 2000, p 9.
[13] MERCEDES-BENZ, http://www.mercedes-benz.com.br , Accessed 30 August 2008.
[14] WAMBUA, P., IVENS, I., VERPOEST, I., “Natural fibers: can they replace glass and fibre reinforced plastics?”, Composites Science and Technology, v. 63, pp. 1259-1264, 2003.
[15] HERRERA-FRANCO, P.J., VALADEZ-GONZALEZ, A., “Mechanical properties of continuous natural fiber reinforced polymer composites”, Composites Part A, v. 35, pp. 339-345, 2004.
[16] CALLISTER, W.D. Jr, Materials Science and Engineering – An Introduction, 7th ed., New York, John Wiley & Sons, (2007)
[19] KULKARNI, A.G., SATYANARAYANA, K.G., SUKUMARAN, K. et al, “Mechanical behavior of coir fibers under tensile load”, Journal of Material Science, v. 16, pp. 905-914, 1981.
[20] KULKARNI, A.G., SATYANARAYANA, K.G., ROHATGI, P.K. et al, “Mechanical properties of banana fibers”, Journal of Material Science , v. 18, pp. 2290-2296, 1983.
[21] MURHERJEE, P.S., SATYANARAYANA, K.G., “Structure and properties of some vegetable fibers – Part 1 Sisal fiber”, Journal of Material Science , v. 19, pp. 3925-3934, 1984.
[22] MURHERJEE, P.S., SATYANARAYANA, K.G., “Structure and properties of some vegetable fibers – Part 2 Pineapple fiber (Ananas comosus)”, Journal of Material Science, v. 21, pp. 51-56, 1986.
[23] MURHERJEE, P.S., SATYANARAYANA, K.G., “Structure and properties of some vegetable fibers – Part 3 Talipot and Palmyrah fiber”, Journal of Material Science , v. 21, pp. 57-63, 1986.
[24] TOMCZAK, F., SATYANARAYANA, K.G., SYDENSTRICKER, T.H.D., “Studies on lignocellulosic fibers in Brazil: Part III Morphology and properties of Brazilian curaua fibers”, Composites: Part A, v. 38, pp. 2227-2236, 2007.
[25] SATYANARAYANA, K.G., WYPYCH, F., GUIMARÃES, J.L. et al, “Studies on natural fibers of Brazil and green composites”.Metals Materials and Processes, v. 17, pp. 183-194, 2005.
[26] INACIO, W.P., LOPES, F.P.D., MONTEIRO, S.N. “Tensile strength as a function of sisal fiber diameter through a Weibull analysis”, In: Biomaterials Symposium, First TMS-ABM International
Materials Congress, Rio de Janeiro, Brazil. pp. 1-10, 2010.
[27] MARGEM, F.M., BRAVO NETO, J., MONTEIRO, S.N. “Ramie fibers mechanical properties evaluation by the Weibull analysis” (in Portuguese). In: Brazilian Congress on Materials Science and
Engineerin,. Campos do Jordão, Brazil, pp. 1-10, 2010.
[28] FERREIRA, A.S., MONTEIRO, S.N., LOPES, F.P.D. et al, “Curaua fiber mechanical properties evaluation by the Weybull analysis” (in Portuguese), In: 64rd International Congress of the Brazilian Association for Metallurgy and Materials, Belo Horizonte, Brazil, pp. 1-12. 2009.
[29] BEVITORI, A.B., SILVA, I.L.A., MONTEIRO, S.N. et al, “Weibull analysis of the tensile strength variation with diameter for jute fibers”, In: Biomaterials Symposium, First TMS-ABM International
Materials Congress, Rio de Janeiro, Brazil, pp. 1-10, 2010.
[30] COSTA, L.L., LOIOLA, R.L., MONTEIRO, S.N. “Tensile strength of bamboo fibers: Weibull analysis to characterize the diameter dependence”, In: Biomaterials Symposium, First TMS-ABM International
Materials Congress, Rio de Janeiro, Brazil, pp. 1-10, 2010.
[31] SANTAFE, H.P.G. Jr., MONTEIRO, S.N., COSTA, L.L. et al, “Weibull distribution as an instrument of statistical analysis for coir fiber tensile tests” (in Portuguese), In: 64rd International Congress of the Brazilian Association for Metallurgy and Materials, Belo Horizonte, Brazil, pp.1-12, 2009.
[32] NASCIMENTO, D.C.O., MOTTA, L.C., MONTEIRO, S.N., “Weibull analysis of tensile tested piassava fibers with different diameters”, In: Characterization of Minerals, Metals and Materials – TMS
2010, Seattle, USA, pp. 1-8, 2010.
[33] PORTELA, T.G.R., COSTA, L.L., LOPES, F.P.D. et al, “Characterization of fibers from different parts of the buriti palm tree”. ”, In: Characterization of Minerals, Metals and Materials – TMS 2010, Seattle, USA, pp. 1-7, 2010.
[34] MONTEIRO, S.N., “Properties and structure of Attalea funifera piassava fibers for composite reinforcement – A critical discussion”, Journal of natural fibers, v. 6, pp. 191-203, 2009.
![Figure 1: Automobile components made of natural fiber reinforced composites [13].](https://thumb-eu.123doks.com/thumbv2/123dok_br/18872520.420496/2.892.230.687.175.458/figure-automobile-components-natural-fiber-reinforced-composites.webp)