*e-mail: [email protected]
Analysis of Electrochemical Porosity of Phosphatized
Coatings on Galvanized Steel Substrate
Haroldo de Araújo Pontea*, Alexandre Michel Maula, Evandro de Azevedo Alvarengab
aUniversidade Federal do Paraná, Departamento de Tecnologia Química,
Laboratório de Eletroquímica de Superfície e Corrosão-LESC, Centro Politécnico C.P. 19011, 81531-990 Curitiba - PR, Brazil
bUSIMINAS S.A., Centro de Pesquisa e Desenvolvimento
35160-900 Ipatinga - MG, Brazil
Received: October, 22, 2001 Revised: August, 5, 2002
This work refers to the application of a Voltammetric Anodic Dissolution (VAD) Technique in the analysis of coating discontinuities, focusing on pores and cracks that exposed the substrate. An evaluation was made of the influence of several parameters, such as the concentration of the passivation solution and sweep rate (SR), on the substrate passivation process and on the porosity indexes of tricationic phosphate coatings of Fe/Zn/Mn. The phosphatization process used was a commercial tricationic Fe/Zn/Mn phosphate bath applied on a galvanized steel (GS) substrate. Once the best experimental conditions for the use of the VAD technique had been defined, the grain size and layer weight were related to porosity indexes. The porosity was found to show a tendency to decrease with increasing grain size. The VAD technique consists of the anodic polari-zation of the substrate/coating system and measurement of the charge density involved in the substrate passivation process. A quantitative porosity index was obtained by comparing the passivation charge density of the substrate without coating (standard passivation charge density) and the passivation charge of the coated substrate.
Keywords:porosity, coating discontinuities, phosphate, voltammetric anodic dissolution
1. Introduction
The corrosion resistance of the coating/substrate sys-tem is associated with the area of metal exposed through pores or coating discontinuities. Today, phosphate analyses are a part of corrosion tests carried out after painting and chemical tests on the untreated layer1.
The traditional methods to determine porosity rely on the observation of active pores (chemical tests with ferrocyanide or other aggressive solutions, hot water, electrographic and salt-spray tests). These procedures are,
therefore, qualitative ones2. Because these techniques are
based on the observation and counting of chemically marked spots, they are insensitive to small discontinuities and de-pend on subjective criteria. These limitations render the use of traditional methods useless to detect small cracks and pores3.
In today’s electrochemical tests, the analyzed sample
operates as the anode in an electrochemical cell. This re-quires that the coating is kept inert in relation to the electro-lyte during immersion in the passivation solution (chemical attack) and during anodic polarization4.
There are several variants of electrochemical tests to determine coating porosity, which are usually classified into three main groups5,6:
• Corrosion potential measurements; • Corrosion current measurements; • Polarization resistance measurements; • Coulometric measurements.
Corrosion potential measurements were first reported
by Hoar7. This author observed that the potential of
sam-ples covered with tin changed when scratches of different sizes were applied to the sample. This technique is very simple. However, it presents limitations for the analysis of very large or very small areas of exposed substrate.
method to measure the corrosion current8, 9,10. He suggested
that if the ratio between the cathodic area (the coating or an auxiliary electrode) and the anodic area (exposed substrate) was high enough, the corrosion current flowing through the cathode would be practically independent of the cathodic area but strongly dependent on the anodic one. Hence, the current could result in a porosity index.
Clarke and Britton applied the resistance polarization technique to study tin-nickel coatings on steel. This tech-nique presented serious limitations for thin coating analy-ses, since the effect of the resistance inside pores became less significant4.
Typical porosity tests for phosphate coating analyses are the ferrocyanide test and the copper deposition test; how-ever, electrochemical tests ensure better control of the test conditions11.
Weng et al. studied the porosity of zinc and manganese
phosphate coatings12, using the polarization resistance
tech-nique and obtaining an average porosity of less than 1.5%
for zinc and manganese coatings12.
In this work, the electrochemical Voltammetric Anodic
Dissolution (VAD) technique11,13, in which the passivation
charge of the substrate is measured, is used to determine the phosphate coating porosity of galvanized steel (GS) foils prepared under different phosphatization conditions. The advantages of this technique are the short analysis time (about 1 min) and the fact that a calibration curve is unne-cessary, requiring only the passivation standard charge (substrate with unitary porosity without coating).
2. Materials and Methods
The voltammetric anodic dissolution technique (VAD) used in this study consists of the anodic polarization of the substrate/coating system and measurement of the charge density involved in the substrate’s passivation process.
A comparison of the passivation charge density of the substrate without coating (standard passivation charge den-sity, Q0pass) and that of the coated substrate (Qpass) supplies
the porosity, which is expressed by:
0 pass pass Q Q = θ (1)
where: q = porosity, fraction of the substrate’s area
exposed to the electrolyte;
Q0pass = dissolution/passivation charge of the
uncoated substrate;
Qpass = dissolution/passivation charge of the coated
substrate.
The conditions needed to apply this technique are: • The substrate must be devoid of chemical attack in the
dissolution/passivation solution.
• The substrate must become passivated when anodically polarized.
• The coating must remain inert or present a slight and measurable reaction rate in the potential range in which the passivation process occurs1,13,14,15.
The most suitable experimental conditions (solution, solution concentration and sweep rate) for the application of the VAD technique were determined in this study. An evaluation of the porosity of a tricationic phosphate coating on galvanized steel was made prior to selecting the experi-mental conditions. The phosphate layers were obtained by applying five different phosphatization conditions.
All the reagents used in this study were of analytical grade and the solutions were kept at ambient temperature (25 °C). Distilled water was used to prepare solutions, ma-terial wash and cell wash. The foils were cleaned with ac-etone before the electrochemical procedures.
All the potentials were measured in relation to a satu-rated calomel electrode (SCE) and a three-electrode cell was used in the experiments. A platinum wire was used as a counter-electrode. The cell used here was built to fit plane electrodes. The exposed area of the working electrode was
1.23 cm2. The main equipment used in this work was a PAR,
model 273A potentiostat/galvanostat coupled to a micro-computer with data acquisition software. Scanning Elec-tron Microscopy (SEM) was used to analyze the samples’ surface morphology.
The phosphatization conditions described below are dubbed hereinafter as PC-1, PC-2, PC-3, PC-4 and PC-5. Samples PC-1 to PC-4 were obtained by batch phosphatization, while sample PC-5 was obtained through a continuous process in a metal processing plant.
Degreasing was carried out using a 3% concentration of a commercial product at 60 °C for 1.5 min. The refining process was used to obtain phosphate grain size variations. In the PC-1 condition, a concentration of 3 g/l of a com-mercial product was used for 50 s, and the same product was used for 10 s for the PC-2 condition, but with a 0.3 g/l concentration. A different commercial product with an 0.3 g/l concentration was used for 5 s in the PC-3 tion. The refining process was not used in the PC-4 condi-tion. The phosphatization process was common to all the conditions, using a commercial tricationic phosphatization (Zn/Fe/Mn) solution which was kept at 60 °C for 20 to 25 s. The passivation process, applied to all the samples, employed a commercial product with 1 g/l, pH 4.3. The solution was kept at 60 °C for 1.5 min. All the specimens were dried in hot air.
3. Results and Discussion
3.1 Characterization of the Phosphate Layer
The grain size was evaluated based on the average value obtained through eight different grain size analyses made on each side of the phosphatized galvanized foils (see
Ta-ble 1). A slight dispersion was found between the grain size obtained for side A (front) and side B (back). Eight analy-ses were made of each face to determine the grain size. The layer weight is also shown in Table 1.
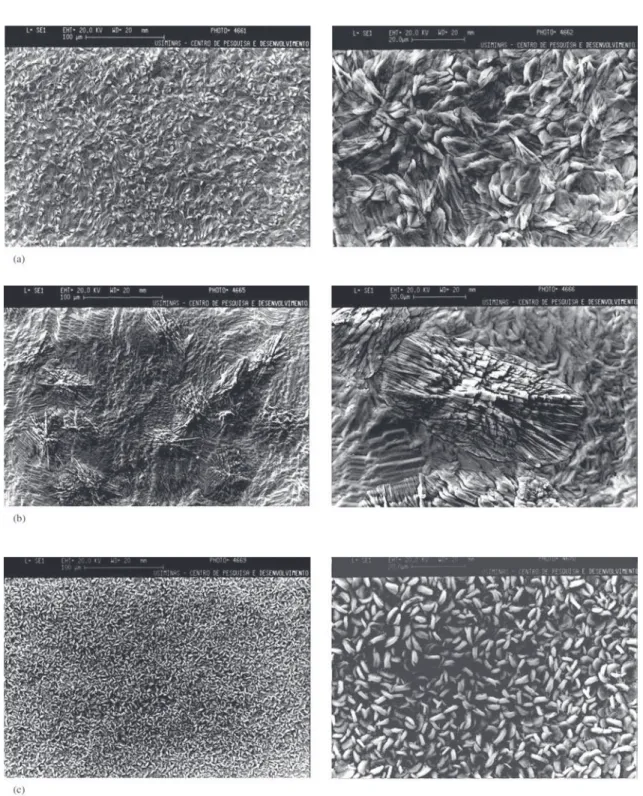
Figure 1 presents SEM micrographs showing the super-ficial state of the phosphate layer and variations according
to the phosphatization condition used. The PC-1, PC-2 and PC-3 phosphatization conditions show a similar morphol-ogy (needle-shaped crystals) common for batch processes but with different the crystal sizes. The PC-4 condition shows an aspect characteristic of the absence of the refining proc-ess, while condition PC-5 shows the morphological charac-teristic of phosphate layers obtained through continuous aspersion processes.
3.2 Passivation Concentration Solution and Sweep Rate
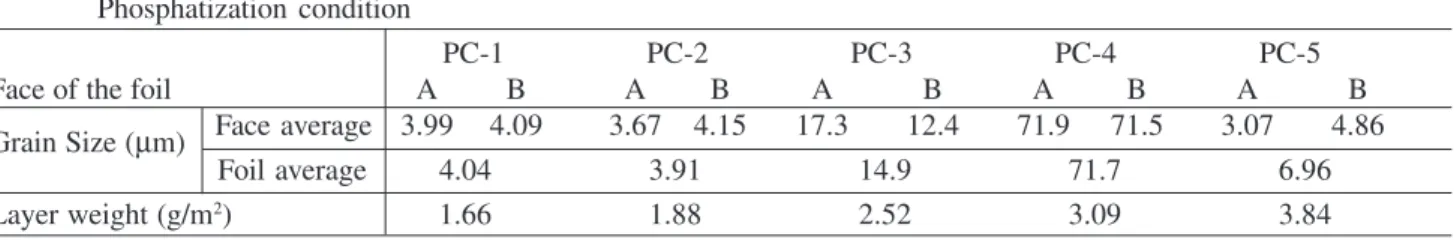
To elucidate the influence of the passivation concentra-tion soluconcentra-tion, four different concentraconcentra-tions were tested: 0.25 M; 0.5 M; 0.75 M and 1.0 M, as given in Fig. 2a.
Based on Fig. 2a, it was found that increasing the con-centration of the solution led to a clearer definition of the zinc dissolution/passivation peak, heightening the sensibil-ity for the measurement of the charge denssensibil-ity involved in the substrate passivation process.
An analysis of Fig. 2b revealed that a lower sweep rate resulted in a better definition of the dissolution/passivation peak. According to these results, a 0.75 M Potassium
Bi-carbonate solution and a 10 mV/s sweep rate were selected to take the voltammetric measurements.
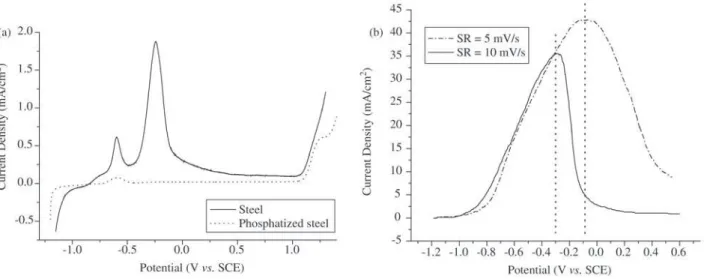
Two characteristics peaks were found in the steel voltammetry, probably associated with oxidation reactions
of iron to Fe2+ and Fe3+ (Fig. 3a). In Fig. 3a, for the
phosphatized steel case, only a small peak was visible, cor-responding to reactions through the phosphate pores and cracks discussed earlier herein.
A description is given below of the steel foils used in this study, which hereinafter are referred to as steel – bare 1020 steel foil; galvanized steel (GS) – 1020 steel foil sub-jected to galvanization; phosphatized steel - 1020 steel foil subjected to phosphatization (without a zinc interlayer) and galvanized phosphatized steel-galvanized steel subjected to phosphatization.
In regard to the electrochemical behavior of the galva-nized steel foil, it was observed that the passivation process started at a potential of around -950 mV (vs. SCE), as shown in Fig. 3b.
A comparison of the charges involved in the galvanized steel passivation process (Fig. 3b) and the charges involved Figure 2. Influences of (a) potassium bicarbonate solution concentration and of (b) sweep rate (SR) on the zinc passivation voltammetries (pure zinc electrode).
Table 1. Grain size and weight of the phosphate layer for used phosphatization conditions. Phosphatization condition
PC-1 PC-2 PC-3 PC-4 PC-5
Face of the foil A B A B A B A B A B
Grain Size (µm) Face average 3.99 4.09 3.67 4.15 17.3 12.4 71.9 71.5 3.07 4.86
Foil average 4.04 3.91 14.9 71.7 6.96
in the passivation of the phosphatized steel (Fig. 3a), in the
potential range of -1000 to -300 mV (vs. SCE), led us to
conclude that the phosphate layer did not react significantly with the dissolution/passivation solution during anodic po-larization.
The dotted lines in Fig. 3b indicate the passivation curve peaks for the two different sweep rates used. The charge density used to calculate the porosity corresponds to the area under the curve up to the passivation peak (half peak charges).
3.3 Passivation Charge Density Determination
The value of the standard passivation charge density (Q0pass) involved in the passivation process of galvanized
steel foil without a phosphatized layer (Fig. 3b) was
calcu-lated a 1.906 mC/cm2 for a sweep rate of 10 mV/s.
After selecting the experimental conditions, i.e., passivation solution, range of potentials for the passivation process, and standard dissolution/passivation charge for the uncoated substrate, the phosphate porosity was determined. Voltammetric anodic polarization measurements were taken for each phosphatization condition (PC-1 to PC-5, described in section 2) and the passivation charge of the coated substrate, Qpass, was calculated. The coating porosity index for each of these phosphatization conditions was then de-termined, based on the Qpass and Eq. 1.
3.4 Determination of Porosity
Reference Fig. 4 presents the behavior of the galvanized sample under phosphatization condition PC-5, revealing a well-defined passivation peak. This behavior indicates a
Figure 4. Voltammetries for galvanized and phosphatized steel foil, Phosphatization condition = PC-5, Solution: 0.75 M KHCO3, SR = 10 mV/s.
Figure 3. (a) Voltammetries for the steel and for phosphatized steel, SR = 5 mV/s, (b) Voltammetries for galvanized steel, SR = 5 and 10 mV/s; Solution: 0.75 M KHCO3.
coating with little porosity. All the other measurements for PC-1, PC-2 and PC-3, which are not shown herein, revealed a similar behavior. Due to its peculiar conditions of grain size and morphology, PC-4 presented incoherent results not discussed here.
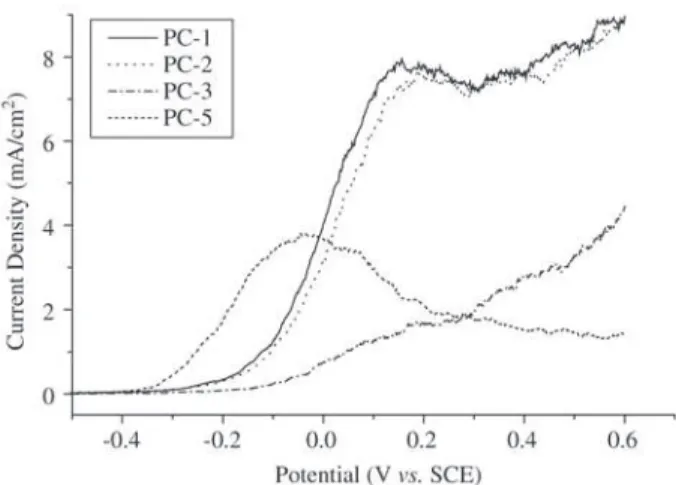
Figure 5. Voltammetries for phosphatized galvanized steel foil, Phosphatization conditions: PC-1, PC-2, PC-3 and PC-5, Solution: 0.75 M KHCO3, SR = 10 mV/s.
Figure 6. Comparison among the voltammetries for galvanized steel, phosphatized steel (without zinc) and galvanized phosphatized steel, Phosphatization conditions: PC-1, PC-4 and PC-5, Solution: 0.75 M KHCO3, SR = 10 mV/s.
nized and phosphatized steel foil. The galvanized and phosphatized foils displayed a cathodic behavior in rela-tion to the galvanized foils.
Figure 6 shows a typical behavior for foils processed under the phosphatization condition PC-4. In this condi-tion, the measurements indicated severe exposure of the substrate and porosity indexes greater than 100%, probably associated with substrate dissolution occurring during the phosphatization process. This substrate dissolution process increases the superficial rugosity of the zinc substrate, giv-ing incorrect values for passivation charge density. For this reason, this condition will be disregarded in future analy-ses.
The porosity indexes were determined for each phosphatization condition using the above-mentioned pro-cedure and equation (see Table 2). The porosity for each phosphatization condition was then plotted based on these indexes, the average grain size and the weight of the phos-phate layer (see Table 1).
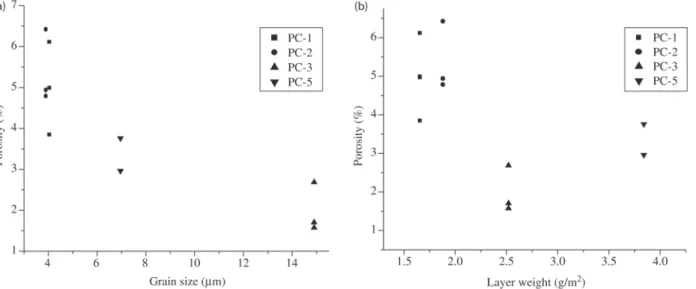
A reveals a tendency for the porosity level of the phos-phate layer to decline as grain size increases. This behavior indicates a correlation between the porosity level and the grain size that allows the porosity level for phosphate coat-ings or phosphate grain size to be estimated by interpolat-ing values at the resultinterpolat-ing curve. The phosphatization con-dition PC-4, which corresponded to large grains (See Table 1), displayed extremely high porosity indexes and was not considered herein.
Plotting the porosity and the layer weight (Fig. 7b)
showed an inversion of the porosity value for foils proc-essed under phosphatization conditions PC-5 and PC-3 com-pared to Fig. 7a. This inversion may be evidence of the morphological influence of the grain’s shape. The morphol-ogy of these grains is shown in the micrographs presented in Fig. 1, where the phosphate crystals obtained under phosphatization condition PC-3 display a flatter structure (needle-shaped), favoring a lesser porosity than the struc-ture obtained for grains under condition PC-5 (disc-shaped).
Table 2. Values of areas until the passivation peak, passivation charge density and porosity indexes for the analyzed foils, SR = 10 mV/s.
Foil Number of Area until Passivation charge Porosity
measures peak* (cm2) density* (mC/cm2) Index (%)
GS 2 19.06 1.906 1
PC-1 3 1.108 0.111 4.98
PC-2 3 1.197 0.197 5.38
PC-3 3 0.442 0.044 1.99
PC-5 2 0.748 0.075 3.36
* Averaged values. Comparing the different voltammetries (Fig. 5) for
phosphatization conditions PC-1, PC-2, PC-3 and PC-5 showed, as mentioned earlier, a potential displacement for phosphatization condition PC-5 in relation to phosphatization conditions PC-1, PC-2 and PC-3. This dis-placement may have originated from modifications in the electrochemical characteristics of the substrate/coating sys-tem caused by variations in the phosphatization process.
Some voltammetries for galvanized steel, phosphatized steel, and phosphatized galvanized steel under the PC-1,
PC-4 and PC-5 conditions given in Fig. 6show the same
galva-4. Conclusions
The experimental conditions fit the previous behavior established for the application of the voltammetric anodic dissolution – VAD technique, in other words,
• The substrate suffered no chemical attack in the disso-lution/passivation solution;
• The substrate became passivated when anodically po-larized;
• The coating remained inert in the potential range in which the passivation process occurred.
The VAD technique used in this study showed a good level of sensibility, allowing for phosphate coating porosity on galvanized steel to be determined for grain sizes and layer weights varying in a range of 1%.
The degree of phosphate porosity or grain size under different phosphate processing conditions was also estimated by interpolating values of the results obtained.
Acknowledgements
This study was supported by Usiminas S.A., which sup-plied steel foils and resources for the development of the project, and by Chemetall S.A., which supplied phosphatization baths and phosphatized foils for the vari-ous conditions analyzed. Finally, we would like to thank the Brazilian research funding institution CAPES and the Brazilian National Petroleum Agency – ANP for their fi-nancial support.
References
1. Carlos, I.A. D.Sc. Thesis, Universidade Federal de São Carlos, USP-IFQSC, 1990.
Figure 7. Variation of the porosity with a) the grain size and b) the weight of the phosphate layer, Solution: 0.75 M KHCO3, SR = 10 mV/s.
2. Julve, E. Determinación de la porosidad de los recubrimientos metálicos obtenidos por vía electrolítica: 1. Métodos utilizados en talleres galvanotécnicos, Pintura y Acabados, p. 80-86, 1986.
3. Roos, J.R.; Celis, J.P.; Chonglun, Fan. Coulometric
meas-urement of the porosity in thin nickel coatings, J.
Electrochem. Soc., v. 137, n. 04, p. 1096-1099, 1990.
4. Leisner, P.; Benzon, M.E. Porosity measurements on coat-ings, Trans. Inst. Metal Finishing, v. 75, n. 2, p. 88-92,
1997.
5. Notter, I.M.; Gabe, D.R. The electrochemical thyocianate porosity test for tinplate, Trans. Inst. Metal Finishing, v.
68, p. 59-94, 1990.
6. Notter, I.M.; Gabe, D.R. Polarization resistance methods for measurement of the porosity of thin metal coatings,
Corrosion Science, v. 34, n. 5, p. 851-870, 1993.
7. Hoar, T.P. The electrochemistry of protective metallic coatings, J. Electrodepositors’ Tech. Soc., v. 14, p.
33-46, 1938.
8. Evans, U.R.; Shome, S.C. Studies in the discontinuities
in electrodeposited metallic coatings - Part I, J.
Electrodepositors’ Tech. Soc., v. 26, p. 137-160, 1950.
9. Evans, U.R.; Shome, S.C. Studies in the discontinuities
in electrodeposited metallic coatings - Part II, J.
Electrodepositors’ Tech. Soc., v. 27, p. 45-64, 1951.
10. Evans, U.R.; Shome, S.C. Studies in the discontinuities
in electrodeposited metallic coatings - Part III, J.
Electrodepositors’ Tech. Soc., v. 27, p. 65-74, 1951.
11. Losch, A.; Schultze, J.W.; Speckman, H.-D. A new electrochemical method for the determination of the free
surface of phosphate layers, Anais do EUROCORR’91,
12. Weng, D.; Jokiel, P.; Uebleis, A.; Bohemi, H. Corrosion and protection characteristics of zinc and manganese coatings, Surface & Coatings Technology, v. 88, p.
147-156, 1996.
13. Ponte, H.A.; Maul, A.M. Análise por técnica eletroquímica da porosidade de revestimentos sobre superfícies metálicas. Anais do XV Congresso Brasileiro de Engenharia Mecânica, COBEM 1999, Águas de
Lindóia, SP, CD-Rom, 1999.
14. Ponte, H.A.; Maul, A.M. Análise quantitativa da porosidade de eletrodepósitos por dissolução anódica voltammetric, I – Eletrodepósitos de níquel sobre cobre,
Anais do Interfinish Latino Americano, EBRATS 97,
São Paulo, SP, CD-Rom, 1997.
15. Maul, A.M. M.Sc. Thesis, Análise por técnica
eletroquímica da porosidade de revestimentos sobre superfícies metálicas, Universidade Federal of Paraná,