*e-mail: [email protected]
Deformation Induced Martensite in an AISI 301LN Stainless Steel:
Characterization and Influence on Pitting Corrosion Resistance
Hamilton Ferreira Gomes de Abreua*, Sheyla Santana de Carvalhoa,
Pedro de Lima Netoa, Ricardo Pires dos Santosa, Válder Nogueira Freirea,
Paulo Maria de Oliveira Silvab, Sérgio Souto Maior Tavaresc
a
Universidade Federal do Ceará – UFC, Centro de Tecnologia,
Departamento de Engenharia Metalúrgica e de Materiais, Campus do Pici Bloco, 714, Pici,
60455-760 Fortaleza - CE, Brazil
b
Petrobras, Lubnor, Fortaleza - CE, Brazil
cUniversidade Federal Fluminense, Brazil
Received: March 6, 2007; Revised: November 21, 2007
In austenitic stainless steels, plastic deformation can induce martensite formation. The induced martensite is related to the austenite (γ) instability at temperatures close or below room temperature. The metastability of austenite stainless steels increases with the decreasing of stacking fault energy (SFE). In this work, the deformation induced martensite was analyzed by X ray diffraction, electron back scatter diffraction (EBSD), magnetic methods and atomic force microscope (AFM) in samples of a low SFE austenitic stainless steel, AISI 301LN and compared with a medium SFE stainless steel, AISI 316L. Both techniques, X ray diffraction and EBSD, presented similar quantities for the α’-martensite. Texture results indicate that the crystallographic orientation of the formed α ’-martensite is {001}<110> and {103}<110>. The morphology of α’-martensite was analyzed by AFM. Corrosion tests showed that deformation reduces pitting corrosion and generalized corrosion resistance in both steels.
Keywords: corrosion, austenitic stainless steel, induced martensite
1. Introduction
The deformation process can induce the formation of two types of martensite in austenite stainless steels: ε and α’. The ε martensite is hcp and paramagnetic while α’ is bcc and ferromagnetic. The transformation sequence γ→ε→α’ was proposed by some authors1,3 for AISI 304 and 316 deformed by tension and rolling. On the other hand the direct transformation γ→α’ through dislocation reactions was found to be possible3.
The amount of ε and α’ martensite depends on processing pa-rameters such as stress state, temperature and rate of deformation4. It is also of great influence the steel composition and stacking fault energy.
The Equation 1, developed by Eichelman and Hull4, gives an approximation of α’martensite formation temperature (Ms). This temperature falls in the range of cryogenic temperatures for all 300 austenitic stainless steels.
Ms (°C) = 1302 – 42(%Cr) – 61(%Ni) – (1) 33(%Mn) – 28(%Si) – 1667 (%[C + N])
The plastic deformation supplies the necessary energy for the martensite transformation. This energy can increase the temperature of martensite formation to Md (the temperature below which mar-tensite will form under deformation). Angel et al.5 have studied the dependence of temperature with composition for different steels and formulated Equation 2.
Steels that present higher values of Md, for example AISI 301 and AISI 304, are more susceptible to form induced martensite when deformed at room temperature. Steels like AISI 316 or AISI 321, that present low values for temperature Md, generally do not present strong martensite formation when deformed at room temperature4.
Md(30/50)(°C) = 413 – 13.7(%Cr) – 9.5(%Ni) – (2) 8.1(%Mn) – 18.5(%Mo) – 9.2 (%Si) – 462 (%[C + N]) Stacking fault energy Stacking Fault Energy é (SFE) is another important factor that affects the formation of martensite. Schramm and Reed developed an expression to relate chemical composition to stacking fault energy (Equation 3)6.
SFE(mJ.m–2)= –53 + 6.2(%Ni) + (3)
0.7(%Cr) + 3.2(%Mn) + 9.3(%Mo)
The metastability of austenite stainless steels increases with the decrease of SFE.
The crystallographic texture of different low SFE steels has be-ing studied by many authors7-10. It is expected a copper-type texture for austenite in 301LN and also in 316L steels. For martensite, it is frequently to assume that the transformation texture follows relations like Kurdjumov-Sachs or Nishiama-Wasseman but true relations are irrational and cannot be expressed by rational numbers. The crystal-lographic set includes the habit plane and shape deformation apart from the orientation relation9,10.
2.
Experimental
Samples of commercial stainless steels AISI 301LN with 17.91 Cr, 6.53 Ni, 1.80 Mn, 0.79 Si, 0.17 Mo, 0.18 Cu, 0.10 N wt. (%) and balance of Fe were solution treated at 1100 °C for one hour and cold rolled 5, 10, 26 and 47% in thickness. In order to compare the main results, a sheet of commercial AISI 316L stainless steel with the 16.91 Cr, 9.97 Ni, 1.72 Mn, 0.62 Si, 2.68 Mo, 0.12 Cu, and with other elements less than 0.1 (wt. (%)), was cold rolled with the same reductions in thickness and submitted to the same tests.
X ray diffraction was performed in a Philips X ray diffractometer model X’Pert Pro using KαCu with an attached monochromator. The volumetric fraction was determined by comparing the average of integrated areas and the proportionality theoretical factors of peaks (220) and (311) for austenite, (200) e (211) for α’-martensite ac-cording the procedure suggested by De et al.14. To perform the AFM height and friction measurements, samples were put on steel sample disks and treated with N2 jets. The surfaces of samples were scanned in air with a Nanoscope IIIa Multimode (Digital Instruments, Santa Barbara, CA, U.S.A.) by contact mode at a scan of about 0.500 Hz and 10 x 10 µm of size, with Si3N4 cantilevers (Digital Instruments) at spring constant of about 0.15 N.m–1, and tip radius of 15 nm. AFM scan controls were appropriately adjusted to avoid tip artifacts during scanning of the samples. The height and friction images obtained were processing with Nanoscope software version 5.12 r3. Magnetization saturation was measured in a Vibrating Sample Magnetometer (VSM) EGG-PAR model 4500 with maximum applied field 400 kA.m–1, time constant 10 ms and total measuring time 30 minutes. The study of texture was performed by two techniques: EBSD for low deformed samples and X ray diffraction for deformations higher than 10%. The EBSD study was performed in samples annealed, cold rolled 5% and 10% in thickness in an Oxford Crystal 300 EBSD system attached to a SEM Philips XL-30. Macro-texture measurements were made by X ray diffraction with Co radiation measuring three incomplete pole figures for α’-martensite and for austenite with maximum tilt of 75°. Orientation distribution functions (ODF) were calculated using ADC method with the software Labotex with 3 pole figures for each phase. Corrosion resistance tests were in accordance with ASTM G-48-03 standard, method A with FeCl3.6H2O solution. Surfaces analyses were performed in accordance ASTM G-46-94 standard.
3. Results
3.1 Microstructure
Table 1 compares values of Ms, Md and SFE of AISI 301LN with AISI 316L, medium stacking fault energy steel. The values were calculated with Equations 1, 2 and 3. Both values for Ms are in the sub-zero scale. Md values, temperature that 50% of austenite is transformed to martensite with 30% of deformation, suggest that the formation of martensite at room temperature for AISI 301LN is much easier. The value of SFE for AISI 301LN is very low indicating a weak stability of austenite phase in this steel.
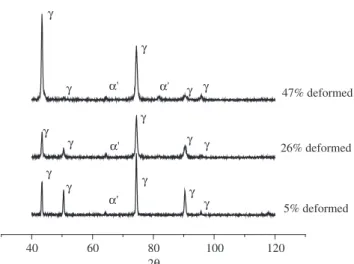
Figure 1 shows X ray diffractograms for samples of AISI 301LN cold rolled 5, 26 and 47% in thickness. The three diffractograms show only phases γ and α’. There is no peak indicating the presence of ε
martensite. Kumar et al.7, working with cold rolled AISI 304 stainless steel, also did not detected the presence of ε martensite. Gey et al. and Humbert et al.9,10 characterized deformed AISI 304 samples and detected the presence of ε martensite. They have used a different apparatus. The transformation was performed in a sub-zero tension test with small deformations. It was showed that ε martensite is only a step of the transformation. Increasing deformation, it transforms to α’-martensite. Probably, for the amount of deformation applied in this work, the reaction γ→ε→α’ has been completed. The amount of martensite increases with cold rolling deformation. X ray diffrac-tion technique indicates 14, 46 and 60% of martensite for samples cold rolled 5, 26 and 47% respectively. The diffractograms for AISI 316L cold rolled 5, 26 and 47% are on Figure 2. The martensite amount measured by this technique for AISI 316L were respectively 6.5, 7 and 8%.
In agreement with X ray diffraction results, Figure 3 shows the magnetization curves of samples of both steels after deformation. The magnetization saturation increases with cold deformation in both steels confirming the α' generation by the γ→α' reaction.
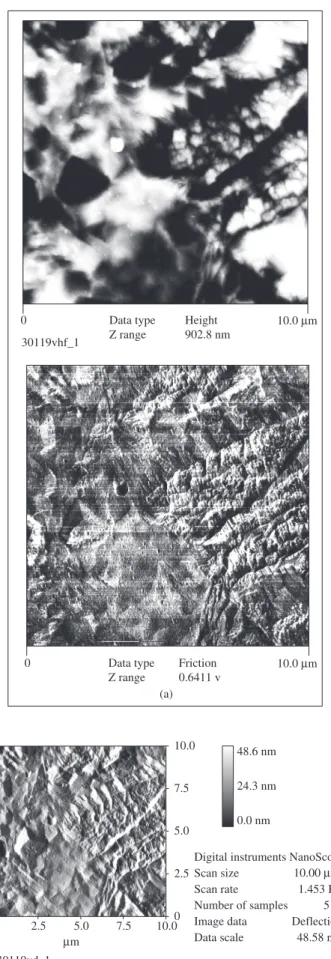
Figure 4a and 4b were taken using AFM in topography and deflec-tion modes. They present martensite morphology for an AISI 301LN
Table 1. Values of Ms, MD and SFE.
Sample Ms (°C) Md(30/50) (°C) SFE (mJ.m–2)
AISI 301LN –161.8 19.1 7.4
AISI 316L –179.6 –67.1
50.8
Figure 1. X ray diffractogram showing only phases γ and α’ in AISI 301LN.
Figure 2. X ray diffractogram showing only phases γ and α’ in AISI 316L.
40 60 80 100 120
5% deformed γ γ γ γ γ γ γ γ α' α' α'
α' α' α' α' α' α' 2 47% deformed 26% deformed
40 60 80 100 120
α' α'
Figure 3. Magnetic results for both steels.
deformed 5% in thickness. The austenite (γ) was etched out during the sample preparation and it appears flat in the figure. The deformation induced martensite has a needle shape and is being stopped by an austenite grain. For the sample cold rolled 47% in thickness martensite also has a needle shape (Figure 5) but in this picture is possible to see needles of martensite being stopped by others martensite needles. Both topography and deflection modes presented to be very efficient in revealing induced martensite.
3.2. Texture
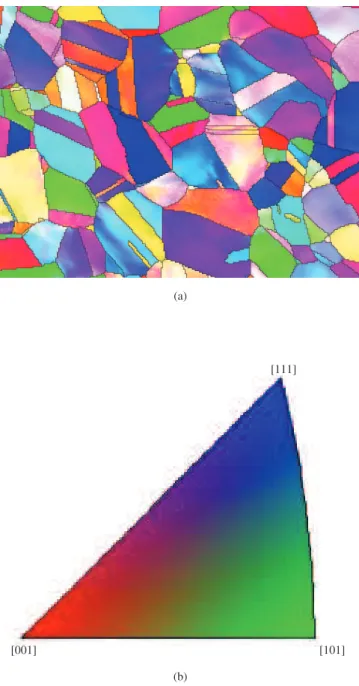
Figure 6a presents EBSD pattern quality map of a sample in the solution treated condition. The microstructure is typical of an austenitic stainless steel presenting only the austenite phase. It was not verified the presence of martensite. Grain size is ASTM 7.4. The orientation color key is presented on Figure 6b. There is a weak texture {112}<uvw> characterized by the great number of blue to violet grains.
Figures 7a and b present EBSD map showing orientation over a quality map of a 301LN sample deformed 5% in thickness. The α’-martensite phase (Figure 7a) shows a preferred orientation [101]// ND observed in by the higher incidence of green grains. Figure 7b shows phases, austenite and martensite. From EBSD results for this sample, it is possible to say that crystallographic texture of the austenite is {hkl}<111>. For martensite, it is frequently to assume that the transformation texture follows relations like Kurdjumov-Sachs or Nishiama-Wasseman but true relations are irrational and cannot be expressed by rational numbers. The crystallographic set includes the habit plane and shape deformation apart from the orientation relation12,13. The EBSD analysis also indicated 15.5% of α’-martensite close to the result obtained by the X ray diffraction technique.
On Figure 8a and 8b, it is presented a phase map over a qual-ity map of a 301LN sample with 10% of thickness reduction. The amount of martensite measured by this technique increased to 19%. The preferred orientation of α’-martensite is [101]//RD but with some deviation to [212]//RD and [259]. The austenite phase presents three preferred orientations: [225]//RD, [310]//RD and [321]//RD.
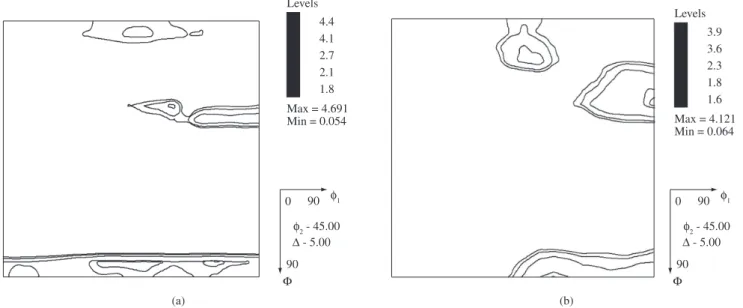
To analyze texture evolution for samples cold rolled 26 and 47% it was not possible to get a good EBSD pattern so texture was studied by X ray diffraction The AISI 301LN in the initial condition is 100% austenite. The ODF section for φ2 = 45° for austenite (Fig-ure 9a) presents main components: {110}<111>, {110}<112> brass component, {110}<001> Goss component and {112}<111> copper component. Figure 9b is the ODF section for φ2 = 45° for austenite
Data type Z range
10.0 µm
0 Friction
0.6411 v
0 Data type
Z range 30119vhf_1
Height 902.8 nm
10.0 µm
10.0
7.5
5.0
2.5
0
µm
10.0 7.5 5.0 2.5 0
Digital instruments NanoScope Scan size
Scan rate Number of samples Image data
10.00 µm 1.453 Hz
512 Deflection Data scale 48.58 nm
48.6 nm
24.3 nm
0.0 nm
30119vd_1
(a)
(b)
Figure 4. AFM image of martensite for a sample deformed 5%. a) friction
mode; and b) deflection mode. 0 2500 5000 7500 10000 12500
0 20 40 60 80 100 120 140
316L-26 and 5% deformed 316L-47% deformed 301LN-5% deformed 301LN-26% deformed 301LN-47% deformed
Magnetization (emu.g
–1)
0 Data type Z range 30110vhf_1
Height 1504 nm
10.0 µm
0 Data type
Z range
10.0 µm Friction
0.9553 v
Figure 5. AFM image of martensite for a sample deformed 26% (friction
mode).
cold rolled 47%. Main texture components are quite the same for the sample without deformation with the difference that the orienta-tion {110}<111> moves toward {112}<111>, copper component. These results are in accordance with others works published in the literature7-9. The evolution of austenite texture with deformation for an AISI 304L stainless steel was studied by Ravi Kumar et al.8 and one of their conclusions is that the copper component will not increase density with high levels of deformation. They attribute the unchanging of this density to martensite transformation. The AISI 316L in the initial condition is also totally austenite and presents weak texture similar to 301LN (Figure 10a). Main components after
(a)
(b)
Figure 6. a) EBSD pattern quality map of the annealed sample of AISI301LN;
and b) Key orientation color map.
deformation are {110}<001> Goss component, {110}<112> brass and {110}<111> (Figure 10b).
Cold rolling of AISI 301LN transforms austenite in a textured martensite. Figure 11 shows ODF for the induced martensite deformed 26 an 47% (a and b). Main components for the sample cold rolled 26% are: {111}<112>, {111}<011> and {001}<110>. The 47% deformed sample presents a sharp texture component with the rolling direction parallel to <110>. The main components are {113}<110>, {112}<110> and {001}<110> with ODF values of 16.5, 9.8 and 6.8 respectively.
As emphasized by Bhadeshia in many works, for example in his book Geometry of Crystals11, the martensite transformation requires the existence of a habit plane, an interface plan between austenite and martensite that remains unchanged. Figures 12 a and b are inverse pole figures for austenite in annealed condition and cold rolled 47%.
[111]
(a) (b) Levels
4.4 4.1 2.7 2.1 1.8
Max = 4.691 Min = 0.054
φ - 45.00 - 5.00 0 90
90 φ1
Levels
3.9 3.6 2.3 1.8 1.6
Max = 4.121 Min = 0.064
φ - 45.00 - 5.00 0 90
90 φ1
Figure 9. ODF section for φ2 = 45° for austenite in 301LN. a) without deformation; and b) 47% deformed.
(a) (b)
Figure 7. EBSD pattern quality map of the 5% cold rolled sample. a) martensite; and b) austenite.
Figure 8. EBSD pattern quality map of the 10% cold rolled sample. a) martensite; and b) austenite.
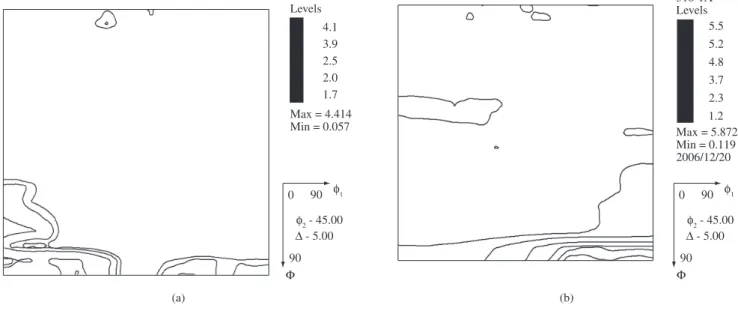
Levels 4.1 3.9 2.5 2.0 1.7
Max = 4.414 Min = 0.057
φ - 45.00 - 5.00 0 90
90 φ1
(a) (b)
Levels 5.5 5.2 4.8 3.7 2.3 1.2 Max = 5.872 Min = 0.119 316-1A
2006/12/20
φ - 45.00 - 5.00 0 90
90 φ1
Figure 10. ODF section for φ2 = 45° for austenite in 316L. a) without deformation; and b) 47% deformed.
(a) (b)
Levels 2.5 2.3 2.1 2.0 1.4 Max = 2.772 Min = 0.264
φ - 45.00 - 5.00 0 90
90 φ1
Levels
Max = 18.242 Min = 0.007
17.1 16.0 14.8 13.7 12.5 11.4 10.3 8.0 6.8 5.7 4.6 3.4 2.3 1.0
φ - 45.00 - 5.00 0 90
90 φ1
Figure 11. ODF section for φ2 = 45° for martensite in 301LN. a) 26% deformed; and b) 47% deformed.
(a) (b)
111
101 001
001 INV
111
101 001
001 INV
A plan with orientation between (112) and (225) are presented in both pole figures. This orientation is in accordance to Porter14 that estimates the habit plan for martensite in stainless steels being {225}γ.
3.3. Effect of deformation on pitting corrosion resistance
Pitting corrosion resistance tests of both AISI 301LN and AISI 316L were made in accordance with ASTM G48-03 standard, method A with FeCl3.6H2O solution. Surface analyses were performed in accordance with ASTM G-46-94 standard. Figure 13 displays the influence of the deformation in the number of pits for both studied materials. This figure shows that the number of pits increases with deformation for both studied steels which is associated to defects introduced in both materials by the deformation process leading the arisen of preferential sites for pits nucleation12. Figure 13 also shows that for the as-received materials, the AISI 301LN presents higher pits number than the AISI 316L while the number of pits was similar for the studied materials deformed 26%. Finally, for the material deformed 47%, the AISI 316L presents higher number of pits than AISI 301LN. Thus, the results presented in Figure 13 shows that for deformation lesser than 26% the AISI 316L is the more pit corrosion resistant material, while for higher deformation the AISI 301LN presented better pit corrosion resistance than AISI 316L.
The influence of the deformation in the generalized corrosion of both materials was also analyzed and the dependence of the de-formation in the mass loss of both materials in FeCl3.6H2O solution is displayed in Figure 14. This graph shows that the increase in the deformation leads to an increase in the mass loss of both materials, indicating that the deformation is a deleterious process for the gen-eralized corrosion resistance. Another observation is that the AISI 301LN is lesser corrosion resistant to generalized corrosion than the AISI 316L in all the studied conditions. The influence of deforma-tion on corrosion resistance is stronger on 301LN than in 316L. The presence of Mo in the composition is probably one of the responsible by the better resistance to pitting corrosion in AISI 316L. The higher volume fraction of α' martensite in AISI301LN seems to decrease pit corrosion resistance. The decrease of corrosion resistance with cold deformation and α’ martensite was also observed by Barbucci et al.16 in an AISI 301 steel tested in 1 M H2SO4 media.
4. Conclusions
Microstructure changes produced by cold rolling a 301LN stain-less steel were analyzed in this work. Thickness reductions by cold rolling between 5 and 46% in thickness were applied at room tem-perature. Deformation induced martensite (α') was quantified by X ray diffraction and checked by EBSD. The results obtained by these two methods were very close and revealed that the amount of α' increases exponentially in the range of deformation analyzed. Texture evolution was analyzed by EBSD in samples with low deformation. Orientations relations close to the Kurdjmov-Sachs {111}γ//{110}α were observed in samples with low deformation. The atomic force microscope re-vealed to be a strong technique to characterize deformed martensite in austenitic stainless steel. For the amount of deformation studied in this paper, the pitting corrosion and generalized corrosion resistance decrease with the increase of volume fraction of martensite.
Acknowledgments
Authors are grateful do Metrofor for giving the material for experiments and CNPq for the financial support. The authors also would like to acknowledge the Laboratory of Material Deforma-tion at Seoul NaDeforma-tional University for the permission for using the software REDS.
References
1. Mangonon JR, Thomas G. Martensitic transformation in metastable austenitic stainless steel. Metall. Trans. 1970; 1:1587-1594.
2. Seetharaman V, Krishman P. Influence of the martensitic transformation on the deformation behavior of an AISI 316 stainless steel at low tem-peratures. J. of Materials Scince. 1981; 16:523-530.
3. Alteinberger I, Scholtes B, Martin V, Oetel H. Cyclic deformation and near surface microstructures of shot peened or deep rolled austenitic stainless steel AISI 304. Materials Science and Engineering A. 1999; 264:1-16.
4. Padilha AF, Rios PR. Decomposition of austenite in stainless steel. ISIJ International. 2002; 42(4):325-337.
5. Padilha AF, Plaut RL, Rios PR. Annealing of cold-worked austenitic stainless steels. ISIJ International. 2003; 43(2):135-143.
6. Schram RE, Reed RP. Stacking fault energies of Austenitic Stainless Steels. Metallurgical Transactions A. 1975; 6A:1345-1351.
7. Ravi Kumar B, Singh AK, Mahato B, De PK, Bandyopadhyay NR, Bhat-tacharya DK. Deformation-induced transformation textures in metastable austenitic stainless steel. Materials Science and Engineering A. 2006; 429:205-211.
8. Ravi Kumar B, Mahato B, Bandyopadhyay NR, Bhattacharya DK. Comparison of rolling texture in low and medium stacking fault energy austenitic stainless steels. Materials Science and Engineering A. 2005; 394:296-301.
Figure 13. Increase of the number of pits with deformation.
0 10 20 30 40 50
0 5 10 15 20 25 30 35 40
Number of pits /mm
2
Deformation (%) AISI 301LN
AISI 316L
Figure 14. Increase of mass loss with deformation.
0 10 20 30 40 50
0.00 0.05 0.10 0.15 0.20 0.25 0.30 0.35 0.40 0.45 0.50
Mass loss (mg.mm
–2)
Deformation (%) AISI 301LN
9. Gey N, Petit B, Humbert M. Electron backscattered diffraction study of ε⁄α´ martensitic variants induced by plastic deformation in 304 stainless steel. Materials and Metallurgical Transactions A. 2005; 36A:3291-3299.
10. Humbert M, Petit B, Bolle B, Gey N. Analysis of the γ→ε→α´ variant selection induced by 10% plastic deformation in 304 stainless steel at -60oC. Materials Science and Engineering A. 2007; 454-455:865-867.
11. Bhadeshia HDK. Geometry of Crystals. 2nd edition. Institute of Materials:
London; 2001.
12. Kundu S, Bhadeshia HDK. Crystallographic texture and intervening transformation. Scripta Materialia. 2007; 57:869-872.
13. De KA, Murdock DC; Mataya MC. Quantitative measurement of deformation-induced martensite in 304 stainless steel by X-ray diffrac-tion. Scripta Materialia. 2004; 50(12):1445-1449.
14. Porter DA, Easterling KE. Phase Transformations in Metals and Alloys. 2nd edition. Chapman & Hall, 1992.
15. Kamachi MU, Shankar P, Ningshen S. On the pitting corrosion resistance of nitrogen alloyed cold worked austenitic stainless steels. Corrosion Science. 2002; 44(10):2183-2198.
16. Barbucci A, Dellucchi M, Panizza M, Sacco M, Cerisola G. Electrochemi-cal and corrosion berraviour of cold rolled AISI 301 in 1M H2SO4. Journal