Tribology in Industry
www.tribology.fink.rs
Comparative of the Tribological Performance of
Hydraulic Cylinders Coated by the Process of
Thermal Spray HVOF and Hard Chrome Plating
R.M. Castro
a, L.C.C. Cavaler
a, F.M. Marques
a, V.M. Bristot
a, A.S. Rocha
ba Faculty SATC,Laboratory Automation and Simulation of Hydraulic and Pneumatic Systems – LASPHI, Department
of Mechanical Engineering and Automation, Criciúma, SC – Brazil.
b UFRGS – Universidade Federal do Rio Grande do Sul, Laboratory of Mechanical Manufacturing – LdTM, Porto
Alegre, RS – Brazil.
Keywords:
Wear Hydraulic Hard Chrome Thermal Spraying HVOF
A B S T R A C T
Due to the necessity of obtaining a surface that is resistant to wear and oxidation, hydraulic cylinders are typically coated with hard chrome through
the process of electroplating process.However, this type of coating shows an
increase of the area to support sealing elements, which interferes directly in the lubrication of the rod, causing damage to the seal components and bringing oil leakage. Another disadvantage in using the electroplated hard chromium process is the presence of high level hexavalent chromium Cr+6 which is not only carcinogenic, but also extremely contaminating to the environment. Currently, the alternative process of high-speed thermal spraying (HVOF - High Velocity Oxy-Fuel), uses composite materials (metal-ceramic) possessing low wear rates. Research has shown that some mechanical properties are changed positively with the thermal spray process in industrial applications. It is evident that a coating based on WC has upper characteristics as: wear resistance, low friction coefficient, with respect to hard chrome coatings. These characteristics were analyzed by optical microscopy, roughness measurements and wear test.
© 2014 Published by Faculty of Engineering
Corresponding author:
R.M. Castro
Faculty SATC, Department of Mechanical Engineering and Automation,
Brazil, SC
E-mail: [email protected]
1.
INTRODUCTION
Technologically, the last 15 years the hydraulic systems were strongly developed, either in regard to increasing work pressure, capacity and reliability. However, the requirements for the degree of purity of the fluids used in systems have not been a corresponding development, which consequently makes it impossible to obtain the maximum yield of new technologies
[1]. One of the main constituent components of the hydraulic systems are the cylinders (actuators), which in turn depend on the filtration efficiency to prevent contamination and consequently the wear. In addition to internal contamination, the hydraulic cylinders are subject to external contamination, because its rod is responsible for the linear movement and, this makes the effects of external abrasive agents may act harshly [2]. With this action, the
R
E
S
E
A
R
C
interface elements are formed, causing small cuts and grooves in rods and, as a consequence, oil leakage and loss of mechanical efficiency of the hydraulic system (Fig. 1).
The pressure (P) of input of hydraulic cylinder oil is converted to force and displacement acting on a piston. The effect of leakage in a hydraulic cylinder become more apparent when premature wear and shirts rods of the hydraulic cylinders and therefore the changes in force and velocity (ν) occur. At steady state operation the actual internal or external leakage QL and, frictional forces, acting
cylinders must be taken into consideration. Therefore, mechanical energy supplied to the load is smaller than the hydraulic power supplied. Therefore the rate of flow and return is calculated by considering the variables of input or output flow (Q1-Q2) and the resulting area of piston and
rod respectively Ap and Ar (Eq.1) [3].
1 L 2 L
p r
Q Q Q Q
v
A A
− −
= = (1)
Fig. 1. Hydraulic cylinder: (a) external leakage and
(b) rod whit hard chrome after 400,000 cycles [4].
Another factor important to achieve the confidence functional of the sealing system of the hydraulic cylinders is the quality and finish of the surface to be sealed. Surface irregularities must be within the required conditions. The characteristics most often used to describe the micro superfície are the roughness parameters Ra, Rz and Rmáx, these are defined in DIN/ISO
4287 [5]. As the efficiency of hydraulic sealing is also related to the quality of the surface of the rods, each case must be studied in a unique way, making of the differential components of these manufacturers. These features alone, is not sufficient to adapt to sealing technology [15].
Furthermore, the support area to sealing (parameter Rmr) roughness is required because
we can have equal values for Ra and totally
different to the previous parameter quoted. The Rmr value is defined as the ratio of the
effective length of the roughness at a given
cut-off (c) the length evaluated, and the result represented in percentage profile. The material ratio curve represents the percentage of material found cut into a level (c) spaced from the highest point of the profile (Fig. 2). Also known as the Abbott - Firestone curve (BAC), this curve is a graphical representation of the parameter variation due to the equipment listing Rmr, for different levels "c" of the evaluated
length [6].
Fig. 2. Curve related to the proportion of material,
ISO 4287.
One of the most accepted methods to characterize surface processes produced by sanding, polishing or burnishing is proposed by DIN EN ISO 13.565-2 [7]. This method is to approximate the BAC curve for three straight and split the surface texture in three regions: higher peaks, profile core and lower valleys. The implementation of this model is based on a line of minimum slope, obtained for a range of contact fraction equal to 40 %. From this we can calculate the parameters shown in Fig. 3. To ensure proper functioning of the sealing on the rod, the Ra should have its equivalent to 0.2 µm
value, and a value Rmr of 80 % [8].
Fig. 3. Representation of parameters Rmr DIN EN ISO
13565-2.
One method of manufacturing metallic coatings most widespread and that presents application in rods of hydraulic cylinders, providing excellent results with regard to surface finish and durability, is High Velocity Thermal Spray (HVOF). This method has great advantages over other processes due to its high capacity spray of molten particles at high speeds (approximately 900 m/s), resulting in a very dense coating with high adhesion and low oxide contents [9]. The
a b Leakage
technique is based on the special design of the torch in the fuel spray, typically propane, propylene, methyl acetylene, allene, hydrogen or kerosene is mixed with oxygen and burned in the combustion chamber, where the flame is compressed and then released, the strong acceleration occurring gases, together with particles used in powder form (Fig. 4). In this type of pistol powder feeding is performed immediately after the expansion of gases entering the combustion chamber and out with high kinetic and thermal energy and transport the particles to the substrate to be coated.
Fig. 4. Gun used by the thermal spray process [10].
2. EXPERIMENTAL PROCEDURE
This section aims to show the steps and methodology that was used to develop this important research to research which is the mechanical manufacturing.
2.1 Materials e Tribological Tests
To establish a comparison of the coefficient of friction the coatings were needed prepare the specimens plans. The specimens were taken from a steel bar AISI / SAE 1045. The tribological tests were performed using the pin-on-disk testing, according to ASTM G-99 (Fig. 5).
Fig. 5. ASTM G99-04: (a) Equipment and (b)
Schematic of the test.
During the execution of the test was used to measure pin with hardness of 1528 HV manufactured tungsten carbide, this applied to the Normal force (Fn) of 30 N. The dimensions of
the pin used were 3 mm diameter and 15 mm length. During the test produced the linear velocity was 0.47 m/s at a radius of 15 mm, the total reaching distance of 500 m.
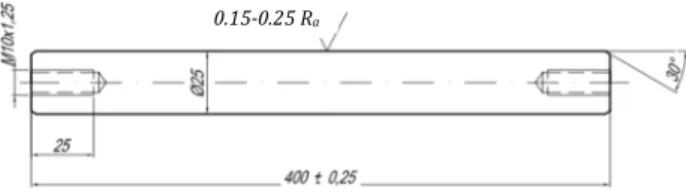
For the realization of tribological, tests rods in operating conditions specimens with a diameter of 25 x 400 mm in length, as shown in Fig. 6, were made. According to the parameters to be
evaluated as a leakage, roughness and
macroscopic rods, these measures will be adequate enough.
Fig. 6. Rod of hydraulic cylinders
The rods were made with a 24.8 mm nominal diameter, since the deposition via HVOF thermal spray should comprise thicknesses in the range 0.05 to 0.2 mm due to the compressive stresses that intensify the loosening. However, for the
deposition of hard chromium were
manufactured with a nominal diameter of 24.6 mm, knowing that the hard chrome coatings cannot be longer than 20 µm. The roughness parameters identified in Fig. 6 represents the final finish of the rod. In order to get a representative response over the previous defined parameters, the organization of bench tests followed according to Table 1.
Table 1. Identification of the rods used in the tests.
Number of the rods Quantity Coatings 01, 02, 03 03 Hard Chrome 11, 12, 13 03 WC-CoCr
2.2 Tests in Real Operating Conditions
For testing rod and seal, a module was developed to characterize the coatings in service, as the action of abrasive wear and parallel to it, to quantify the leakage of fluid during the tests in order to compare with chrome hard and WC-CoCr. Fig. 7 shows a test. Coatings
Substrate Nozzle
Powder with nitrogen Fuel
Oxygen
Compressed air
a b
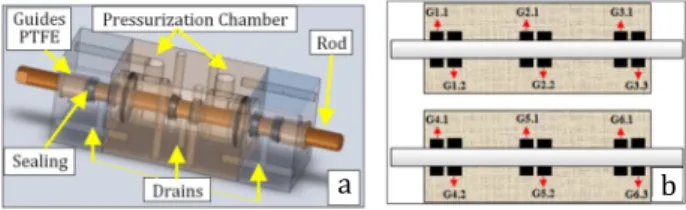
Fig. 7. Trial module with its main components.
The test module consists of a master load actuator, which drives both rods each test, and these in extreme hydraulic pressure, caused by actuation of the manual hydraulic pump. In order to accelerate the wear of the rod assembly and sealing two blocks were used with indoor drilled, used to amplify the strength of the seal against the surface of the rod during testing.
To accelerate the process of surface modification during rehearsals, or influence the appearance of the cut action or plowing the rods, mineral oil was contaminated with the abrasive materials (SiO2). In its contamination, was used silica with
a particle size ranging from 230 to 270 μm. Analysis of the contamination of the hydraulic fluid showed that it falls into the following classes: ISO Class 22/21/20 and NAS 99. The result of NAS Class 99 is a value that does not exist in this table contamination class, which runs from 00 to 12. That is, the particle counter indicates this manner, fluids which are contaminated with the upper class specified in the standard [11]. During tests were monitored manually the main conditions imposed on tests such as hydraulic working pressure, linear velocity of the rods and the working temperature in the test module, as shown in Table 2.
Table 2. Parameters used in tests of the rods.
Item Parameters Values 1 Operating Pressure 100 bar 2 Linear Velocity 40 mm.s-1
3 Displacement Rods 50 mm 4 Operating Temperature 25 a 62 °C 5 Daily Cycles 6.500 6 Number of Cycles 60.000 7 Medium Viscosity Oil 68 mm2.s-1
8 Diameter of the Rods 25 mm 9 Roughness Ra 0,14 a 0,21μm
A set of rods and seals was being used as the set
consists of a rod with hard chrome
electroplated, a rod with sprayed WC-CoCr, twelve gaskets PolyPak Parker® type B and four tapes guide PTFE with brass.
Before conducting the tests, were determined punctual surface roughness of the rods, where occurs displacement the seals, for a comparison of the surfaces after the tests. However, before the tests there was also the need of measurements of the diameter of seals in order to try to make a comparison, as the distortion of each sealing profiles. The conditions and parameters were defined based on the specifications of the major components involved,
mentioned previously. The key to the
achievement of controlled bench testing
parameters are reported in Table 2.
The configuration of the rods and seals used in the tests is shown in Fig. 8. For each module block of six seals of the same profile previously defined were used.
Fig. 8. Schematic conditioners blocks rods: (a) 3D view
of the block and (b) nomenclature of sealing elements.
To get a count of the total displacement time for the test, was developed a small electric control system, where the sum of the number of cycles in each phase was defined automatically by the value set on a counter. Were used two inductive sensors to measurement position displacement of the rods, a hydraulic power unit for displacing the load, a micro programmable controller for the development of logic operation and a solenoid valve (Fig. 7). The analyzes were made with polyurethane sealants Parker PolyPak® type B with an internal diameter of 25 mm, external diameter 32 mm, section of 7 mm and 3.5 mm. According to the manufacturer, the seal may act in a temperature range of 35 ºC to 80 ºC.
As seen in eq. 1, it is observed that the leakage flow has direct influence on the load capacity and speed changes in a hydraulic cylinder. This leakage effect can be internal or external, and internal and is difficult to detect. In the case of
Manual Pump
Pressurization kit for seals
Electric Drive Micro Programmable
Beakers Actuator
Load
Rods
Guides
PTFE Pressurization Chamber
Sealing
Rod
this measurement performed, the objective was to quantify the external oil leak in order to further characterize the areas where there was a slip of the sealing elements and guides. The objective was to verify if indeed the changes suggested for the new coating could contribute to the reduction of leakage in the hydraulic cylinders.
The volume of oil lost (leakage) in accordance with changes of surfaces and stem seals was quantified with the aid of plastic cylinders with hexagonal base, and these volumetric capacities and resolutions of 25 and 0.5 ml, respectively. These cylinders were connected to the drain regions of the test module, as shown in Fig. 7 and 8. The measurements of the leak were acquired over the 60,000 cycles, totaling 6 measurements each set of rods, with stops every 10,000 cycles.
3. ANALYSIS OF RESULTS
The results obtained by using the methodology described in "Experimental Procedure" are presented below. Initially shows the results of the tribological tests, comparison of roughness, wear of the sealing and rods and measurements of leakage.
3.1 Tribological Tests
During this trial it was also observed evolution of the coefficients of friction for the two shells, resulting in an average of 0.67 for hard chrome and 0.56 for WC-CoCr (Fig. 9) value. The hard chrome coating presented a stable friction coefficient from approximately 50 seconds of test, however with a slight increase during the test. In WC- CoCr coating was found to be stable at 200 seconds, with a slight reduction in the coefficient of friction. Unlike the hard chrome compared to WC-CoCr may be related to their higher roughness values of the specimens , the associated wear mechanisms as plastic deformation (effect of low hardness relative to pin) and perhaps indicative of adhesion of the surface material and pin . It can perhaps explain the decrease in the friction coefficient of the coating of WC- CoCr the formation of oxides, which play the role of lubricant over the sliding surface [12].
In both coatings in the instability zone (start of the test) , the mechanism of friction is caused primarily by the phenomenon of adhesion, friction forces resulting from the relative motion
between the pin and the disc should be approximately equal to the force required to break bonds resulting high local pressure, which acts between the peaks of the roughness [13] .
Fig. 9. Coefficient of friction of coatings Hard Chrome
and WC-CoCr.
In both coatings in the instability zone (start of the test) , the mechanism of friction is caused primarily by the phenomenon of adhesion, friction forces resulting from the relative motion between the pin and the disc should be approximately equal to the force required to break bonds resulting high local pressure, which acts between the peaks of the roughness [13] .
3.2 Comparison of Roughness
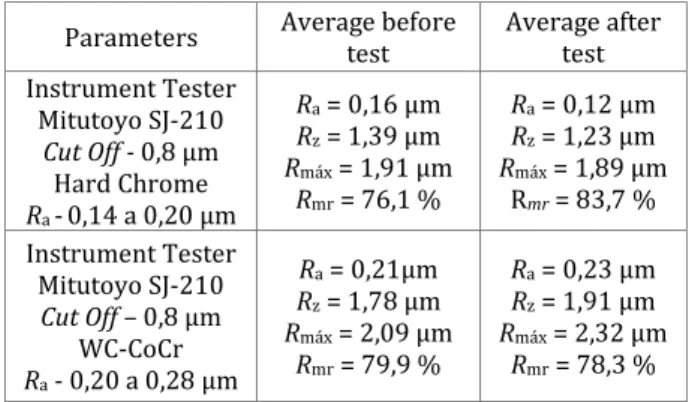
In the Table 3 the results of average before and after the tests, carried out in the regions where the sliding surface of the rods occurred roughness are presented. It can be seen that the hard chrome coating presented with a significant decrease in mean roughness Ra, Rz
and Rmáx.
Table 3. Parameters and roughness of the rods.
Parameters Average before test
Average after test Instrument Tester
Mitutoyo SJ-210
Cut Off - 0,8 μm
Hard Chrome
Ra -0,14 a 0,20 μm
Ra = 0,16 μm
Rz = 1,39 μm
Rmáx = 1,91 μm
Rmr = 76,1 %
Ra = 0,12 μm
Rz = 1,23 μm
Rmáx = 1,89 μm
Rmr = 83,7 %
Instrument Tester Mitutoyo SJ-210
Cut Off – 0,8 μm
WC-CoCr
Ra - 0,20 a 0,28 μm
Ra = 0,21μm
Rz = 1,78 μm
Rmáx = 2,09 μm
Rmr = 79,9 %
Ra = 0,23 μm
Rz = 1,91 μm
Rmáx = 2,32 μm
Rmr = 78,3 %
This indicates that the sliding action of the seals and guides for this coating decreased the peaks in the surface profile, showing its wear and polishing. Still on the hard chrome, scratches
0.30 0.35 0.40 0.45 0.50 0.55 0.60 0.65 0.70 0.75 0.80
0 100 200 300 400 500 600 700 800 900 1000
C
o
e
ff
ic
ie
n
t
o
f
f
ri
ct
io
n
(
μ
)
Time (s)
Hard Chrome
linearly, probably originated by sand (SiO2),
used in purposeful contamination of hydraulic oil (Fig. 10) were observed.
Fig. 10. Curve support material (Abbott-Firestone):
(a) before testing and (b) after the test - hard chrome.
Considering the values of the parameter to Rmr
rods coated in hard chrome, it is identified that there was an increase of 9.2 % over 60,000 cycles, meaning that there is a trend of failure in sealing, if the test was taken a further cycling. The purpose of seal failure is clearly explained by the lack of minimal lubrication between the sliding surfaces occur, because the peaks and valleys in the correct proportions influence this effect. In Fig. 10 it is evident that the curves for the profiles support (support area of the fence), before and after the tests show exactly this increased level surface, justified by the slope of the Abbott curve. It is noted that in Fig. 5 which occurred decreased initial curve defined by the peaks of the surface area. Furthermore, it is also possible to evaluate the decrease of the roughness profiles of Fig. 11.
Fig. 11. Profile evaluation of chrome rods: (a) before
testing and (b) after the test.
Considering that the action of the polishing surface is more significant than the act of creation of new irregularities for hard chrome, you can follow the action with this polishing reducing Rpk values on
the y axis, 18 % in Fig. 10 (a) to 8 % in Fig. 10 (b). Besides reducing of the peak region of the profile, there is a slight increase also in the valley region, probably associated with the mechanisms of wear, shown in Fig. 16.
With values also acquired the surfaces of the rods coated WC-CoCr, it appears that there is no evidence of significant modification of Ra and Rz
parameters, or any significant increase in area of support (parameter Rmr), which characterizes
the non-polishing the surface. This is visually confirmed by the appearance of the stems (Fig. 18). One can also explain the small reduction in Rmr parameter, because the appearance of
porosity, characteristic of the HVOF process. Figs. 12 and 13 shows the results obtained from the profile for the WC-CoCr.
Fig. 12. Curve support material (Abbott-Firestone):
(a) before testing and (b) after the test - WC-CoCr.
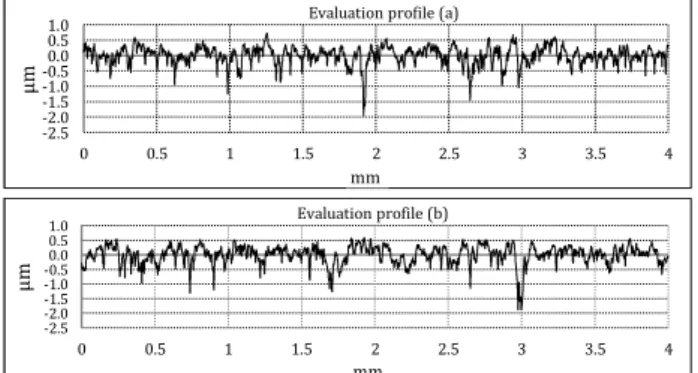
Fig. 13. Profile evaluation of WC-CoCr: (a) before
testing and (b) after the test.
Unlike hard chrome, possibly the Fig. 12 (b) can justify the increase of the parameters Ra and Rz
coating the base of WC-CoCr, the small change of the area in the valley region, and therefore keeping the initial curve justified this by the low wear rate presented in visual form.
Figure 14 shows the mean roughness parameters before and after the test for the hard chrome coating.
Fig. 14. Average roughness before and after the test
the hard chrome.
-2.0 -1.5 -1.0 -0.5 0.0 0.5 1.0
0 0.5 1 1.5 2 2.5 3 3.5 4
m
Evaluation profile (a)
-2.0 -1.5 -1.0 -0.5 0.0 0.5 1.0
0 0.5 1 1.5 2 2.5 3 3.5 4
μ
m
Evaluation profile (b)
-2.5 -2.0 -1.5 -1.0 -0.50.0 0.5 1.0
0 0.5 1 1.5 2 2.5 3 3.5 4
μ
m
Evaluation profile (a)
-2.5 -2.0 -1.5 -1.0 -0.50.0 0.5 1.0
0 0.5 1 1.5 2 2.5 3 3.5 4
μ
m
Evaluation profile (b)
0.16 1.39 1.91 0.12 1.23 1.81 0.00 0.40 0.80 1.20 1.60 2.00 2.40 2.80
1 2 3
R o u g hn e ss ( μ m
) Roughness - beforeRoughness - after
76.1 83,7 72.0 75.0 78.0 81.0 84.0 87.0 90.0 93.0 96.0 99.0 P e rc e n ta g e ( % ) Before test After test Initial curve Initial area
(peakes) Initial area (valleys)
End area (peakes)
End area (valleys)
0 20 40 60 80 100
[%] 0 20 40 60 80 100 [%]
0
25
50
75
100
[%] 0
25 50 75 100 [%] mm
a b
mm
Ra Rz Rmáx Rmr
Initial curve Initial area (peakes) Final area (peakes) Final area (valleys) Initial area (valleys)
0 20 40 60 80 100 0
0 20 40 60 80 100
[%] 25 50 75 0 25 50 75 100 [%] [%] [%] 100
a b
mm
By observing the average roughness parameters for hard chrome before and after the test, it can be seen that Ra, Rz and Rmáx has reduced after the
test and Rmr parameter increased by
approximately 4.5 %. This behavior suggests that after testing with SiO2 contaminated with oil, the
peaks were broken by reducing the distance between them, but at the same time on the same regions showed modifications of surfaces such as small scratches and cuts, and that influenced the permanence values, because it is an average. The increased Rmr parameter indicates that the rate of
the length of the support increased, and became the most stable component, but it is important to remember that high values of Rmr (> 90 %)
contribute to the deformation of the sealing
elements, since the lubrication becomes
inefficient. In Fig. 15 lists the roughness parameters for the WC-CoCr coating.
Fig. 15. Average roughness before and after the test
the WC-CoCr.
By observing the average roughness parameters for WC- CoCr coating before and after the test, it can be seen as opposed to hard chrome Ra, Rz
and Rmáx had their expanded values , however
Rmr parameter it was reduced. This trend
suggests that the material would not suffer significant wear during the test. In contrast with the reduction of Rmr, the length of the support
surface decreased, estimating that the
component gets a little instability.
In both coating before and after the test, the value of the parameter Ra is in the range
suggested by the researchers of the
Wüstenhagen and Steep [8], which is 0.05 to 0.3 µm. However, under the same conditions for the parameters Rmáx values were very close to the
limit (Rmáx< 2.5 µm), especially the WC-CoCr
coating after the test.
The hard chromium plating has achieved the biggest difference for Rmr parameter, considering
the same test time compared to the WC-CoCr coating, while the chrome was a modification of the area and support of 4.5 %, the WC-CoCr had
only 1.5 %, noting that the range suggested by Steep and Wüstenhagen is 50 % < Rmr <90 %,
with optimal value of 80 % .
In Table 4 shows the percentage difference between the average roughness parameters before and after the test for the coatings of hard chromium and WC-CoCr.
Table 4. Difference in % of the coatings.
Coatings Ra Rz Rmáx Rmr
Hard Chrome 25,00 11,51 5,20 11,27 WC-CoCr 8,45 3,22 11,06 2,01
In general, Table 4 suggests that the major differences between before and after the test are for the hard chrome coating, which demonstrates the inferiority of this, compared to WC-CoCr. You can also highlight the percentage difference of 11.06 % in Rmáx parameter to the sprayed coating.
Again this fact can also be explained by the appearance of pores viewed through microscopy.
3.3 Wear of the Sealing and Rods
In Fig. 16 shows the images acquired from rods coated with hard chrome, with the aid of a digital microscope. The Fig. 16 (a) and (b) shows the images so that you can serve in the qualification process/identification of surface characteristics with initial testing.
Fig. 16. Rods coated with hard chrome after the test
corresponding to 60,000 cycles module. 0.21
1.78
2.09
0.23
1.84
2.35
0.00 0.40 0.80 1.20 1.60 2.00 2.40 2.80
1.00 2.00 3.00
R
o
u
g
h
n
e
ss
(
μ
m
)
Roughness -before Roughness
-after 79,9 78,3
62.0 67.0 72.0 77.0 82.0 87.0 92.0 97.0
1
P
e
rc
e
n
ta
g
e
(
%
)
Before test After test
a b
c d
e f
Rod 1 – G1.1 – 12,5x Untested region
After the test
Scratches
Micro-Cuts
Rod 1 – G1.1 – 75x
Rod 2 – G2.1 – 20x Rod 2 – G1.1 – 20x Contact surface
with PTFE seal and guide
Misalignment (set for testing)
Direction test Rod 3 – G3.1 – 20x Rod 3 – G3.2 – 20x
Approximately 70 % of the tested surfaces of hard chrome showed up with some kind of micro mechanisms of wear, acting as drivers in the leakage process, result shown immediately below in Fig. 20 shows the occurrence of two types of abrasive mechanisms, known as micro scratches and micro cuts. The micro scratches is characterized by low depth of plowing , however this feature is nonetheless important to the study because it provides evidence that the surface became vulnerable in the presence of an abrasive material. Since the process micro cuts is characterized by a deeper and this effect could be catastrophic, given airtightness surfaces that require fluid. In Fig. 16 (c) and (d), the wear mechanisms also act, but a little less severe form. These facts lead to an indication that the service life of sealing elements can be decreased. There is also another important characteristic change in the surface rods, hard chrome, Fig. 16 (e). After the measurements of roughness was found that the bearing surface (support Rmr)
increased by 9 %, leaving for a non-ideal conditions on the surfaces used for the sliding seal, in reference to Trelleborg, 2011 [15], this action is justified of polishing the Abbott-Firestone curve, shown in Fig. 10. This measured value of 83 % for Rmr parameter can modify the
required flow of lubrication of the surfaces, causing deformation of the sealing element over time, becoming inevitable occurrence of leakage. The region highlighted by Fig. 16 (f) shows what may occur in the case of a small misalignment of a
component coated with hard chrome
electroplated. It was identified by surface roughness, which was also a beginning of polishing the surface shown by the decrease of Ra
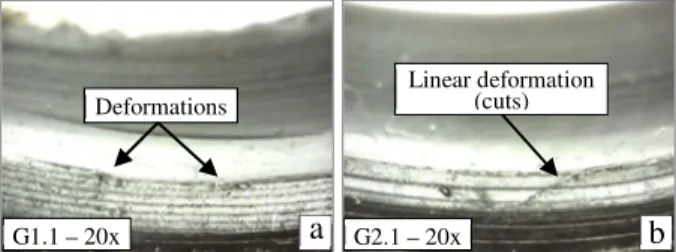
and increased Rmr. In Fig. 17 deformations found
in discrete regions of the sealing elements and used (Fig. 8), after testing bench are presented.
Fig. 17. Contact of the seal with the chrome rod. (a)
point G1.1 and (b) G2.1 point.
The images produced by optical microscopy reveal some small mechanisms acting on the seals after the tests. In Fig.17 (b), possibly
associated markings are there any silica particle that's been trapped for some time in the region of slip during the tests.
Figure 18 results with respect to the sliding WC-CoCr alloy surfaces are presented.
Fig. 18. Rods coated with WC-CoCr after the test
corresponding to 60,000 cycle’s module.
As shown in Fig. 18, a comparison of surface finish before and after the tests are shown to the Rods 11, 12 and 13 relating to the coating of the tungsten carbide base. The Fig. 18 (a) shows a shaft surface in a suitable condition for use in testing module. In Figs. 18 (b) and (c), it is observed that there was minimal change in the surface rods to 60,000 test cycles, preventing the display of wear mechanisms. However, Figs. 18 (e) and (f) presented in some regions tested section, some wells remembering the porosity effect. The results from Fig. 18 (a) and (b) it is identified that the evaluation of the surface profiles rods WC-CoCr, minor modifications obtained, and this suggests good response for wear. Images related seals rods in WC-CoCr
showed no significant deformation, the
presentation of results is unnecessary.
3.4 Measurements of Leakage
The results are shown in Fig. 19 leakage the number of cycles individually for the three trials of coatings.
G1.1 – 20x a G2.1 – 20x b
Deformations
Linear deformation (cuts)
a b
c d
e f
Rod 11 – G4.1 - 12,5x Untested region
Micro Scratches Rod 11 – G4.1 – 45x
Rod 12 – G5.2 - 20x Rod 13 – G6.1- 20x
Porosity
Rod 13 – G6.2 - 20x Rod 13 – G6.2 - 50x
Fig. 19. Total leakage (ml) of each coating for the three tests after completion of the 60,000 cycles. (a) hard chrome and (b) WC-CoCr.
It was observed that the leakage obtained by hard chrome surface during 60,000 cycles was higher than in the base coating of WC, and it is noticeable that always occur gradually.
During all tests in bench the oil temperature was monitored in order to justify the long and the end of the test the leakage of oil obtained. It is noticed that the first test for both hard chromium and for the toilet, the flow rates of leakage were higher compared to subsequent trials, and this fact can be explained by the increase of temperature (52-62 °C) perceived mainly after 10,000 cycles that step.
Even with this fact occurred during the first test, Fig. 19 (b) reveals that the leakage occurred is almost linear for the sprayed WC-CoCr coating, this indicates that the leakage rates (ml/cycles) throughout the test was almost constant. Then for chromium, the leakage rates were an exponential function nature, indicating a greater leakage over time. This result can also be explained through the recorded images of the rods after the tests and the surface modifications.
In Fig. 20 the average leakage and comparisons of surfaces, obtained after tests is presented. It is observed that the curve obtained for the hard chrome coating has a polynomial behavior, showing that there are other factors that may be interfering with the process of casting these rods, as the mechanisms of abrasive wear, represented through images (b) and (c) of Fig. 20.
Fig. 20. Comparison of the coating in relation to the
total average of leakage (ml) for all tests.
In the picture shown for the base coat toilet, no significant evidence of active mechanisms and this explains approximation with the linear form of the trend line, shown by the equation.
In this graph (Fig. 20) represent the curves related to the average for the two coatings after leak testing. It is observed that the curve obtained for the hard chrome coating has a polynomial behavior , showing that there are other factors that may be interfering with the process of casting these rods , as the mechanisms of abrasive wear , represented through images (b) and (c) of Fig. 20. In the picture shown for the coating of tungsten carbide, no significant evidence of active mechanisms and this explains approximation with the linear form of the trend line, shown by the equation.
The correlation index for hard chromium plating was 0.9987, indicating that the proposed model describes well the behavior of leakage varies according to the number of cycles.
Fig. 21. Flow leakage (QL). (a) each individual test
and (b) average and standard deviation of the tests.
In accordance with the curves of Fig. 20 can be somewhat expected failure of the seal and rod assembly used in order to minimize/eliminate these risks of accidental or functional equipment in each service.
The Fig. 21 (a) shows the leakage obtained for each test performed. However the bar graph, Fig. 21 (b) shows the average leakage and standard deviation for each coating. There was a low leakage into rods coated WC-CoCr, with lower standard deviation. This is indicative of better performance with respect to consistency in oil leakage.
In general for all tests, the hard chrome coating presented with greater leakage. In test 1 (rod 11), it is observe the leakage produced by the rod in hard chrome was 7 times greater than the rod coated WC-CoCr. In the second test (rod 12) was also superior leak for hard chrome, almost 4
39.5 11.5 16.0 0.0 8.0 16.0 24.0 32.0 40.0
0 10 20 30 40 50 60 70
L e a k a g e ( m l)
Cycles number x 1000
Chrome - Test 01 Chrome - Test 02 Chrome - Test 03
5.5 3.0 2.0 0.0 8.0 16.0 24.0 32.0 40.0
0 10 20 30 40 50 60 70
L e a k a g e ( m l)
Cycles number x 1000
WC-CoCr - Test 01 WC-CoCr - Test 02 WC-CoCr - Test 03
0.3 1.2 1.7 2.2 2.3 3.8 1.7 3.8 6.5 10.3 14.0 22.3 0.0 4.0 8.0 12.0 16.0 20.0 24.0 28.0 32.0 36.0
0 5 10 15 20 25 30 35 40 45 50 55 60 65
L e a k a g e ( m l)
Cycles of number x 1000 WC-CoCr Hard Chrome 0.0 10.0 20.0 30.0 40.0 5.5 3.0 2.0 39.5 11.5 16.0 L e a k a g e ( m l)
WC-CoCr Hard Chrome
22,3 3,5 15,1 1,8 0.0 2.5 5.0 7.5 10.0 12.5 15.0 17.5 20.0 22.5 25.0 L e a k a g e ( m l) Average Standard deviation
a b
WC-CoCr c b
a Hard Chrome
Test 1 Test 2
Test 3
Hard Chrome WC-CoCr b
times more. And in the third test (rod 13), also confirmed the superiority of the sprayed coating, hard chrome where indicated 8 times more oil spill recorded in ml.
4. CONCLUSION
In the test performed according to ASTM G99 (pin on disk), the WC-CoCr, showed a lower coefficient of friction and low roughness values, which implies a reduced heating and power dissipation for the components in relative motion allowing operations reduced lubrication. In this research the Ra parameter is efficient for
preliminary evaluation of the surface, however, as it is isolated from other parameters used in the evaluation, cannot help in determining the distribution of the peaks on the surfaces, impacting the sealing system. There was a reduction of 0.16 µm to 0.14 µm in the medium parameter Ra rods coated in hard chrome,
indicating that the sliding action of PTFE seals and guides decreased the peaks in the surface profile, showing the wear and polishing your . However rods coated with WC-CoCr showed little evidence in the modification of Ra, Rz, or
significant changes in the area of support Rmr,
featuring the surface polishing, justified also by the Abbott-Firestone curve and this is confirmed visually by the appearance of rod "unused" even after the tests.
The wear on the rods was quantified by measuring effects. It was found that coated surfaces of the rods by electrodeposition of hard chrome a larger number of scratches and cuts, causing some points of the level of leakage drain grow significantly. The WC-CoCr, coat showed up visually with only minor risks, justifying the high hardness and low friction coefficient.
The leakages purchased for the WC-CoCr were much lower compared with those acquired for hard chrome. The rods and seals were in good condition after 60,000 cycles. Probably one cycling outweigh 120,000 cycles without promoting major leaks. Although the standard deviation was high for both coatings, 15 % chromium and 1.8 % for the WC-CoCr, tests showed that under the same conditions for the three tests, the sprayed coating was very superior, the traditional chromium rods in hydraulic applications.
Although tests have provided a high standard deviation, one cannot overlook the superiority of the coating sprayed by HVOF on the effect of leakage, and all these results show that it is possible to replace the electrolytic chromium rods in hydraulic cylinders.
REFERENCES
[1] J.P.H. Thomsen: Practical Application of Oil-Flushing & Total Purity in Hydraulic and Lub. Oil
Systems, OffShore Oil and Gas International
Business, 15-05.2013, Esbjerg, Denmark, pp. 1–7.
[2] R.M. Castro, L.C.C. Cavaler, N.Z. Kejelin, F.W. Comeli, A.S. Rocha: Revestimento WC Depositado por Aspersão Térmica (HVOF) como Alternativa ao Cromo Duro Eletrodepositado aplicados em
Equipamentos Hidráulicos, in: CIBIM – Congreso
Iberoamericano de Ingeniería Mecánica,
Argentina, 04-11.2013, La Plata, AR, pp. 375.
[3] M.G. Rabie: Fluid Power Engineering, McGraw-Hill, 1º ed., Vol. 1, New York, 2009.
[4] B.D. Sartwell: Validation of HVOF Thermal Spray Coatings as a Replacement for Hard Chrome
Plating on Hydraulic/Pneumatic Actuators,
Department Of Defense, Environmental Security Technology Certification Program (ESTCP), Washington, 2006.
[5] ISO 4287, Geometrical Product Specifications (GPS) - Surface texture: Profile method - Terms,
definitions and surface texture parameters, 1997.
[6] R. Leach: The Measurement of Surface Texture
Using Stylus Instrument, Measurement Good
Practice Guide, No. 37, pp. 85. United Kingdom, 2001.
[7] C. Andretta: Brunimento para Recuperação das Camisas de Pistão dos Motores de Combustão
Interna, MSc. Dissertation, Departamento de
Engenharia Mecânica, Universidade Estadual de Campinas, São Paulo, 2001.
[8] F. Steep, G. Wüstenhagen: Counter surface
hydraulic seals for heavy duty applications,
Sealing Technology, Vol. 2006, No. 12, pp. 8-9, 2006.
[9] L. Pawlowski: The Science and Engineering of Thermal Spray Coatings. John Willey & Sons, 2ª ed. England, 2008.
[10] B. Flitney: Alternatives to Chrome for Hydraulic
Actuators, Sealing Technology, Vol. 2007, No. 10,
pp. 8-12, 2007.
[11] NAS 1638, Cleanliness Requirements of Parts
[12]W.C. Fang: Processing Optimization, Surface Properties and Wear Behavior of HVOF Spraying
WC–CrC–Ni Coating, Journal of Materials
Processing Technology, Vol. 209, No. 7, pp. 3561-3567, 2009.
[13]M.A. Chowdhury , D.M. Nuruzzaman, A.H. Mia, M.L. Rahaman: Friction Coefficient of Different Material Pairs Under Different Normal Loads and
Sliding Velocities, Tribology in Industry, Vol. 34, No. 1, pp. 18-23, 2012.
![Fig. 1. Hydraulic cylinder: (a) external leakage and (b) rod whit hard chrome after 400,000 cycles [4]](https://thumb-eu.123doks.com/thumbv2/123dok_br/18325069.350201/2.892.465.807.321.412/fig-hydraulic-cylinder-external-leakage-whit-chrome-cycles.webp)