Anion gap corrected for albumin, phosphate and
lactate is a good predictor of strong ion gap in
critically ill patients: a nested cohort study
INTRODUCTION
Evaluating the acid-base status of a critically ill patient is crucial, as it implies both prognostic and therapeutic considerations.(1-5) Elevated unmeasured anions
are a common cause of metabolic acidosis in such patients and may be related to prognosis.(3,6) he two most common ways to estimate unmeasured anions are Fernando Godinho Zampieri1,2, Marcelo Park1,3,
Otavio Tavares Ranzani1, Alexandre Toledo Maciel1,4, Heraldo Possolo de Souza1, Luiz Monteiro da Cruz Neto1, Fabiano Pinheiro da Silva1
1. Emergency Medicine Discipline, Hospital das Clínicas, Faculdade de Medicina, Universidade de São Paulo - USP - São Paulo (SP), Brazil. 2. Intensive Care Unit, Hospital Alemão Oswaldo Cruz - São Paulo (SP), Brazil.
3. Research and Education Institute, Hospital Sírio-Libanês - São Paulo (SP), Brazil.
4. Intensive Care Unit, Hospital São Camilo - São Paulo (SP), Brazil.
Objective: Corrected anion gap and strong ion gap are commonly used to estimate unmeasured anions. We evaluated the performance of the anion gap corrected for albumin, phosphate and lactate in predicting strong ion gap in a mixed population of critically ill patients. We hypothesized that anion gap corrected for albumin, phosphate and lactate would be a good predictor of strong ion gap, independent of the presence of metabolic acidosis. In addition, we evaluated the impact of strong ion gap at admission on hospital mortality.
Methods: We included 84 critically ill patients. Correlation and agreement between the anion gap corrected for albumin, phosphate and lactate and strong ion gap was evaluated by the Pearson correlation test, linear regression, a Bland-Altman plot and calculating interclass correlation coeicient. Two subgroup analyses were performed: one in patients with base-excess <-2mEq/L (low BE group - lBE) and the other in patients with base-excess >-2mEq/L (high BE group - hBE). A logistic
regression was performed to evaluate the association between admission strong ion gap levels and hospital mortality.
Results: here was a very strong correlation and a good agreement between anion gap corrected for albumin, phosphate and lactate and strong ion gap in the general population (r²=0.94; bias 1.40; limits of agreement -0.75 to 3.57). Correlation was also high in the lBE group (r²=0.94) and in the hBE group (r²=0.92). High levels of strong ion gap were present in 66% of the whole population and 42% of the cases in the hBE group. Strong ion gap was not associated with hospital mortality by logistic regression.
Conclusion: Anion gap corrected for albumin, phosphate and lactate and strong ion gap have an excellent correlation. Unmeasured anions are frequently elevated in critically ill patients with normal base-excess. However, there was no association between unmeasured anions and hospital mortality.
This study was conducted at the Hospital das Clínicas of the Faculdade de Medicina of the Universidade de São Paulo - USP - São Paulo (SP), Brazil.
Conflicts of interest: None.
Submitted on August 13, 2013 Accepted on August 22, 2013
Corresponding author: Fernando Godinho Zampieri Disciplina de Emergências Clínicas
Rua Dr. Enéas de Carvalho Aguiar, 255, 5º andar Zip code: 05403-000 - São Paulo (SP), Brazil E-mail: [email protected]
Ânion gap corrigido para albumina, fosfato e lactato é um bom
preditor de íon gap forte em pacientes enfermos graves: estudo de
coorte em nicho
ABSTRACT
Keywords: Acid-base equilibrium/ physiology; Critical illness; Blood chemical analysis; Serum albumin/blood; Phosphate/ blood; Lactate/blood; Prognosis
the anion gap (AG) calculation and the physicochemical approach of the strong ion gap (SIG) calculation, as described by Stewart.(4,7)
here are some caveats in the interpretation of the AG. AG is usually calculated as ([Na] + [K] - [HCO3 + [Cl]), ignoring the efects of other relevant compounds, such as albumin, lactate and phosphate.(7) To reine the
meaning of AG as a surrogate for unmeasured anions, AG can be adjusted for such ions.(3) he calculation
of SIG, on the other hand, is cumbersome and not practical at the bedside, although it yields results that are believed to be better estimates of unmeasured anions.(8)
he use of AG to predict SIG has been performed in other studies,(9-12) mostly in acidotic patients,(9,11)
but no studies have reported the prediction of SIG using phosphate-corrected AG. Moreover, there are also few reports on the presence of unmeasured anions in the absence of “measured” metabolic acidosis (i.e., normal base excess - BE),(5,11) and the exact impact
of unmeasured anions on prognosis is unclear.(13-15)
herefore, this study aimed to evaluate the performance of the anion gap corrected for albumin, phosphate and lactate (AGCAPL) to predict SIG in a mixed population of critically ill patients. We hypothesized that AGCAPL would be a good predictor of SIG and that the prediction capability would be independent of the presence of metabolic acidosis, as evaluated through base excess. As a secondary objective, we also evaluated the association between admission SIG values and hospital mortality using logistic regression.
METHODS
his study is a nested prospective cohort study that included 84 critically ill patients who were admitted to the intensive care unit (ICU) from January 2011 to December 2012. We included patients who took part in a prospective observational study that aimed to evaluate inlammatory markers in critical illness.(16)
After informed consent was obtained from the patient or legal representative, blood was collected during ICU admission. General laboratory data were processed, and the results were stored on a database. Patients were followed until death or hospital discharge using hospital´s online system. he study was approved by the local Hospital das Clínicas ethics committee (registration number 1.207/09).
AG was calculated as [([Na] + [K] - [Cl] - [HCO3]). AGCAPL was calculated as AGCAPL = [([Na] + [K] - [Cl] - [HCO3]) - (2 x albumin g/dL + 0.5 x phosphate mg/ dL) - [lactate mmol/L]], as previously shown.(7) SIG was
deined as the diference between apparent and efective strong ion diference (SIDa and SIDe, respectively). SIDa was calculated as SIDa = [Na] + [K] + [Mg] + [Ca] - [Cl] - [Lactate]. SIDe was calculated as SIDe = 12.2 × pCO2/ (10-pH) + 10 × [albumin] × (0.123 × pH - 0.631) + [PO
4-]
× (0.309 × pH - 0.469). Blood gas analysis and lactate measurement were performed using an OMNI analyzer (Roche Diagnostics System, F. Hofmann, La Roche Ltd, Basel, Switzerland).
Data were tested for normality using the Kolmogorov-Smirnof or Shapiro-Wilkes test, as appropriate. Continuous normal data were compared using the t-test or analysis of variance. Continuous data that were not normal were compared using the Mann-Whitney test or Kruskal-Wallis test, as appropriate. Fisher’s exact test or Chi-squared tests were used for dichotomous variables.
After conirming the normal distribution of the involved variables, we analyzed the correlation between AGCAPL and SIG using a Pearson correlation test. Agreement was evaluated through a Bland-Altman plot and the measurement of the interclass correlation coeicient (ICC).(17) We also built a linear regression
between AGCAPL and SIG and obtained the R2 of the
prediction model. Two subgroup analyses were performed: one in patients with low base excess (BE <-2mEq/L - lBE group) and the other in patients with high base excess (BE >-2mEq/L - hBE group).
To evaluate the association between admission SIG levels and hospital mortality, we built one logistic regression using hospital mortality as the outcome. Variables associated with a p<0.25 by univariate analysis were included in the analysis.(18) A stepwise regression was
performed to identify variables that were independently associated with hospital mortality. he prediction capability of SIG for hospital mortality was also evaluated through the creation of an ROC curve and the calculation of the area under the curve.(19)
RESULTS
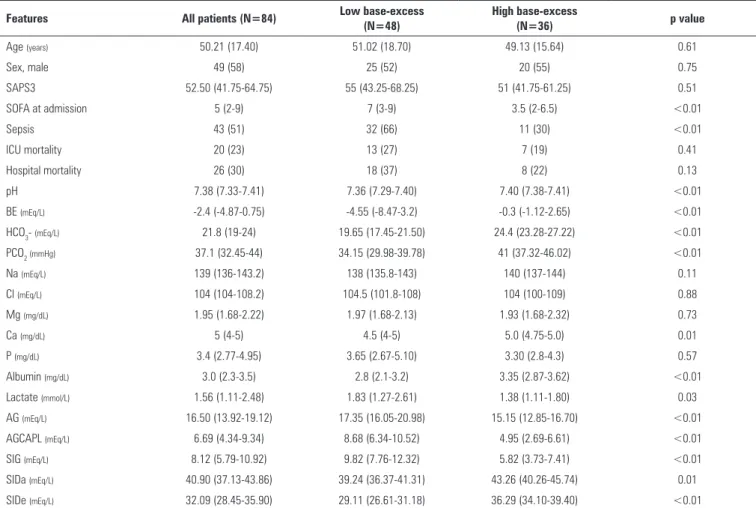
he general characteristics of the patients who were included in the study are shown in table 1. Demographic data were similar between patients with metabolic acidosis (lBE) and patients without metabolic acidosis (hBE) at ICU admission. lBE patients had higher illness severity, as evaluated by the total SOFA score (7 [3-9] versus 3.5 [2-6.5]; p<0.01), but similar SAPS3 levels (55 [43.2-68.2] versus 51 [41.7-61.2]; p=0.51). Admission due to sepsis was more common in the lBE than in the hBE group (66% versus 30%; p<0.01). ICU and hospital mortality was similar for both groups. Patients in the lBE group had lower values for pH, BE, bicarbonate, CO2, SIDa and albumin. he lBE group had higher levels of lactate, AG, AGCAPL and SIG.
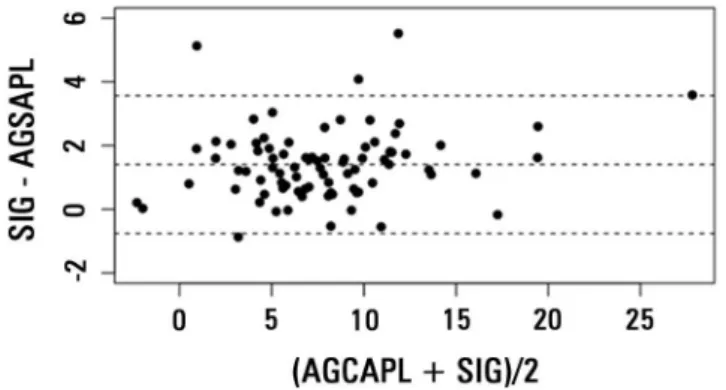
here was a very strong correlation between AGCAPL and SIG in the general population (r²=0.94; Figure 1), and the ICC was high (0.93; CI 0.89-0.95). he bias was 1.40, and the limits of agreement were -0.75 to
3.57, as shown in the Bland-Altman plot (Figure 2). he correlation was also high in the lBE group (r²=0.94; ICC = 0.91, CI 0.85-0.95; bias = 1.55, limits of agreement from -0.67 to 3.75) and in the hBE group (r²=0.92; ICC = 0.90, CI 0.82-0.95; bias = 1.22; limits of agreement from -0.85 to 3.3).
Uncorrected AG had a much weaker correlation with SIG in the general population (r²=0.66), lBE group (r²=0.58) and hBE group (r²=0.67). A mountain plot for the diference between uncorrected AG, AGCALP and SIG for each percentile of SIG is shown in igure 3. Values of SIDa, SIDe and SIG for the whole population, lBE group, hBE group and hBE group with high SIG are shown in a violin plot in igure 4.
High levels of SIG (above 6mEq/L)(7) were present in 56
patients (66% of the whole population). In the hBE group, 16 patients (42 %) had a SIG above 6mEq/L. he biochemical comparison between patients from the hBE group with high (>6mEq/L) and low SIG values is shown in table 2.
Table 1 - Clinical and laboratory features of studied patients
Features All patients (N=84) Low base-excess
(N=48)
High base-excess
(N=36) p value
Age (years) 50.21 (17.40) 51.02 (18.70) 49.13 (15.64) 0.61
Sex, male 49 (58) 25 (52) 20 (55) 0.75
SAPS3 52.50 (41.75-64.75) 55 (43.25-68.25) 51 (41.75-61.25) 0.51
SOFA at admission 5 (2-9) 7 (3-9) 3.5 (2-6.5) <0.01
Sepsis 43 (51) 32 (66) 11 (30) <0.01
ICU mortality 20 (23) 13 (27) 7 (19) 0.41
Hospital mortality 26 (30) 18 (37) 8 (22) 0.13
pH 7.38 (7.33-7.41) 7.36 (7.29-7.40) 7.40 (7.38-7.41) <0.01
BE (mEq/L) -2.4 (-4.87-0.75) -4.55 (-8.47-3.2) -0.3 (-1.12-2.65) <0.01
HCO3- (mEq/L) 21.8 (19-24) 19.65 (17.45-21.50) 24.4 (23.28-27.22) <0.01 PCO2 (mmHg) 37.1 (32.45-44) 34.15 (29.98-39.78) 41 (37.32-46.02) <0.01
Na (mEq/L) 139 (136-143.2) 138 (135.8-143) 140 (137-144) 0.11
Cl (mEq/L) 104 (104-108.2) 104.5 (101.8-108) 104 (100-109) 0.88
Mg (mg/dL) 1.95 (1.68-2.22) 1.97 (1.68-2.13) 1.93 (1.68-2.32) 0.73
Ca (mg/dL) 5 (4-5) 4.5 (4-5) 5.0 (4.75-5.0) 0.01
P (mg/dL) 3.4 (2.77-4.95) 3.65 (2.67-5.10) 3.30 (2.8-4.3) 0.57
Albumin (mg/dL) 3.0 (2.3-3.5) 2.8 (2.1-3.2) 3.35 (2.87-3.62) <0.01
Lactate (mmol/L) 1.56 (1.11-2.48) 1.83 (1.27-2.61) 1.38 (1.11-1.80) 0.03
AG (mEq/L) 16.50 (13.92-19.12) 17.35 (16.05-20.98) 15.15 (12.85-16.70) <0.01
AGCAPL (mEq/L) 6.69 (4.34-9.34) 8.68 (6.34-10.52) 4.95 (2.69-6.61) <0.01
SIG (mEq/L) 8.12 (5.79-10.92) 9.82 (7.76-12.32) 5.82 (3.73-7.41) <0.01
SIDa (mEq/L) 40.90 (37.13-43.86) 39.24 (36.37-41.31) 43.26 (40.26-45.74) 0.01
SIDe (mEq/L) 32.09 (28.45-35.90) 29.11 (26.61-31.18) 36.29 (34.10-39.40) <0.01
Table 2 - Laboratory comparison between patients with high (>6mEq/L) and normal strong ion gap (<6mEq/L) values in the hBE group
Low SIG (N=20) High SIG (N=16) p value
pH 7.39 (7.37-7.39) 7.40 (7.39-7.41) 0.70
PCO2(mmHg) 43.4 (40.00-46.70) 37.60 (35.88-42.50) 0.01
Na (mEq/L) 141 (137-144.8) 139 (137.5-142.2) 0.42 Cl (mEq/L) 106 (101.5-110.5) 103 (100-106.5) 0.17
Albumin (mg/dL) 3.5 (3.02-3.41) 3.1 (2.85-3.50) 0.09 Lactate (mmol/L) 1.38 (1.19-1.91) 1.33 (0.97-1.67) 0.35
SIG (mEq/L) 4.13 (2.75-5.20) 8.37 (6.85-10.02) <0.01
SIDa (mEq/L) 42.68 (38.83-45.74) 43.45 (42.38-45.79) 0.35 SIDe (mEq/L) 38.64 (34.75-40.97) 34.90 (33.00-37.21) 0.01
SIG - strong ion gap; SIDa - apparent strong ion difference; SIDe - effective strong ion difference. The results are expressed as the median (IQ) ± standard deviation.
Figure 1 - Plot of anion gap corrected for albumin, phosphate and lactate (AGCAPL) versus strong ion gap (SIG) for the general population.
Figure 2 - Bland-Altman plot of anion gap corrected for albumin, phosphate and lactate (AGCAPL) and strong ion gap (SIG). The central dashed line represents bias (mean of SIG - AGCAPL). The other two dashed lines represent 95% limits of agreement, equivalent to 1.96 x SD of the differences (SIG - AGCAPL), equivalent to -0.75 and 3.57.
Figure 3 - Mountain plot for the comparison between anion gap; anion gap (AG) corrected for albumin, phosphate and lactate (AGCAPL); and strong ion gap (SIG) values. Note that there is a narrow correlation between AGCAPL and SIG, but not between AG and SIG.
Figure 4 - Violin plot of SIDa, SIDe and strong ion gap for the general population, lBE group, hBE group and hBE patients with strong ion gap above 6mEq/L. White dots: median values; Black boxes: interquartiles; Black lines: ranges; gray shading: density of observed values. $ p=0.01 versus lBE group; * p<0.01 versus lBE group; † p<0.01 versus
hBE group. SIDa - apparent strong ion difference; SIDe - effective strong ion difference; SIG - strong ion gap; BE - base-excess.
he variables included in the mortality prediction model were total SOFA score, SAPS3 score, albumin levels, pH, BE, lactate levels, SIG and diagnosis of sepsis. After stepwise regression, only SAPS3 (OR 1.04; CI 95% 1.01-1.08 per point increase) and albumin levels (OR 0.19; CI 95% 0.07-0.49 per point increase) were associated with hospital mortality. SIG had a poor prediction capability for hospital mortality (AUC 0.61; CI 95% 0.47-0.74).
DISCUSSION
population and subgroups, as seen by the Pearson correlation and mountain plot results. We have also shown that unmeasured anions are frequently elevated in critically ill patients, even in patients with an apparently normal BE (42% of cases). Additionally, we have shown that SIG is not associated with hospital mortality by logistic regression.
he agreement between corrected anion gap and SIG has been shown in other studies. Moviat et al. have previously evaluated the correlation of albumin- and lactate-corrected anion gap with SIG in acidotic (BE <-5mEq/L) patients.(9) hey concluded that SIG and AG
were strongly correlated (r²=0.93), with a small bias,(9) but
the interclass coeicient correlation was not reported. We obtained values similar to those from Moviat et al.(9) for
the correlation between AG and AGCAPL, suggesting that the addition of the correction for phosphate levels does not improve the correlation between AG and SIG. However, taking agreement into consideration, the bias between SIG and the corrected anion gap was slightly lower in our analysis (1.86 versus 1.40), which may have occurred because phosphate levels were taken into account or due to a diference in samples. herefore, the only beneit of adding the correction for phosphate in the AG is a small reduction in the bias, which is most likely clinically irrelevant. Martin et al.(1) and Dubin et al.(12) also reported
an excellent correlation between albumin-corrected AG and SIG. Finally, Abdulraof Menesi et al. have shown that both the traditional and the physicochemical approaches are similar, even in speciic populations, such as patients with kidney graft.(10) Abdulraof Menesi et al. also
suggested that the correlation between AG and SIG could be reduced when AG levels were low.(10) In our analysis,
we also found a lower slope for the relationship between AGCAPL and SIG in patients with low AGCAPL (<10) compared to those with high AGCAPL (>10) (r=0.97 and r=1.07, respectively - data not shown). his inding was not the primary endpoint of our study and deservers further evaluation in larger samples.
he correct diagnosis of the metabolic disturbance is important for clinical management. High lactate levels are related to hypoperfusion, while hyperchloremia may be the result of aggressive resuscitation using chloride-rich solutions.(20-23) he latter consideration may be particularly
important because hyperchloremia has been suggested to be associated with mortality.(24) he association between
unmeasured anions and hypoperfusion, however, is less clear. It remains to be determined if SIG levels can be used as a marker of hypoperfusion or if it is appropriate to institute a speciic treatment (e.g., luid loading,
inotropes) when unmeasured anions are increased. Nevertheless, unmeasured anions are frequently elevated in critical illness, reportedly elevated in more than 90% of trauma patients when a low cutof is used,(1) and may be
associated with poor prognosis.(1,3,6) Patients may present
with “occult” metabolic acidosis, i.e., the higher levels of unmeasured anions may be masked by concomitantly reduced albumin levels.(5) In our analysis, 42% (16) of the
patients with normal BE had high levels of unmeasured anions. When those patients were compared with the remaining patients in the hBE group with low SIG (20 patients) (Table 2), they had a lower PCO2 and lower SIDe. herefore, the high SIG levels were compensated for by a reduction in SIDe that was mainly caused by decreased albumin (Table 2) and a reduction in PCO2, highlighting the complex acid-base behavior in critical illness.(25) AGCAPL still had an excellent correlation with
SIG in these patients (r²=0.95).
he impact of SIG on mortality is also debated, with some reports showing an association with mortality, while others found no association.(13-15,26) Durward et al. showed
that SIG was better than lactate as a predictor of mortality after cardiac surgery in children, although no model was built.(13) In trauma patients, Kaplan et al. reported that SIG
was a good predictor of mortality and was the strongest factor associated with mortality by logistic regression.(26)
On the other hand, Rocktaeschel et al.(15) found that,
despite being associated with mortality by multivariate analysis, SIG values had a poor prediction capability for mortality. Recently, Ratanarat et al. also suggested that SIG was higher in non-survivors, although no multivariate model was implemented to reduce confounding variables.
(27) In our analysis, SIG values were not associated with
in-hospital mortality after logistic regression. In fact, not even BE was associated with mortality in our analysis, contrary to previous research on the subject.(28) he
prediction capability of SIG for hospital mortality was also poor (AUC 0.61; 95% CI 0.47-0.74). his inding may be explained by the mix of clinical diagnosis at admission, particular sample features or both.
he best method for the interpretation of acid-base disorders at the bedside remains to be deined.(4) Dubin
et al. have shown that the physicochemical approach ofers no advantage over the traditional approach with corrected AG; in fact, the physicochemical approach allowed for an additional diagnosis of metabolic acidosis in only 1% of the cases.(12) Martin et al. have shown that
Kaplan et al. have suggested that a physicochemical approach can improve the accuracy of acid-base disturbances in trauma and, therefore, reduce inappropriate luid loading due to the suspicion of hypoperfusion-induced metabolic acidosis.(29) Boniatti et al. reported a series of 175
patients and evaluated the percentage of cases in which the physicochemical approach would supply diferent results when compared to the traditional approach.(30) he authors
concluded that the physicochemical approach would allow for an additional diagnosis of metabolic disorder (speciically, a decrease in SIDe) in over 33% of the cases. However, several caveats in the methods, such as the use of diferent thresholds for BE and SID and misinterpretations of the acid-base status, limit the validity of the data.(30,31) As Dubin
et al. have previously stated, both methods will most likely yield similar results if they are properly applied.(31) Although
this question has yet to be settled, our indings suggest that AGCAPL is a good surrogate for SIG measurements, with the advantage of being more easily calculated at the bedside.
Our study has several limitations. First, our small sample limits subgroup analysis and reduces external validity. Because this is a single-center study, the bias between SIG and AGCAPL relects the evaluated population. Despite including a signiicant range of diagnoses, these results cannot be generalized to other speciic populations in diferent
settings. Second, we did not evaluate the impact of any approach on clinical management. herefore, the impact of the measurement of unmeasured anions at the bedside should be explored in further studies. hird, we only evaluated ICU admission values. Consequently, the impact of acid-base status changes during ICU stay on prognosis was not possible.
CONCLUSION
Unmeasured anions are frequently elevated in critically ill patients. Because there is a strong correlation between anion gap corrected for albumin, phosphate and lactate and strong ion gap in patients with both normal and low base-excess, anion gap corrected for albumin, phosphate and lactate may be used as a surrogate for strong ion gap at the bedside. Strong ion gap values at admission are not associated with in-hospital mortality.
Authors’ contributions
FG Zampieri, LM Cruz Neto, HP Souza, FP Silva designed the study and conducted data collection. FG Zampieri, OT Ranzani, M Park and AT Maciel performed statistical analysis. FG Zampieri and M Park wrote the manuscript. All authors reviewed the manuscript in its inal form.
Objetivo: Ânion gap corrigido e íon gap forte são usados comumente para estimar os ânions não medidos. Avaliamos o
desempenho do ânion gap corrigido para albumina, fosfato e
lactato na predição do íon gap forte em uma população mista de pacientes enfermos graves. Formulamos a hipótese de que o ânion gap corrigido para albumina, fosfato e lactato seria um bom preditor do íon gap forte, independentemente da presença de acidose metabólica. Além disso, avaliamos o impacto do íon
gap forte por ocasião da admissão na mortalidade hospitalar.
Métodos: Incluímos 84 pacientes gravemente enfermos.
A correlação e a concordância entre o ânion gap corrigido
para albumina, fosfato e lactato e o íon gap forte foi avaliada utilizando-se os testes de correlação de Pearson, regressão linear, plot de Bland-Altman e pelo cálculo do coeiciente de correlação interclasse. Foram realizadas duas análises de subgrupos: uma para pacientes com excesso de base <-2mEq/L (grupo com baixo excesso de base) e outro grupo de pacientes com excesso de base >-2mEq/L (grupo com alto excesso de base). Foi realizada uma regressão logística para avaliar a associação entre os níveis de íon
gap forte na admissão e a mortalidade hospitalar.
Resultados: Houve correlação muito forte e uma boa concordância entre o ânion gap corrigido para albumina, fosfato e lactato e o íon gap forte na população geral (r²=0,94; bias 1,40; limites de concordância de -0,75 a 3,57). A correlação foi também elevada nos grupos com baixo excesso de base (r²=0,94) e alto excesso de base (r²=0,92). Estavam presentes níveis elevados de íon gap forte em 66% da população total e 42% dos casos do grupo alto excesso de. Íon gap forte não se associou com a mortalidade hospitalar, conforme avaliação pela regressão logística.
Conclusão: O ânion gap corrigido para albumina, fosfato e lactato e o íon gap forte tiveram uma excelente correlação. Os ânions não medidos estão frequentemente elevados em pacientes gravemente enfermos com excesso de base normal. Entretanto, não ocorreu associação entre os ânions não medidos e a mortalidade hospitalar.
RESUMO
REFERENCES
1. Martin M, Murray J, Berne T, Demetriades D, Belzberg H. Diagnosis of acid-base derangements and mortality prediction in the trauma intensive care unit: the physiochemical approach. J Trauma. 2005;58(2):238-43. Erratum in: J Trauma. 2005;59(4):1035.
2. Story DA, Kellum JA. New aspects of acid-base balance in intensive care. Curr Opin Anaesthesiol. 2004;17(2):119-23.
3. Gunnerson KJ, Saul M, He S, Kellum JA. Lactate versus non-lactate metabolic acidosis: a retrospective outcome evaluation of critically ill patients. Crit Care. 2006;10(1):R22.
4. Barbosa MB, Alves CA, Queiroz Filho H. Avaliação da acidose metabólica em pacientes graves: método de Stewart-Fencl-Figge versus a abordagem tradicional de henderson-hasselbalch. Rev Bras Ter Intensiva. 2006;18(4):380-4.
5. Noritomi DT, Soriano FG, Kellum JA, Cappi SB, Biselli PJ, Libório AB, et al. Metabolic acidosis in patients with severe sepsis and septic shock: a longitudinal quantitative study. Crit Care Med. 2009;37(10):2733-9. 6. Balasubramanyan N, Havens PL, Hoffman GM. Unmeasured anions
identified by the Fencl-Stewart method predict mortality better than base excess, anion gap, and lactate in patients in the pediatric intensive care unit. Crit Care Med. 1999;27(8):1577-81.
7. Kellum JA. Clinical review: reunification of acid-base physiology. Crit Care. 2005;9(5):500-7.
8. Kellum JA, Kramer DJ, Pinsky MR. Strong ion gap: a methodology for exploring unexplained anions. J Crit Care. 1995;10(2):51-5.
9. Moviat M, van Haren F, van der Hoeven H. Conventional or physicochemical approach in intensive care unit patients with metabolic acidosis. Crit Care. 2003;7(3):R41-5.
10. Abdulraof Menesi F, Verzola D, Villaggio B, Russo R, Sofia A, Fontana I, et al. Evaluation of metabolic acidosis in patients with a kidney graft: comparison of the bicarbonate-based and strong ion-based methods. Transplant Proc. 2011;43(4):1055-62.
11. Park M, Taniguchi LU, Noritomi DT, Libório AB, Maciel AT, Cruz-Neto LM. Clinical utility of standard base excess in the diagnosis and interpretation of metabolic acidosis in critically ill patients. Braz J Med Biol Res. 2008;41(3):241-9. Erratum in Braz J Med Biol Res. 2011;44(3):267. Braga, A L [corrected to Libório, A B].
12. Dubin A, Menises MM, Masevicius FD, Moseinco MC, Kutscherauer DO, Ventrice E, et al. Comparison of three different methods of evaluation of metabolic acid-base disorders. Crit Care Med. 2007;35(5):1264-70. 13. Durward A, Tibby SM, Skellett S, Austin C, Anderson D, Murdoch IA. The
strong ion gap predicts mortality in children following cardiopulmonary bypass surgery. Pediatr Crit Care Med. 2005;6(3):281-5.
14. Kaplan LJ, Kellum JA. Initial pH, base deficit, lactate, anion gap, strong ion difference, and strong ion gap predict outcome from major vascular injury. Crit Care Med. 2004;32(5):1120-4.
15. Rocktaeschel J, Morimatsu H, Uchino S, Bellomo R. Unmeasured anions in critically ill patients: can they predict mortality? Crit Care Med. 2003;31(8):2131-6.
16. Barbeiro DF, Barbeiro HV, Zampieri FG, César Machado MC, Torggler Filho F, Gomes Cunha DM, et al. Cathelicidin LL-37 bloodstream surveillance is down regulated during septic shock. Microbes Infect. 2013;15(5):342-6. 17. Lin LI. A concordance correlation coefficient to evaluate reproducibility.
Biometrics. 1989;45(1):255-68.
18. Hosmer DW, Lemeshow S. Applied logistic regression. 2nd ed. New York: John Wiley & Sons; 2000.
19. Heagerty PJ, Zheng Y. Survival model predictive accuracy and ROC curves. Biometrics. 2005;61(1):92-105.
20. Mecher C, Rackow EC, Astiz ME, Weil MH. Unaccounted for anion in metabolic acidosis during severe sepsis in humans. Crit Care Med. 1991;19(5):705-11.
21. Yunos NM, Bellomo R, Story D, Kellum J. Bench-to-bedside review: Chloride in critical illness. Crit Care. 2010;14(4):226.
22. Park M, Calabrich A, Maciel AT, Zampieri FG, Taniguchi LU, Souza CE, et al. Caracterização físico-química da acidose metabólica induzida pela expansão volêmica inicial com solução salina a 0,9 por cento em pacientes com sepse grave e choque séptico. Rev Bras Ter Intensiva. 2011;23(2):176-82.
23. Boniatti MM, Filho EM, Cardoso PR, Vieira SR. Physicochemical evaluation of Acid-base disorders after liver transplantation and the contribution from administered fluids. Transplant Proc. 2013;45(6):2283-7.
24. Boniatti MM, Cardoso PR, Castilho RK, Vieira SR. Is hyperchloremia associated with mortality in critically ill patients? A prospective cohort study. J Crit Care. 2011;26(2):175-9.
25. Park M, Noritomi DT, Toledo-Maciel A, Azevedo LC, Pizzo VR, Cruz-Neto LM. Partitioning evolutive standard base excess determinants in septic shock patients. Rev Bras Ter Intensiva. 2007;19(4):437-43.
26. Kaplan LJ, Kellum JA. Comparison of acid-base models for prediction of hospital mortality after trauma. Shock. 2008;29(6):662-6.
27. Ratanarat R, Sodapak C, Poompichet A, Toomthong P. Use of different approaches of acid-base derangement to predict mortality in critically ill patients. J Med Assoc Thai. 2013;96 Suppl 2:S216-23.
28. Noritomi DT, Sanga RR, Amaral AC, Park M. Metabolic acid-base status in critically ill patients: is standard base excess correlated with serum lactate level? Rev Bras Ter Intensiva. 2006;18(1):22-6.
29. Kaplan LJ, Cheung NH, Maerz L, Lui F, Schuster K, Luckianow G, et al. A physicochemical approach to acid-base balance in critically ill trauma patients minimizes errors and reduces inappropriate plasma volume expansion. J Trauma. 2009;66(4):1045-51.
30. Boniatti MM, Cardoso PR, Castilho RK, Vieira SR. Acid-base disorders evaluation in critically ill patients: we can improve our diagnostic ability. Intensive Care Med. 2009;35(8):1377-82.