Urinary electrolyte monitoring in critically ill
patients: a preliminary observational study
Monitorização de eletrólitos urinários em pacientes críticos:
estudo preliminar observacional
INTRODUCTION
Managing acid-base disturbances in critically ill patients is an important part of treatment. he physicochemical approach proposed by Stewart(1) and modiied by Figge(2) has recently gained recognition as a useful tool for the interpretation of complex acid-base imbalances. In this approach, two variables in addition to PaCO2 are considered determinants of H+ concentration and, hence, pH. hese two variables are the strong ion diference (SID) and the Alexandre Toledo Maciel1, Marcelo Park1, Etienne
Macedo2
1. Intensive Care Unit, Department of Medical Emergencies, Hospital das Clínicas, Universidade de São Paulo - USP - São Paulo (SP), Brazil. 2. Department of Nephrology, Hospital das Clínicas, Universidade de São Paulo - USP - São Paulo (SP), Brazil.
ABSTRACT
Objective: Intensive care unit
survivors and non-survivors have distinct acid-base proiles. he kidney’s regulation of urinary electrolytes and the urinary strong ion diference plays a major role in acid-base homeostasis. he aim of this study was to evaluate the potential utility of daily spot urinary electrolyte measurement in acid-base and renal function monitoring.
Methods: We prospectively
recorded daily plasma acid-base parameters and traditional markers of renal function in parallel with spot urinary electrolyte measurements in patients with urinary catheters admitted to ourintensive care unit. Patients who remained in the intensive care unit for at least 4 days with a urinary catheter were included in the study.
Results: Of the 50 patients
included in the study, 22% died during their intensive care unit stay. he incidence of acute kidney injury was signiicantly higher in non-survivors during the 4-day observation period (64% vs. 18% in survivors).
Urinary chloride and sodium were lower and urinary strong ion diference was higher on day 1 in patients who developed acute kidney injury among both survivors and non-survivors. Both groups had similar urine output, although non-survivors had persistently higher urinary strong ion diference on all days. Survivors had a progressive improvement in metabolic acid-base proile due to increases in the plasma strong ion diference and decreases in weak acids. hese changes were concomitant with decreases in urinary strong ion diference. In non-survivors, acid-base parameters did not signiicantly change during follow-up. Conclusions: Daily assessment of spot urinary electrolytes and strong ion diference are useful components of acid-base and renal function evaluations in critically ill patients, having distinct proiles between intensive care unit survivors and non-survivors.
Keywords: Critical care; Acidosis; Water-electrolyte imbalance; Acute kidney injury; Monitoring, physiologic; Prognosis
This study was conducted at the medical intensive care unit, Hospital das Clínicas, Universidade de São Paulo - USP - São Paulo (SP), Brazil.
Conflicts of interest: None.
Submitted on March 22, 2012 Accepted on July 17, 2012
Corresponding author:
Alexandre Toledo Maciel
Disciplina de Emergências Clínicas do Instituto Central do Hospital das Clínicas
Avenida Dr. Enéas de Carvalho Aguiar, 255, sala 5.023 - Cerqueira César
total amount of non-volatile weak acids. SID is the diference between completely dissociated cations (Na+, K+, Ca2+, Mg2+) and anions (Cl-, lactate-) normally present in physiological solutions. Under normal conditions, the total amount of non-volatile weak acids is the sum of albumin and phosphate, both of which are only partially dissociated at a pH compatible with human life.
Extracellular SID variation appears to be the major determinant of the metabolic acid-base state in critically ill patients.(3) Decreases in SID induce water dissociation and increase concentrations of free protons (hence decreasing pH) to maintain electroneutrality. Increases in SID induce increases in pH for the opposite reason. he kidneys play a major role in acid-base homeostasis. From a physicochemical point of view, this is due in great part to changes in urinary SID (SIDu). In normal physiology, both plasma and urinary SID values are the same (approximately 42 mEq/L),(3) and in urine, SID = [Na+] + [K+] - [Cl-]. Under normal conditions, the kidneys respond to decreases in plasma SID by increasing
ammonium (NH4+) excretion, the main mechanism
of increasing urinary acid load.(4-6) To counterbalance NH4+ excretion and maintain electroneutrality, urinary excretion of Cl- increases in relation to Na+ and K+, decreasing the SIDu.
Although there are still many concerns about the SID approach,(7) especially in a mechanistic sense, it has gained popularity in critical care settings in recent years.(8) However, its use has been generally restricted to plasma SID, and few studies have focused on SIDu
and the relevant information it may provide.(9-11)
Urinary electrolyte measurements are usually utilized in the intensive care unit (ICU) for the differential diagnosis of natremia disorders, the diagnosis of pre-renal versus acute tubular necrosis, and determining the etiology of hyperchloremic metabolic acidosis. However, these urinary markers still need to be adequately studied and validated in the critical care setting. Critically ill patients frequently receive large volumes of low SID solutions (e.g., normal saline) in addition to endogenous production of sulfates, phosphates, lactate, and ketoacids, as well as other components that increase the acid load and decrease plasma SID. Using a Stewart acid-base approach, normal kidneys are expected to produce urine with a low SIDu to maintain a stable plasma SID. In contrast, injured kidneys are expected to not respond with adequate ammonium excretion but instead produce urine with a higher SID, contributing to the generation of metabolic acidosis.
In a previous study,(12) we showed that ICU survivors showed progressive adjustment in their metabolic acid-base proile, in contrast to ICU non-survivors. he aim of the present study was to evaluate daily urinary electrolytes and SIDu in ICU survivors and non-survivors, in parallel with other parameters routinely assessed, to evaluate acid-base status and kidney function. In this preliminary study, our aim was to describe possible diferences between ICU survivors and non-survivors in urinary biochemistry in the irst 4 ICU days. Our hypothesis is that urinary electrolyte monitoring would be helpful in distinguishing patients that will develop AKI in the irst 4 ICU days and have a poor ICU outcome.
METHODS
who were readmitted to the ICU or transferred to another ICU were also excluded. Urinary catheter insertion and removal was at the discretion of the assistant physician and not inluenced by the ongoing study.
Patient demographics, associated comorbidities, severity scores (Simplified Acute Physiology Score 3 - SAPS 3(13) and Sequential Organ Failure Assessment- SOFA(14)), 24-h urine output, fluid balance, use of vasopressors, bicarbonate, diuretics, the need for mechanical ventilation during the 4-day study period and dialysis after the 4 days of observation were all recorded.
Acute kidney injury diagnosis
Acute kidney injury (AKI) was deined using AKIN(15) criteria (creatinine only) during the 4-day observation period. he lowest creatinine in the previous 48 hours before admission was considered the baseline renal function. For patients without a creatinine measurement in the previous 48 hours, the value on admission was considered the baseline renal function. For the purposes of this study, patients were classiied as having AKI if they met any stage of AKIN creatinine criteria during the 4 days of observation.
Laboratory techniques and measurements
All samples were analyzed in the central laboratory of the institution. Serum Na+, K+, Ca2+ and Cl- concentrations were measured using the direct ion-selective electrode
technique. Mg2+ was measured using a colorimetric
technique, and phosphate was measured using an ultraviolet technique. BUN was measured with a kinetic technique, and albumin was measured with a bromocresol dye colorimetric technique. NaU, KU, and ClU were also measured using the direct ion-selective electrode technique, while creatinine was measured in both serum and urine using a kinetic colorimetric technique. Arterial blood gases were analyzed, and lactate was measured on the OMNI analyzer (Roche Diagnostics System, F. Hofmann-La Roche Ltd., Basel, Switzerland). Values for SBE, SIDa, SIDe, SIG and FENa were calculated using standard formulas: SBE (Van Slyke equation) (mEq/L)
= 0.9287 × (HCO3- (mmol/L) - 24.4 + 14.83 × [pH -
7.4]); SIDa (mEq/L) = Na+ (mEq/L) + K+ (mEq/L) +
Ca2+ (mEq/L) + Mg2+ (mEq/L) - [Cl- (mEq/L) + lactate-
(mEq/L)]; SIDe (mEq/L) = 2.46 × 10⁻⁸ × PCO
2/10 -pH +
[albumin (g/L) × (0.123 × pH – 0.631)] + [(phosphate (mg/dL)/3) × (0.309 × pH – 0.469)]; SIG (mEq/L) = SIDa – SIDe; FENa (%) = [(NaU(mEq/L) / Na+ (mEq/L)) / (CrU (mg/dL) / creatinine (mg/dL))] x 100.
Statistical analysis
Quantitative data were tested for normality using the Kolmogorov-Smirnov goodness-of-it model. Parametric data are shown as the means ± standard deviations and were analyzed using Student’s t-test for non-paired variables. Non-parametric variables are presented as the medians with the 25th and 75th percentiles and were analyzed using the Mann-Whitney rank sum test. A modiied Bonferroni correction for multiple comparisons was used to compare variables between survivors and non-survivors during the 4 days of the study, and the P value used for signiicance in the day-by-day comparisons was 0.0125. Friedman’s test was used to analyze the data within the survivor and non-survivor groups during the 4 days analyzed. hese data sets were also compared using a Bonferroni correction, resulting in a signiicance level for Friedman’s test of 0.0125. Post-hoc analyses were performed with Dunnett’s test using a signiicance level of 0.05. he graphs of non-parametric data are presented with
box-and-whisker plots (the whiskers represent the 10th
and 90th percentiles). Qualitative data are shown as occurrences and percentages and were analyzed with the chi-squared or Fisher exact tests, as appropriate. Spearman’s rank correlation test was used to determine correlations between non-parametric variables. he SPSS 18.0 commercial Statistical Package for the Social Science (Chicago, IL) was used for the analyses.
RESULTS
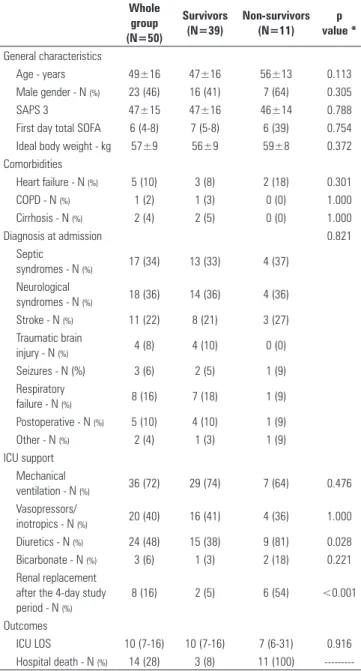
From 235 patients admitted to our ICU from October 2009 to November 2010, 50 patients met the inclusion criteria and were included in the analysis (Figure 1). he main characteristics of the patients are shown in table 1. Eleven patients (22%) died in the ICU. ICU survivors and non-survivors did not difer in age, sex, diagnosis or SAPS 3 score at the time of admission to the ICU. Likewise, there was no diference between the two groups in the percentage of patients who needed mechanical ventilation, vasopressors or bicarbonate during the observation period. A higher percentage of non-survivors received diuretics during the observation period, and more non-survivors had renal replacement therapy after the observation period.
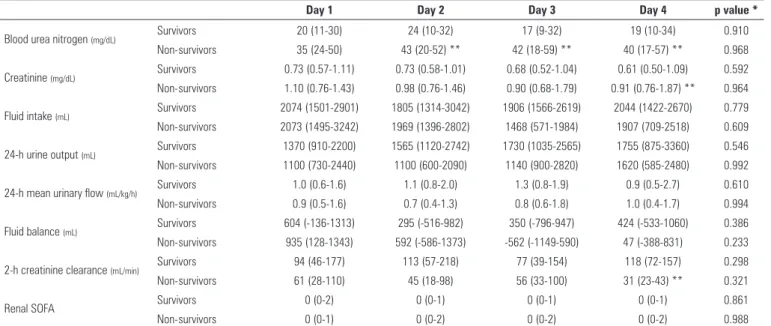
2-h creatinine clearance was significantly lower in non-survivors only at day 4. During the entire observation period, 24-h urine output, 24-h mean urinary flow, fluid intake and fluid balance were similar between groups. A significantly higher proportion of patients developed AKI in the non-survivor group (7 out of 11 patients in the non-survivor group (64%) compared to 7 out of 39 patients in the survivor group (18%) (p < 0.01)).
ClU and NaU on day 1 were signiicantly lower in patients who developed AKI during the observation period, both in survivors and non-survivors (Figure 2A). Although the median ClU and NaU were lower in non-survivors in comparison to non-survivors on day 1 (Figures 2B and 2C), this was restricted to patients who developed AKI during the 4 days of observation (Figure 2A). In the majority of the patients who developed AKI during the 4 days of observation, FENa was lower than 1% in both survivors and non-survivors (Figure 3). SIDu on day 1 was higher in patients who developed AKI during the 4 days of observation in both survivors and non-survivors (Figure 4).
Figure 5 compares SIDu and SIDa patterns. In survivors, SIDu was similar to SIDa at day 1 and signiicantly decreased by day 2. In non-survivors, SIDu stayed above SIDa during the entire observation
Figure 1 - Flow chart of patients included in the analysis. ICU - intensive care unit.
Table 1 - Patient characteristics and outcomes
Whole group (N=50)
Survivors (N=39)
Non-survivors (N=11)
p value *
General characteristics
Age - years 49±16 47±16 56±13 0.113
Male gender - N (%) 23 (46) 16 (41) 7 (64) 0.305
SAPS 3 47±15 47±16 46±14 0.788
First day total SOFA 6 (4-8) 7 (5-8) 6 (39) 0.754
Ideal body weight - kg 57±9 56±9 59±8 0.372
Comorbidities
Heart failure - N (%) 5 (10) 3 (8) 2 (18) 0.301
COPD - N (%) 1 (2) 1 (3) 0 (0) 1.000
Cirrhosis - N (%) 2 (4) 2 (5) 0 (0) 1.000
Diagnosis at admission 0.821
Septic
syndromes - N (%) 17 (34) 13 (33) 4 (37)
Neurological
syndromes - N (%) 18 (36) 14 (36) 4 (36)
Stroke - N (%) 11 (22) 8 (21) 3 (27)
Traumatic brain
injury - N (%) 4 (8) 4 (10) 0 (0)
Seizures - N (%) 3 (6) 2 (5) 1 (9)
Respiratory
failure - N (%) 8 (16) 7 (18) 1 (9)
Postoperative - N (%) 5 (10) 4 (10) 1 (9)
Other - N (%) 2 (4) 1 (3) 1 (9)
ICU support Mechanical
ventilation - N (%) 36 (72) 29 (74) 7 (64) 0.476
Vasopressors/
inotropics - N (%) 20 (40) 16 (41) 4 (36) 1.000
Diuretics - N (%) 24 (48) 15 (38) 9 (81) 0.028
Bicarbonate - N (%) 3 (6) 1 (3) 2 (18) 0.221
Renal replacement after the 4-day study period - N (%)
8 (16) 2 (5) 6 (54) <0.001
Outcomes
ICU LOS 10 (7-16) 10 (7-16) 7 (6-31) 0.916
Hospital death - N (%) 14 (28) 3 (8) 11 (100)
---SAPS - Simplified Acute Physiology Score; SOFA - Sequential Organ Failure Assessment Score; COPD - chronic obstructive pulmonary disease; ICU - intensive care unit; LOS - length of stay. Septic syndromes denote severe sepsis and septic shock. * p value of the comparison between survivors and non-survivors.
period. ClU and NaU tended to be higher in survivors than in non-survivors on all days (Figures 2B and 2C). By contrast, KU tended to be greater in non-survivors (Figure 2D). In survivors, NaU was signiicantly greater on days 3 and 4 than on day 1. Twenty-four-hour mean urinary low was positively correlated with ClU and NaU (r=0.330, p < 0.001 and r=0.344, p < 0.001, respectively), and creatinine was negatively correlated with ClU and NaU (r= -0.517, p < 0.001 and r= -0.438, p < 0.001, respectively). A signiicant negative correlation was found between KU and 24-h mean urinary low
235 ICU admissions October 2009 - November 2010
119 had urinary catheter
for at least the irst two
days after ICU admission
55 with at least the irst 4 days in the ICU with a urinary
catheter and no dialysis in this period
50 included in the analysis
2 chronic renal failure 1 transplant kidney 2 transferred to another ICU
44 patients discharged or with less than 4 days of
urinary catheter
4 died within 4 days of ICU 16 dialysis in the irst 4 days
Table 2 - Renal characteristics of patients, categorized according to intensive care unit survival
Day 1 Day 2 Day 3 Day 4 p value *
Blood urea nitrogen (mg/dL) Survivors 20 (11-30) 24 (10-32) 17 (9-32) 19 (10-34) 0.910
Non-survivors 35 (24-50) 43 (20-52) ** 42 (18-59) ** 40 (17-57) ** 0.968
Creatinine (mg/dL) Survivors 0.73 (0.57-1.11) 0.73 (0.58-1.01) 0.68 (0.52-1.04) 0.61 (0.50-1.09) 0.592
Non-survivors 1.10 (0.76-1.43) 0.98 (0.76-1.46) 0.90 (0.68-1.79) 0.91 (0.76-1.87) ** 0.964
Fluid intake (mL) Survivors 2074 (1501-2901) 1805 (1314-3042) 1906 (1566-2619) 2044 (1422-2670) 0.779
Non-survivors 2073 (1495-3242) 1969 (1396-2802) 1468 (571-1984) 1907 (709-2518) 0.609
24-h urine output (mL) Survivors 1370 (910-2200) 1565 (1120-2742) 1730 (1035-2565) 1755 (875-3360) 0.546
Non-survivors 1100 (730-2440) 1100 (600-2090) 1140 (900-2820) 1620 (585-2480) 0.992
24-h mean urinary flow (mL/kg/h) Survivors 1.0 (0.6-1.6) 1.1 (0.8-2.0) 1.3 (0.8-1.9) 0.9 (0.5-2.7) 0.610
Non-survivors 0.9 (0.5-1.6) 0.7 (0.4-1.3) 0.8 (0.6-1.8) 1.0 (0.4-1.7) 0.994
Fluid balance (mL) Survivors 604 (-136-1313) 295 (-516-982) 350 (-796-947) 424 (-533-1060) 0.386
Non-survivors 935 (128-1343) 592 (-586-1373) -562 (-1149-590) 47 (-388-831) 0.233
2-h creatinine clearance (mL/min) Survivors 94 (46-177) 113 (57-218) 77 (39-154) 118 (72-157) 0.298
Non-survivors 61 (28-110) 45 (18-98) 56 (33-100) 31 (23-43) ** 0.321
Renal SOFA Survivors 0 (0-2) 0 (0-1) 0 (0-1) 0 (0-1) 0.861
Non-survivors 0 (0-1) 0 (0-2) 0 (0-2) 0 (0-2) 0.988
SOFA - Sequential Organ Failure Assessment Score. * Friedman’s test over time.** p<0.0125 vs. survivor group, Mann-Whitney rank sum test with Bonferroni’s correction for multiple comparisons.
Figure 2 - A) Urinary electrolytes on day 1 in patients who did or did not develop acute kidney injury during the 4-day observation period in survivors and non-survivors.
(r= -0.237, p < 0.01), but there was no correlation between KU and creatinine (r= 0.059, p=0.412).
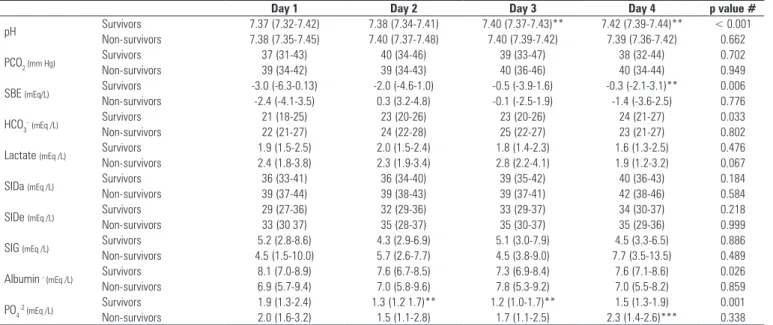
In table 3, traditional and physicochemical blood acid-base variables are compared between ICU survivors and non-survivors during the irst 4 ICU days. Over this time, survivors had a signiicant increase in pH and SBE, which was associated with non-signiicant increases in SIDa and SIDe and decreases in weak acids (albumin and phosphate). Neither lactate nor SIG was diferent between or within groups. Both Na+ and Cl-, the main determinants of SID, showed a progressively increasing trend in both groups. Phosphate was signiicantly greater in non-survivors compared to survivors on day 4.
Figure 4 - Urinary strong ion difference on day 1 in patients who did or did not develop acute kidney injury during the 4-day observation period in both survivors and non-survivors. SIDu - urinary strong ion difference; AKI - acute kidney injury; ICU - intensive care unit. Difference between survivors with AKI and without AKI: * p = 0.002. Difference between non-survivors with AKI and without AKI: ** p = 0.05.
Figure 3 - Fractional excretion of sodium in patients who did or did not develop acute kidney injury during the 4-day observation period in both survivors and non-survivors. FENa - fractional excretion of sodium; AKI - acute kidney injury; ICU - intensive care unit.
Figure 5 - Strong ion difference in plasma (SIDa) and urine (SIDu) during the 4 day observation period in both survivors and non-survivors. Difference among the days in survivors: SIDa (P = 0.184) and SIDu (P = 0.062). Difference among the days in non-survivors: SIDa (P = 0.584) and SIDu (P = 0.923). On day 2, the difference between SIDa and SIDu in survivors (* P < 0.0125). On day 2, the difference between SIDu of survivors and non-survivors (# P < 0.0125).
Table 3 - Blood physicochemical characteristics of patients, categorized according to intensive care unit survival
Day 1 Day 2 Day 3 Day 4 p value #
pH Survivors 7.37 (7.32-7.42) 7.38 (7.34-7.41) 7.40 (7.37-7.43)** 7.42 (7.39-7.44)** < 0.001
Non-survivors 7.38 (7.35-7.45) 7.40 (7.37-7.48) 7.40 (7.39-7.42) 7.39 (7.36-7.42) 0.662
PCO2 (mm Hg) Survivors 37 (31-43) 40 (34-46) 39 (33-47) 38 (32-44) 0.702
Non-survivors 39 (34-42) 39 (34-43) 40 (36-46) 40 (34-44) 0.949
SBE (mEq/L) Survivors -3.0 (-6.3-0.13) -2.0 (-4.6-1.0) -0.5 (-3.9-1.6) -0.3 (-2.1-3.1)** 0.006
Non-survivors -2.4 (-4.1-3.5) 0.3 (3.2-4.8) -0.1 (-2.5-1.9) -1.4 (-3.6-2.5) 0.776
HCO3
-(mEq /L) Survivors 21 (18-25) 23 (20-26) 23 (20-26) 24 (21-27) 0.033
Non-survivors 22 (21-27) 24 (22-28) 25 (22-27) 23 (21-27) 0.802
Lactate (mEq /L) Survivors 1.9 (1.5-2.5) 2.0 (1.5-2.4) 1.8 (1.4-2.3) 1.6 (1.3-2.5) 0.476
Non-survivors 2.4 (1.8-3.8) 2.3 (1.9-3.4) 2.8 (2.2-4.1) 1.9 (1.2-3.2) 0.067
SIDa (mEq /L) Survivors 36 (33-41) 36 (34-40) 39 (35-42) 40 (36-43) 0.184
Non-survivors 39 (37-44) 39 (38-43) 39 (37-41) 42 (38-46) 0.584
SIDe (mEq /L) Survivors 29 (27-36) 32 (29-36) 33 (29-37) 34 (30-37) 0.218
Non-survivors 33 (30 37) 35 (28-37) 35 (30-37) 35 (29-36) 0.999
SIG (mEq /L) Survivors 5.2 (2.8-8.6) 4.3 (2.9-6.9) 5.1 (3.0-7.9) 4.5 (3.3-6.5) 0.886
Non-survivors 4.5 (1.5-10.0) 5.7 (2.6-7.7) 4.5 (3.8-9.0) 7.7 (3.5-13.5) 0.489
Albumin - (mEq /L) Survivors 8.1 (7.0-8.9) 7.6 (6.7-8.5) 7.3 (6.9-8.4) 7.6 (7.1-8.6) 0.026
Non-survivors 6.9 (5.7-9.4) 7.0 (5.8-9.6) 7.8 (5.3-9.2) 7.0 (5.5-8.2) 0.859
PO4-2 (mEq /L) Survivors 1.9 (1.3-2.4) 1.3 (1.2 1.7)** 1.2 (1.0-1.7)** 1.5 (1.3-1.9) 0.001
Non-survivors 2.0 (1.6-3.2) 1.5 (1.1-2.8) 1.7 (1.1-2.5) 2.3 (1.4-2.6)*** 0.338
PCO2 - partial pressure of carbon dioxide; SBE - standard base excess; HCO3 - bicarbonate; SIDa - apparent strong ion difference; SIDe - effective strong ion difference; SIG - strong ion gap; PO4-2 - phosphate.* Friedman’s test over time. ** p< 0.05 vs. day 1, Dunnett’s post-hoc analysis. *** p < 0.0125 vs. survivor group, Mann-Whitney rank sum test with Bonferroni’s correction
pressure explains, in large part, the urinary biochemistry indings in AKI, even with increased total renal blood low, as occurs in hyperdynamic sepsis.(18) A recent review also focused on glomerular hemodynamics as having a central role in the pathogenesis of AKI,(19) which is consistent with the supposition that kidney injuries in critically ill patients, especially septic patients, are more functional
than structural.(20) herefore, NaU and ClU seem to
monitor glomerular function, and SIDu may be viewed as an indicator of tubular acidifying capacity, signaling an early urinary acidiication dysfunction in AKI.
SIDu as a surrogate of kidney function, in the presence of metabolic acidosis, has recently been evaluated.(9,11) Masevicius et al.(11) reported that most of the critically ill patients with metabolic acidosis showed inappropriate renal compensation because a minority of them presented a negative SIDu. However, we believe that decreases in SIDu below the level of plasma SID (i.e., still positive values of SIDu), as occurred in most of the survivors in our study (Figure 5), is an appropriate renal response because the majority of survivors did not meet the AKIN creatinine criteria for AKI. In agreement with their results, we found negative SIDu to be quite rare in non-survivors (Figures 4 and 5), a inding that is most likely related to the high prevalence of AKI in this group. We did not separate the patients with and without pure metabolic acidosis, which could also explain, at least in part, the diferences between our results and theirs. Moviat et al.(9) also proposed that impaired renal function is associated with a higher SIDu in patients with metabolic acidosis. heir indings were limited by a single measurement of a simpliied SIDu (NaU - ClU) per patient and a simple deinition of impaired renal function, as they used an isolated creatinine measurement. Our study reinforces the notion that simple urinary biochemistry can be used from the irst day of ICU admission to help monitor kidney function and has a potential role in predicting AKI development.
Although diuretic use directly afects urinary electrolyte composition, increasing spot NaU in both transient and persistent AKI,(21) we did not exclude patients who used diuretics during the observation period. he main reason for this was that diuretics are frequently used in the management of critically ill patients. A greater proportion of patients used diuretics in the non-survivor group, a inding that must be interpreted carefully. First, no causal relationship could be identiied between diuretic use and increased mortality. Our opinion is that diuretics could partially explain the similar urine output between survivors and non-survivors. Regarding the interpretation of urinary
DISCUSSION
In this preliminary study, we described the urinary biochemistry proile of a small group of critically ill patients in parallel to other parameters frequently used for acid-base and renal function evaluation. In our cohort, the incidence of AKI using the AKIN creatinine criterion was signiicantly higher in non-survivors during the observation period (64% vs. 18% in survivors). his diference became evident on day 4 (Table 2) and was associated with a higher percentage of non-survivors requiring renal replacement therapy after 4 days of observation (Table 1). Figures 2 and 4 suggest that low levels of NaU and ClU and a high (above-normal) level of SIDu on day 1 were frequently present in patients who had AKI in the irst 4 days in the ICU. Although the median renal SOFA was 0 in both groups during the 4-day observation period, the low levels of ClU and NaU (Figures 2B and 2C), high levels of KU (Figure 2D) and SIDu (Figure 5), and the increased BUN, increased phosphate and lower creatinine clearance demonstrate that the majority of non-survivors had some degree of renal dysfunction from the start of the study, even in the face of normal creatinine. A recent study by Beier et al.(16) also demonstrated that higher BUN may be a strong predictor of mortality in critically ill patients, independent of normal creatinine.
One of the classic clinical uses of urinary biochemistry is to diferentiate a reversible renal dysfunction (“pre-renal”) from acute tubular necrosis (ATN). he potential use of urinary electrolytes as a parameter to guide luid resuscitation to reverse AKI has been recently reviewed.(17) Although we did not intend to determine reversibility by evaluating urinary electrolytes, the urinary electrolyte data of our study could relect decreased glomerular perfusion pressure, the main mechanism associated with decreased urinary sodium and chloride excretion. In our patients with evidence of a decreased glomerular iltration rate, the low NaU and ClU also suggest a preserved tubular capacity to reabsorb sodium and chloride. Despite the use of diuretics in our cohort, we found a low FENa (<1%) (Figure 3) and a low fractional excretion of urea (FEUr <35%) (data not shown) in patients with AKI, among both survivors and in non-survivors. he lower NaU and higher KU in non-survivors (Figure 2) may have been due, in part, to an enhanced exchange of Na+ and K+ in the distal tubule, indicating an adequate tubular response and exacerbated activation of the renin-aldosterone system.
electrolytes, we believe that, given the similar urine output between the two groups, the low levels of NaU and ClU in non-survivors may be viewed as an impairment to natriuresis and chloriuresis, which was not adequately solved even with greater diuretic administration. Loop diuretics increase urinary acidiication by enhancing NH4+ and Cl- excretion in relation to Na+ and K+.(22) Hence, higher SIDu and lower NaU and ClU, as found in non-survivors, could not be attributed to more frequent use of diuretics, whereas these indings are compatible with a greater prevalence of AKI in non-survivors.
As previously shown,(12,23) ICU survivors had a
progressive improvement in pH, mostly due to the correction of metabolic acidosis. his improvement, with daily increases in SBE, relected a combination of small increases in plasma SID and decreases in weak acids (albumin and phosphate) (Table 3). Decreases in SIDu (Figure 5) correspond to the kidney’s contribution to metabolic acidosis correction. Low SIDu values relect the kidney’s ability to excrete NH4+, the main mechanism for increasing acid excretion after an acid load.(24) hus, in kidneys with preserved function, a lower SIDu implies an increased excretion of NH4+.
Taking into account all data regarding urine biochemistry, it seems that major diferences between survivors and non-survivors were associated with an increased AKI prevalence in the latter group. Hence, AKI can be viewed as an inability to address acid-base metabolic disturbances, which may be detected before major increases in creatinine or decreases in urine output.
he higher SIDu observed in non-survivors could also be explained by increased levels of unmeasured anions in their urine, even with appropriate urinary NH4+ levels. However, this hypothesis is weakened because serum unmeasured anion concentrations, as assessed by SIG, were similar between survivors and non-survivors (Table 3). he diagnosis of renal tubular acidosis (RTA) is diicult to exclude using the data available from our study. Although RTA is classiied into distinct types, they are all characterized by hyperchloremic acidosis and high urinary SID.(10) Many chemicals, including antibiotics frequently used in the ICU, may contribute to some type of RTA. Considering that glomerular iltration is usually not impaired in RTA, it was unlikely to be a major cause of the high SIDu in non-survivors.
here are some weaknesses of our study that deserve mention. First, the small sample size likely prevented some real diferences from becoming evident, especially because urine electrolytes have a large range of physiological concentrations. Diuretic use is also
a confounding factor that we could not adjust for; however, as discussed above, in the absence of diuretics, the diferences would most likely have been even greater between survivors and non-survivors. In addition, our work did not intend to explore a more detailed explanation for the persistently high SIDu in non-survivors, which would require parallel measurements
of urine pH, direct urinary NH4+ measurement, and
other investigations. Unfortunately, we did not obtain data from the period before ICU admission to compare the amounts of luid received by survivors and non-survivors. We do not think that the diferences in urine biochemistry were due to higher amounts of sodium and chloride received during resuscitation in survivors prior to ICU admission. Our results cannot exclude this possibility, however. During their ICU stay, luid intake and luid balance were similar between the two groups.
It is important to emphasize that our results were obtained in a selected population of critically ill patients. Very sick patients who died or needed renal replacement therapy before day 4 of their ICU stay, patients with a low risk of death or AKI that were discharged early from the ICU and patients who were managed without a urinary catheter are not represented in our study (Figure 1). his may be interpreted as a selection bias and may explain the similarity in many variables between survivors and non-survivors, such as SAPS 3, vasopressor use and mechanical ventilation. However, this similarity helps to demonstrate that in our sample, urinary biochemistry monitoring was useful in distinguishing patients who otherwise would be considered to have similar renal function and prognosis based solely on classical variables such as urine output, serum creatinine (Table 2), and severity scores (SAPS 3 and SOFA) (Table 1).
CONCLUSION
in our ICU to evaluate the potential utility of urinary biochemistry in AKI monitoring. his topic is of major interest to intensivists and nephrologists.
Contributions of the authors
AT Maciel conceived the study and research proposal, developed the study design, collected the data and wrote the initial manuscript. M Park collected and analyzed the data. E Macedo conceived the study and proposal, performed the data analysis and wrote the manuscript. All authors agreed to the inal version of the manuscript and agreed to submit it for publication.
RESUMO
Objetivo: Sobreviventes e não sobreviventes da unidade de terapia intensiva apresentam peris ácido-básicos distintos. A re-gulação renal de eletrólitos urinários e a diferença de íons fortes urinários têm papéis principais na homeostase ácido-básica. O objetivo deste estudo foi avaliar a potencial utilidade da men-suração diária dos eletrólitos urinários na monitorização ácido- básica e da função renal.
Métodos: Foram registrados, prospectivamente e diaria-mente, parâmetros ácido-básicos plasmáticos e marcadores tra-dicionais da função renal, em paralelo à medição dos eletrólitos urinários em pacientes com sonda vesical internados na unidade
de terapia intensiva. Os pacientes que permaneceram na unida-de unida-de terapia intensiva com sonda vesical por pelo menos 4 dias foram incluídos neste estudo.
Resultados: Dos 50 pacientes incluídos neste estudo, 22% vieram a óbito durante a internação na unidade de terapia intensi-va. A incidência de lesão renal aguda foi signiicativamente maior nos não sobreviventes, durante os 4 dias de observação (64% ver-sus 18% em sobreviventes). O cloreto e o sódio urinário foram mais baixos, e a diferença de íons fortes urinários mais alta, no 1o dia, em pacientes que desenvolveram lesão renal aguda tanto nos sobreviventes como nos não sobreviventes. Ambos os grupos tiveram débito urinário semelhante, embora os não sobreviventes tenham apresentado diferença de íons fortes urinários persisten-temente mais alta durante o período de observação. Os sobre-viventes apresentaram melhoria progressiva no peril metabólico ácido-básico devido ao aumento, no plasma, da diferença de íons fortes e à diminuição dos ácidos fracos. Essas mudanças foram concomitantes à diminuição da diferença de íons fortes urinários. Com relação aos não sobreviventes, os parâmetros ácido-básicos não tiveram alteração signiicativa durante o seguimento.
Conclusão: A avaliação diária dos eletrólitos urinários e da diferença de íons fortes urinários é útil para a monitorização ácido-básica e da função renal em pacientes críticos, tendo peris distintos entre sobreviventes e não sobreviventes na unidade de terapia intensiva.
Descritores: Cuidados críticos; Acidose; Desequilíbrio hidroeletrolítico; Lesão renal aguda; Monitorização isiológica; Prognóstico
REFERENCES
1. Stewart PA. Modern quantitative acid-base chemistry. Can J Physiol Pharmacol. 1983;61(12):1444-61.
2. Figge J, Rossing TH, Fencl V. The role of serum proteins in acid-base equilibria. J Lab Clin Med. 1991;117(6):453-67.
3. Gattinoni L, Carlesso E, Cadringher P, Caironi P. Strong ion difference in urine: new perspectives in acid-base assessment. Crit Care. 2006;10(2):137. 4. Goldstein MB, Bear R, Richardson RM, Marsden PA, Halperin ML. The
urine anion gap: a clinically useful index of ammonium excretion. Am J Med Sci. 1986;292(4):198-202.
5. Batlle DC, Hizon M, Cohen E, Gutterman C, Gupta R. The use of the urinary anion gap in the diagnosis of hyperchloremic metabolic acidosis. N Engl J Med. 1988;318(10):594-9.
6. Oh M, Carroll HJ. Value and determinants of urine anion gap. Nephron. 2002;90(3):252-5.
7. Kurtz I, Kraut J, Ornekian V, Nguyen MK. Acid-base analysis: a critique of the Stewart and bicarbonate-centered approaches. Am J Physiol Renal Physiol. 2008;294(5):F1009-31.
8. Gatz RK, Elbers PW. In defense of the Stewart approach to acid-base analysis. Kidney Int. 2010;78(7):711.
9. Moviat M, Terpstra AM, van der Hoeven JG, Pickkers P. Impaired renal function is associated with greater urinary strong ion differences in critically ill patients with metabolic acidosis. J Crit Care. 2012;27(3):255-60.
10. Ring T, Frische S, Nielsen S. Clinical review: Renal tubular acidosis--a physicochemical approach. Crit Care. 2005;9(6):573-80.
11. Masevicius FD, Tuhay G, Pein MC, Ventrice E, Dubin A. Alterations in urinary strong ion difference in critically ill patients with metabolic acidosis: a prospective observational study. Crit Care Resusc. 2010;12(4):248-54. 12. Maciel AT, Park M. Differences in acid-base behavior between intensive
care unit survivors and nonsurvivors using both a physicochemical and a standard base excess approach: a prospective, observational study. J Crit Care. 2009;24(4):477-83.
13. Moreno RP, Metnitz PG, Almeida E, Jordan B, Bauer P, Campos RA, Iapichino G, Edbrooke D, Capuzzo M, Le Gall JR; SAPS 3 Investigators. SAPS 3--From evaluation of the patient to evaluation of the intensive care unit. Part 2: Development of a prognostic model for hospital mortality at ICU admission. Intensive Care Med. 2005;31(10):1345-55. Erratum in: Intensive Care Med. 2006;32(5):796.
14. Vincent JL, Moreno R, Takala J, Willatts S, De Mendonca A, Bruining H, et al. The SOFA (Sepsis-related Organ Failure Assessment) score to describe organ dysfunction/failure. On behalf of the Working Group on Sepsis-Related Problems of the European Society of Intensive Care Medicine. Intensive Care Med. 1996;22(7):707-10.
15. Mehta RL, Kellum JA, Shah SV, Molitoris BA, Ronco C, Warnock DG, Levin A; Acute Kidney Injury Network. Acute Kidney Injury Network: report of an initiative to improve outcomes in acute kidney injury. Crit Care. 2007;11(2):R31. 16. Beier K, Eppanapally S, Bazick HS, Chang D, Mahadevappa K, Gibbons FK,
et al. Elevation of blood urea nitrogen is predictive of long-term mortality in critically ill patients independent of “normal” creatinine. Crit Care Med. 2011;39(2):305-13.
18. Langenberg C, Wan L, Bagshaw SM, Egi M, May CN, Bellomo R. Urinary biochemistry in experimental septic acute renal failure. Nephrol Dial Transplant. 2006;21(12):3389-97.
19. Bellomo R, Wan L, Langenberg C, Ishikawa K, May CN. Septic acute kidney injury: the glomerular arterioles. Contrib Nephrol. 2011;174:98-107. Review.
20. Langenberg C, Bagshaw SM, May CN, Bellomo R. The histopathology of septic acute kidney injury: a systematic review. Crit Care. 2008;12(2):R38. 21. Pépin MN, Bouchard J, Legault L, Ethier J. Diagnostic performance
of fractional excretion of urea and fractional excretion of sodium in the
evaluations of patients with acute kidney injury with or without diuretic treatment. Am J Kidney Dis. 2007;50(4):566-73.
22. Hropot M, Fowler N, Karlmark B, Giebisch G. Tubular action of diuretics: distal effects on electrolyte transport and acidification. Kidney Int. 1985;28(3):477-89.
23. Noritomi DT, Soriano FG, Kellum JA, Cappi SB, Biselli PJ, Libório AB, et al. Metabolic acidosis in patients with severe sepsis and septic shock: a longitudinal quantitative study. Crit Care Med. 2009;37(10):2733-9. 24. Koeppen BM. The kidney and acid-base regulation. Adv Physiol Educ.