Official Journal of the Brazilian Psychiatric Association Volume 34 • Number 4 • December/2012
Psychiatry
Revista Brasileira de Psiquiatria
Abstract
Objective: To describe the prevalence of depressive symptoms in the Mexican population, aged 12 to 65 years, by identifying the main related socio-demographic and personal factors. Methods: Data are drawn from the National Survey on Addictions 2008 (ENA 2008), a random, probabilistic, multistage study. A randomly selected sub-sample of 22,962 persons answered the section on depressive symptomatology, measured with the Center for Epidemiologic Studies Depression Scale (CES-D). Results: The total prevalence for depressive symptomatology was 5.1%; the prevalence was 7.5% for women and 2.5% for men. For women, more evidence of depressive symptoms was seen in the central region, whereas for men, symptoms were homogeneous across the country. Factors related to the presence of depressive symptoms include being divorced (in women) or widowed (in men), having lower educational attainment, perceiving one’s place of residence as unsafe, displaying alcohol abuse or dependence, being a regular drug consumer (in men) and having been sexually abused (males and females). Conclusions: The regional distribution of depressive
symptomatology in women indicates the need for region-speciic prevention programs that take into
account the different social problems that affect women’s emotional well-being. More research is
also needed to support the early identiication and intervention of men suffering from depression.
Sociodemographic and personal factors related to depressive
symptomatology in the Mexican population aged 12 to 65
Clara Fleiz Bautista,
1Jorge Villatoro Velázquez,
1María Elena Medina Mora Icaza,
2Midiam Moreno López,
1María de Lourdes Gutiérrez López,
1Natania Oliva Robles
11Dirección de Investigaciones Epidemiológicas y Psicosociales (Direction of Epidemiologic and Psychosocial Research).
Instituto Nacional de Psiquiatría Ramón de la Fuente Muñiz (National Institute of Psychiatry Ramón de la Fuente Muñiz), Mexico.
2Director General of the Instituto Nacional de Psiquiatría Ramón de la Fuente Muñiz
(National Institute of Psychiatry Ramón de la Fuente Muñiz), Mexico.
Submitted on July 20, 2011; accepted on March 15, 2012
DESCRIPTORS:
Depressive Symptomatology; Sociodemographic and Personal Factors; Survey.
ORIGINAL ARTICLE
Corresponding author: Jorge Ameth Villatoro Velázquez. Calz. México-Xochimilco 101, Col. San Lorenzo Huipulco, Deleg. Tlalpan, México, DF, 14370. E-mail: [email protected]
Fatores sociodemográicos e pessoais relacionados à sintomatologia depressiva na
população mexicana entre 12 e 65 anos
Resumo
Objetivo: Conhecer a prevalência de sintomas depressivos a nível nacional na população de 12 a 65
anos e identiicar os principais fatores sociodemográicos e pessoais associados. Método: Os dados foram obtidos da Pesquisa Nacional de Adições (ENA 2008), um estudo aleatório e probabilístico. Uma sub-amostra de 22.962 indivíduos responderam a seção de sintomas depressivos medida com a Escala de Depressão do Centro de Estudos Epidemiológicos (CES-D). Resultados: A prevalência de sintomas depressivos foi de 5,2%; 7,5% em mulheres e 2,5% em homens. Entre as mulheres, os sintomas se apresentaram mais na região central do país e, entre os homens, a distribuição
geográica foi homogênea. Os fatores que se associaram aos sintomas depressivos foram estar
divorciado (mulheres) ou viúvo (homens), ter nível educacional inferior, sentir sua residência como um local não seguro, apresentar dependência de álcool, ser usuário regular de drogas (homens) e abuso sexual. Conclusões: A distribuição regional de sintomatologia depresiva em mulheres indica a necessidade regional de orientação para prevenção, levando em conta que as distintas problemáticas sociais podem afetar seu bem-estar emocional. Entre os homens, mais estudos são
necessários para identiicação precoce da depressão. DESCRITORES:
Sintomatologia depressiva; Fatores
sociodemográicos e
pessoais; Questionário.
Introduction
Depression is recognized worldwide as one of the most impor-tant public health problems. The prevalence of this disorder varies by country, but rates are typically between 4.2% to 17%.1 Moreover, according to some estimates, by 2020
depres-sion will be the second-leading cause of lost years of healthy life globally and the main cause in developed countries.2
In Mexico, studies of depression have been conducted among different populations, using a variety of method-ological strategies and instruments. One of the most recent studies in the country is the National Survey of Psychiatric Epidemiology (Encuesta Nacional de Epidemiología Psiquiátrica - ENEP),3 which was conducted in 2002 in the
urban population aged 18 to 65. It used the Composite International Diagnostic Interview (CIDI) as the basis for diagnosis. During the last year of the interview, major de-pression was one of the most frequently reported disorders, with a prevalence of 1.5%. Another large research study was the National Survey of Performance Evaluation 2002-2003 (Encuesta Nacional de Evaluación de Desempeño, (ENED),4
which included adults aged 18 and over from both urban
and rural sectors. In this study, the deinition of depression
was based on a set of questions developed according to the criteria of the Diagnostic and Statistical Manual of Mental Disorders (DSM-IV), and the increased prevalence over the previous year was 4.5%. Other epidemiological studies conducted in Mexico among the general population have generated estimates for shorter periods using the Center for Epidemiologic Studies Depression Scale (CES-D), which has been widely used at the international level in community samples. This scale measures the presence of depressive symptoms in the seven days prior to the interview.5 It should
be noted that the CES-D is not an instrument for the clinical diagnosis of depression but is, instead, a screening
instru-ment that indicates the risk of illness through the recent
expression of depressive symptomatology.6
The most important studies that have used this scale in Mexico include those conducted in samples of adolescent stu-dents in Mexico City and those conducted in various groups, including women who live in rural areas,7 the migrant rural
population9 and the elderly,10 who attend health centers
and have received psychoeducational intervention due to the presence of depressive symptoms.8 There are only a few
epidemiological studies that include large samples and have used the CES-D for measuring depressive symptomatology. These include the National Surveys on Addictions (Encuestas Nacionales de Adicciones - ENA), conducted in 1988 and 1998. In their sample selection, the authors considered the
urban population aged between 12 and 65. The irst of these
studies reported that, among the adult population, 34% had displayed one or more depressive symptoms during the seven days prior to the interview.11 The second study evaluated the
presence of depressive symptomatology in relation to drug use among adolescents. This study showed that 5.2% of those who were above the cut-off point of 16 on the CES-D scale reported having experimented with substances, compared to only 1.6% of those who did not display symptoms of depres-sive emotional discomfort.12
Other studies have found that some of the socio-demo-graphic factors related to the presence of depression in the adult Mexican population include being a woman, being older, having a low socioeconomic level, being unemployed (mainly in men) and not being married or having a partner.3,13,14 Some of
the associated personal factors include consuming drugs or alcohol and being a victim of violence or migration.9,15,16
Although these studies have provided an epidemiological
overview of depression and other key mental health problems
The aim of this paper is to describe the prevalence of depressive symptomatology and its main associated socio-demographic and personal factors in a representative sample drawn from the Fifth National Survey on Addictions, conducted in 2008.
Material and methods
The description of the methodology of the Household Survey (ENA 2008) has been published in other studies.17 Key features
are described below. The survey was based on a random, probabilistic, multistage sampling design. Information was gathered through face-to-face interviews, or from a com-puterized version, from adults aged between 18 and 65 and teenagers aged between 12 and 17; the interviews were conducted in the respondents’ homes. The protocol was ap-proved by the Ethics Committee of the Ramón de la Fuente National Institute of Psychiatry, and all the participants read an informed consent letter (or, when their educational
attainment was low or they did not know how to read or
write, it was read to them); then, they signed the letter. When minors were invited to participate, parents or tutors signed the letter of consent before the minor participated in the survey; the minor also agreed to be interviewed. The research team emphasized that participating in the interview
was voluntary. They also stressed the conidential nature of the information and the means by which conidentiality
would be guaranteed. The ENA 2008 has national and state representativeness, and it includes both rural areas, which
are deined as areas with 2,500 or fewer inhabitants, and
urban sites, which have more than 2,500 inhabitants. The
ENA 2008’s inal sample size was 51,227 interviews, with a
no-answer rate of 22%.
The distribution of the sample followed the census data. Nearly two in every ten individuals were aged 12 to 17. With regard to marital status, 42.2% of the population was married, and 39.1% was single. Most of the respondents had completed secondary school at most. The majority, 75%, lived in urban sectors. Monthly family incomes for 40.1% of the total sample were between one and two times the na-tional minimum wage.
Instruments
All the respondents in the ENA 2008 answered twelve core sections of the survey, which included socio-demographic questions and questions related to tobacco, alcohol and drug consumption. A random sub-sample, comprising 22,962 individuals, also answered a series of additional questions that included a section on depressive symptomatology; this article contains information on the proportion of respondents who answered this section.
To assess depressive symptomatology, we used the CES-D scale, designed by Radloff5 in 1976. The CES-D scale
con-sists of 20 questions that evaluate depressive mood, lack
of positive affection, somatic symptoms and interpersonal
dificulties experienced in the week prior to the study. The
questions are graded from 0 to 3 (where 0 means that he/she
did not display the symptom during that week, 1 means that
he/she displayed the symptom on 1 or 2 days, 2 means that the respondent displayed the symptom on 3 to 4 days
and, inally, 3 means that he/she displayed the symptom
from 5 to 7 days). The possible range of scores is from 0 to 60 points; the higher the score, the greater the presence of depressive symptomatology.
It is worth mentioning that this instrument was developed to detect clinical depression in community samples and that
a sensitive cut-off point qualiication of 16 was established
previously.6 This approach was validated by Radloff (1977)
in a sample of 70 North American Caucasian patients with a clinical diagnosis of depression. It is also worth stressing that this conventional score has been methodologically disputed in different international studies because it is
considered sensitive, but not very speciic, which leads to
an overestimation of cases. In fact, the author herself noted that this approach was a relatively arbitrary procedure.5
Therefore, in this study, we decided to use a cut-off point of 24 points or more because previous studies conducted
speciically in Latino populations have conirmed that this score is able to jointly maximize sensitivity and speciicity in
97.7% and 79% of cases, respectively.18,19,20 Later, we created a
dummy variable in which a score equal to or less than 23 was coded as 0 and a score equal to or greater than 24 was coded as 1, indicating the presence of depressive symptomatology. In this study, the internal consistency or reliability of
the scale measured with Cronbach’s α (alpha) was 0.85. This
same index has been found in different international studies for the general population.21
For this analysis, we included variables from the ENA 2008 questionnaire concerning gender, age, marital status, educational attainment, family monthly income, and type of community settlement (rural or urban). To obtain respon-dents’ views on how safe or unsafe they felt in their
com-munity of residence, we used the Scale of Risk Perception,
developed by Villatoro and collaborators in 1997. It consists of six questions that evaluate the following features: sale of drugs in schools, public thoroughfares or corner stores; sexual violence in the environment; use of physical force
or the threat of being hurt or killed; attacks with violence; or
any other activities that threatens the security of the re-spondent, his/her family and/or neighbors.22 The answers
to the six questions were summarized, and a single dummy variable was produced. The internal consistency of the scale with Cronbach’s alpha was 0.84.
To assess the link with personal factors, we used four
indicators: 1) dependence or abuse of alcohol, 2) being an experimental drug user, 3) being a regular drug user, and
4) having been a victim of sexual abuse. The irst three factors
were built on the basis of the section of alcohol and drug use in the ENA 2008, which includes basic questions that have been previously validated in national23 and international24
household surveys. Speciically, alcohol abuse/dependence
was measured on the basis of the DSM-IV definition.25
Experimental drug consumption refers to the use, between
one and ive times, of one or more substances included in the
questionnaire as follows: opium and its by-products,
tranquil-izers, sedatives, amphetamines, marijuana, cocaine, crack,
hallucinogens, inhalants, heroine or methamphetamines.
Regular consumption was deined as use on more than ive
explores whether the respondent has been ever forced, hit, or threatened in some way to engage in sexual relations without his/her consent.
Analysis
To assess the relationship between depressive symptom-atology and the personal and sociodemographic variables
considered, a univariate analysis was performed as a irst step. The inal model was tested through multiple logistic
regression analysis, considering the sample design of the multistage study with a different probability of selection of the interviewees, because only one individual per household was randomly selected. This analysis was modeled using the svy command in STATA version 11 (StataCorp, Texas, USA).
Depressive symptomatology was categorized as a dummy variable, and the predictive variables included in the analysis were coded according to the options shown in Table 1. When
a variable had more than one category, the irst option was
used as a reference.
Results
Depressive symptom prevalence during the seven days prior to the study was 5.1% (CI 95% = 4.7-5.6) nationwide. The percentage of females who mentioned depressive symptoms was 7.5% (CI 95% = 6.8-8.3), whereas in males, the preva-lence was 2.5% (CI 95% = 2.1-3.0). We found that in urban settings, the prevalence was 5.3% (CI 95% = 4.7-5.8), and in rural settings, the prevalence was 4.6% (CI 95% = 3.9-5.4).
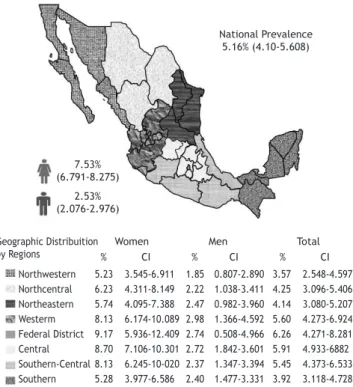
Regional variations
Figure 1 shows the regional variations of depressive
symp-toms by gender. This analysis was based on the conidence
intervals estimated for each region, considering the survey design. The results showed that regional behavior was very similar for both genders. Women living in the central region, however, showed a higher prevalence of depressive symptoms than those living in the northwestern or southern regions.
Factors related to depressive symptomatology
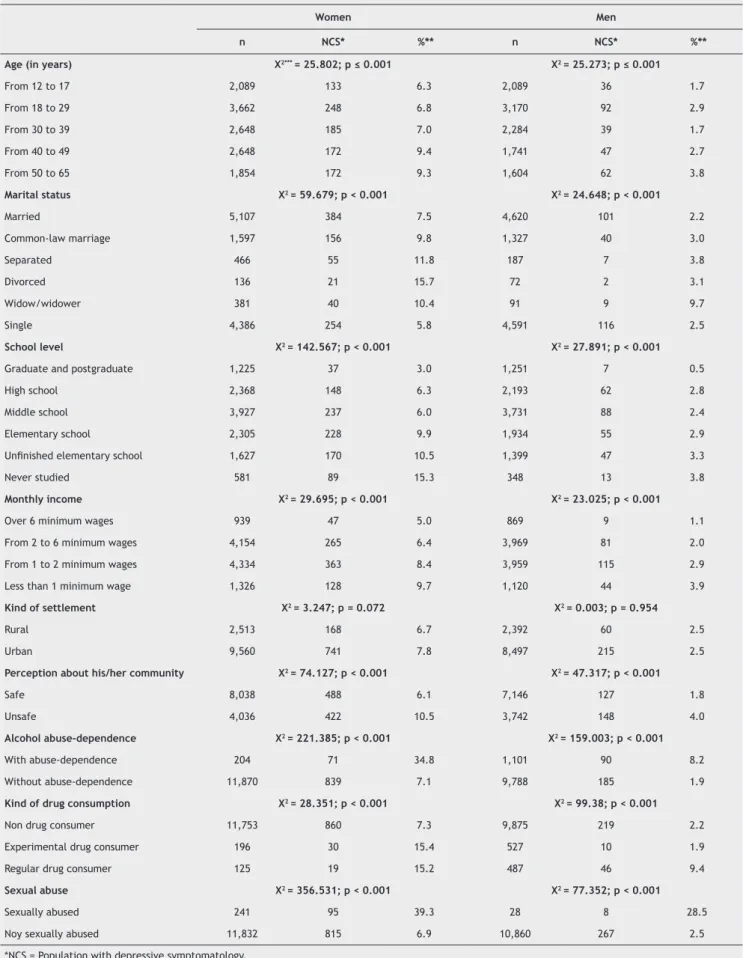
When analyzing how depressive symptomatology is distrib-uted among the various socio-demographic groups by gender,
we found that comparisons were statistically signiicant
(p < 0.001) for almost all the variables analyzed when using the x2. Only the kind of settlement (urban or rural) was
insigniicant for both men and women (Table 1).
We observed that in women, depressive symptomatology progressively increased with age, while there were some
luctuations in this linear age relationship for men. Depressive
symptoms increased for the group aged 18 to 29, decreased for the group aged 30 to 39 and increased again for the two remaining older male cohorts. Divorcées, followed by women who were separated or widowed, displayed the highest rates of depressive symptoms. Single women displayed the lowest depression rates. Depressive symptoms were most prevalent in male widowers and in separated or divorced men. Married men were the least affected. Both genders reported that as education level increased, depressive symptomatology
sig-niicantly decreased. People who had studied at a university
or completed a postgraduate course had the lowest preva-lence of depressive symptoms in comparison with those who had not completed higher education or who had never at-tended school. Depressive symptoms were highest for both genders among those who earned less than the minimum
wage and were signiicantly lower in those respondents who
earned more than six times the minimum wage. There were
no signiicant setting differences because both men and women who lived in urban areas were as likely as those who
lived in rural settings to be affected by depressive symp-tomatology. On the other hand, there was a strong effect of community safety. Depressive symptomatology was lower for both women and men who regarded their community as a safe place to live, compared to those who perceived their community as unsafe.
Personal variables also impacted the rate of depressive symptoms. Depressive symptoms were higher for both men and women who displayed alcohol abuse or dependence, who reported experimental or regular consumption of medical or illegal drugs, or who had experienced sexual abuse.
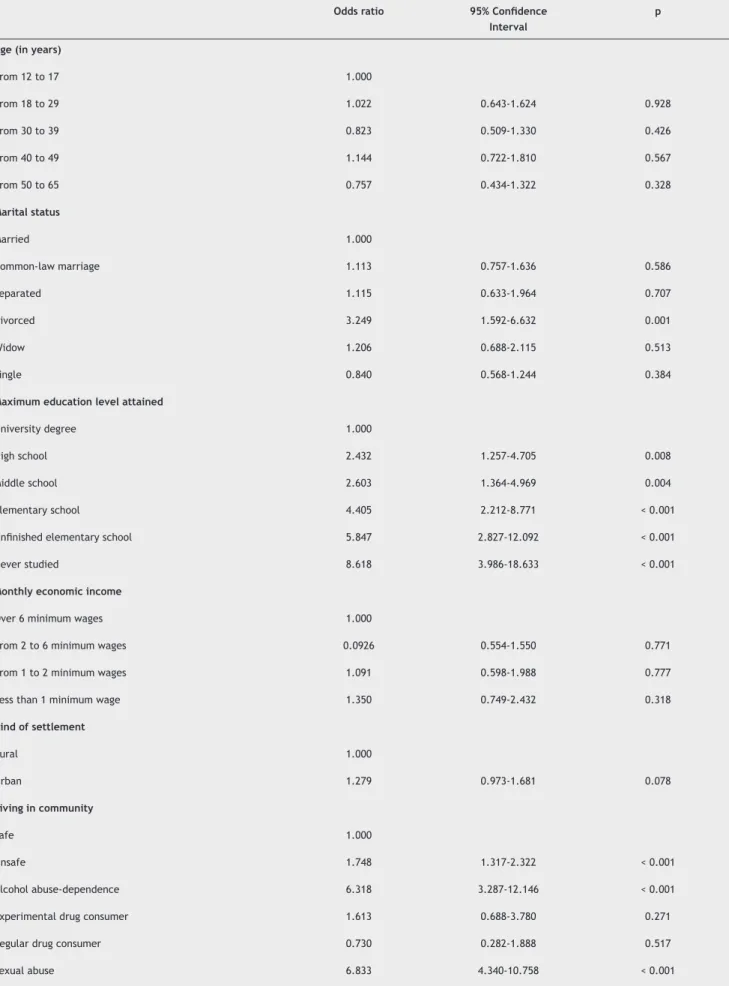
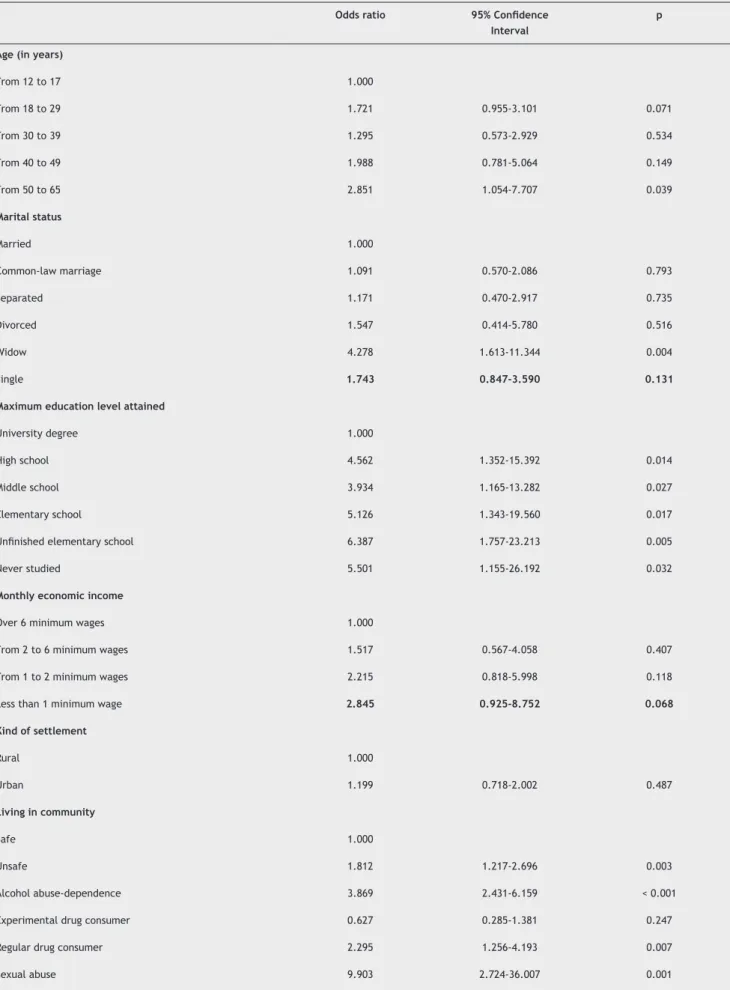
The results of our multiple logistic regressions, conducted separately for each gender, are shown in Tables 2 and 3. To estimate each odds ratio, we used the Enter Method, mod-eling the sample design as described in the section on data analysis. Moreover, due to the variability of this problem at the national level, the region of the country was included as a control variable in the regressions.
For females, the results indicated that being divorced
increased the risk of depressive symptoms 2.2 times com
-pared with the risk for married women. Moreover, those with
lower educational attainment, especially those who had not
completed university degrees, were at greater risk of having
depressive symptoms. Perceiving one’s place of residence as
Figure 1 Regional distribuition of depressive symptomalogy in people aged 12 to 65.
2.53% (2.076-2.976)
Geographic Distribuition
by Regions % CI % CI % CI Women Men Total
Northwestern 5.23 3.545-6.911 1.85 0.807-2.890 3.57 2.548-4.597 Northcentral 6.23 4.311-8.149 2.22 1.038-3.411 4.25 3.096-5.406 Northeastern 5.74 4.095-7.388 2.47 0.982-3.960 4.14 3.080-5.207 Westerm 8.13 6.174-10.089 2.98 1.366-4.592 5.60 4.273-6.924 Federal District 9.17 5.936-12.409 2.74 0.508-4.966 6.26 4.271-8.281 Central 8.70 7.106-10.301 2.72 1.842-3.601 5.91 4.933-6882 Southern-Central 8.13 6.245-10-020 2.37 1.347-3.394 5.45 4.373-6.533 Southern 5.28 3.977-6.586 2.40 1.477-3.331 3.92 3.118-4.728
7.53% (6.791-8.275)
Table 1 Prevalence of depressive symptomatology by ENA 2008 socio-demographic variables (n = 22,962)
Women Men
n NCS* %** n NCS* %**
Age (in years) X2*** = 25.802; p ≤ 0.001 X2 = 25.273; p ≤ 0.001
From 12 to 17 2,089 133 6.3 2,089 36 1.7
From 18 to 29 3,662 248 6.8 3,170 92 2.9
From 30 to 39 2,648 185 7.0 2,284 39 1.7
From 40 to 49 2,648 172 9.4 1,741 47 2.7
From 50 to 65 1,854 172 9.3 1,604 62 3.8
Marital status X2 = 59.679; p < 0.001 X2 = 24.648; p < 0.001
Married 5,107 384 7.5 4,620 101 2.2
Common-law marriage 1,597 156 9.8 1,327 40 3.0
Separated 466 55 11.8 187 7 3.8
Divorced 136 21 15.7 72 2 3.1
Widow/widower 381 40 10.4 91 9 9.7
Single 4,386 254 5.8 4,591 116 2.5
School level X2 = 142.567; p < 0.001 X2 = 27.891; p < 0.001
Graduate and postgraduate 1,225 37 3.0 1,251 7 0.5
High school 2,368 148 6.3 2,193 62 2.8
Middle school 3,927 237 6.0 3,731 88 2.4
Elementary school 2,305 228 9.9 1,934 55 2.9
Uninished elementary school 1,627 170 10.5 1,399 47 3.3
Never studied 581 89 15.3 348 13 3.8
Monthly income X2 = 29.695; p < 0.001 X2 = 23.025; p < 0.001
Over 6 minimum wages 939 47 5.0 869 9 1.1
From 2 to 6 minimum wages 4,154 265 6.4 3,969 81 2.0
From 1 to 2 minimum wages 4,334 363 8.4 3,959 115 2.9
Less than 1 minimum wage 1,326 128 9.7 1,120 44 3.9
Kind of settlement X2 = 3.247; p = 0.072 X2 = 0.003; p = 0.954
Rural 2,513 168 6.7 2,392 60 2.5
Urban 9,560 741 7.8 8,497 215 2.5
Perception about his/her community X2 = 74.127; p < 0.001 X2 = 47.317; p < 0.001
Safe 8,038 488 6.1 7,146 127 1.8
Unsafe 4,036 422 10.5 3,742 148 4.0
Alcohol abuse-dependence X2 = 221.385; p < 0.001 X2 = 159.003; p < 0.001
With abuse-dependence 204 71 34.8 1,101 90 8.2
Without abuse-dependence 11,870 839 7.1 9,788 185 1.9
Kind of drug consumption X2 = 28.351; p < 0.001 X2 = 99.38; p < 0.001
Non drug consumer 11,753 860 7.3 9,875 219 2.2
Experimental drug consumer 196 30 15.4 527 10 1.9
Regular drug consumer 125 19 15.2 487 46 9.4
Sexual abuse X2 = 356.531; p < 0.001 X2 = 77.352; p < 0.001
Sexually abused 241 95 39.3 28 8 28.5
Noy sexually abused 11,832 815 6.9 10,860 267 2.5
*NCS = Population with depressive symptomatology.
Table 2 Socio-demographic and personal variables related to depressive symptomatology in female population
Odds ratio 95% Conidence Interval
p
Age (in years)
From 12 to 17 1.000
From 18 to 29 1.022 0.643-1.624 0.928
From 30 to 39 0.823 0.509-1.330 0.426
From 40 to 49 1.144 0.722-1.810 0.567
From 50 to 65 0.757 0.434-1.322 0.328
Marital status
Married 1.000
Common-law marriage 1.113 0.757-1.636 0.586
Separated 1.115 0.633-1.964 0.707
Divorced 3.249 1.592-6.632 0.001
Widow 1.206 0.688-2.115 0.513
Single 0.840 0.568-1.244 0.384
Maximum education level attained
University degree 1.000
High school 2.432 1.257-4.705 0.008
Middle school 2.603 1.364-4.969 0.004
Elementary school 4.405 2.212-8.771 < 0.001
Uninished elementary school 5.847 2.827-12.092 < 0.001
Never studied 8.618 3.986-18.633 < 0.001
Monthly economic income
Over 6 minimum wages 1.000
From 2 to 6 minimum wages 0.0926 0.554-1.550 0.771
From 1 to 2 minimum wages 1.091 0.598-1.988 0.777
Less than 1 minimum wage 1.350 0.749-2.432 0.318
Kind of settlement
Rural 1.000
Urban 1.279 0.973-1.681 0.078
Living in community
Safe 1.000
Unsafe 1.748 1.317-2.322 < 0.001
Alcohol abuse-dependence 6.318 3.287-12.146 < 0.001
Experimental drug consumer 1.613 0.688-3.780 0.271
Regular drug consumer 0.730 0.282-1.888 0.517
Table 3 Socio-demographic and personal variables related to depressive symptomatology in male population
Odds ratio 95% Conidence Interval
p
Age (in years)
From 12 to 17 1.000
From 18 to 29 1.721 0.955-3.101 0.071
From 30 to 39 1.295 0.573-2.929 0.534
From 40 to 49 1.988 0.781-5.064 0.149
From 50 to 65 2.851 1.054-7.707 0.039
Marital status
Married 1.000
Common-law marriage 1.091 0.570-2.086 0.793
Separated 1.171 0.470-2.917 0.735
Divorced 1.547 0.414-5.780 0.516
Widow 4.278 1.613-11.344 0.004
Single 1.743 0.847-3.590 0.131
Maximum education level attained
University degree 1.000
High school 4.562 1.352-15.392 0.014
Middle school 3.934 1.165-13.282 0.027
Elementary school 5.126 1.343-19.560 0.017
Uninished elementary school 6.387 1.757-23.213 0.005
Never studied 5.501 1.155-26.192 0.032
Monthly economic income
Over 6 minimum wages 1.000
From 2 to 6 minimum wages 1.517 0.567-4.058 0.407
From 1 to 2 minimum wages 2.215 0.818-5.998 0.118
Less than 1 minimum wage 2.845 0.925-8.752 0.068
Kind of settlement
Rural 1.000
Urban 1.199 0.718-2.002 0.487
Living in community
Safe 1.000
Unsafe 1.812 1.217-2.696 0.003
Alcohol abuse-dependence 3.869 2.431-6.159 < 0.001
Experimental drug consumer 0.627 0.285-1.381 0.247
Regular drug consumer 2.295 1.256-4.193 0.007
unsafe also increased the risk of displaying depressive symp
-toms. Likewise, the presence of alcohol abuse/dependence or prior sexual abuse increased the risk 5.3 and 5.8 times,
respectively (Table 2).
Men aged 50 to 65 were 1.8 times more likely to display
depressive symptoms than those aged 12 to 17. Being a
widower increased the risk 3.2 times. Having less than an
university degree and perceiving one’s place of residence as
unsafe cumulatively increased risk by 81.2%. Displaying alcohol
abuse/dependence, being a regular drug consumer or having
been a victim of sexual abuse were also signiicantly related
to depressive symptomatology (Table 3).
Discussion
We report recent information on the national prevalence of depressive symptomatology, as well as the geographical distribution and the socio-demographic and personal factors related to this growing problem. To obtain this informa-tion, we used a representative sample of Mexicans, which included a population aged 12 to 65 living in both rural and urban communities.
In this context, the national prevalence of depressive
symptomatology during the week prior to the study was
5.1% for the entire population. For the female population, the prevalence was higher, at 7.5%, compared to 2.5% for men. It is worth noting that, due to different methodological designs, populations, measuring instruments and variations in CES-D cut-off scores between our research and previous study designs, the results obtained in this study are not absolutely comparable with prior literature, constituting a limitation of the study. In addition to the aforementioned limitations, the CES-D, which is a screening test for com-munity samples, only detects possible cases of depression.
It does not provide a clinically veriied diagnosis of the dis -order.6 Moreover, most of the previous studies that have used
this instrument have set a score of 16 as the cut-off point. Several studies have questioned the high prevalence of depressive symptomatology reported previously because this low cutoff may increase the rate of “false positives”. The population scoring above this cut-off may also include participants with only with mild or transitory symptoms.27
Therefore, a score of 24 was selected as the cut-off point in this paper. Studies conducted in Mexico and other Latin American countries have suggested that a range from 24
to 26 increases the sensitivity and speciicity of the instru -ment.18-20 Likewise, in studies of Mexican rural populations,
Salgado (1994)6 recommended that the analysis of results
with the CESD not be interpreted using pre-established
cut-off points because it is important to take cultural variability
into account.
A comparison of our results by kind of setting found that
depressive symptomatology was similar in rural and urban settings and that the presence of depressive discomfort af-fected both communities in the same way. However, because most epidemiological studies of mental health nationwide have focused on urban populations or have been restricted to certain age groups, the estimates in this study cannot be compared with previous studies. Nevertheless, evidence drawn from our data shows that the prevention and treatment of mental health problems should be extended to rural re-gions because there is very little information on the etiology,
manifestation and treatment needs of the rural community.28
In this context, our study provides an initial overview of the level of depressive symptomatology in these communities.
In line with previous literature, we found a higher pre-dominance of women affected by depressive symptoms than
men. These results are likely inluenced both by biological
issues and by the cultural norms of each region.29
Females in the central region had a greater level of symptomatology than those in the northwestern and south-ern regions. It is important to consider that the states that are part of this region have high rates of social problems, including drug and alcohol consumption and migration, which could be related to the presence of emotional uneasiness in women. The data on drug and alcohol consumption, drawn from a recent survey of addiction,17 indicate that several of
the states in this region display the highest prevalence of the consumption of illicit substances. Moreover, according to national statistics, Guanajuato and the State of Mexico are among the top 10 states for migration rates. Snyder and collaborators (2007)30 mention that the wives of migrants
display high rates of affective disorders, such as depression, anxiety, and “feeling nervous.” Their children display high rates of drug and alcohol abuse. Both problems are
appar-ently related to the absence of the male igure at home,
as well as to family reorganization and to the inclusion of
women in the labor market when remittances are unstable.31
Men’s rate of symptoms was not affected by region, possibly indicating that, for them, in addition to their overall lower rates of symptoms, there is a countrywide cultural pattern
that makes the expression of this symptomatology more homogeneous and dificult to detect.
Our multiple logistic regression identiied which sociode -mographic and personal variables were most related to depressive symptomatology in the Mexican population. Having low educational attainment, together with a percep-tion of insecurity in one’s place of residence, are indicative
of perceived “backwardness” and/or social inequity for
both men and women. Moreover, the literature notes that perceived community disorder, whether in a physical form
(such as grafiti, garbage, deserted houses) or a social
form (such as prostitution, disruptive behavior, delinquency), and its resulting fear of crime or victimization32 jointly affect
general well-being and mental health.33 Poor social
condi-tions affect the Mexican population and may make certain
locales more vulnerable to depressive discomfort.
Divorce increased the risk that women would display depressive symptomatology. In line with our inding, na -tional studies have documented how divorced women, who are also typically the heads of their household, are
more likely to display a depressive disorder. These women
undergo multiple major life transitions, including changes in marital, social and labor status, and new relationships with their former spouse and children, in a short period of
time. In addition, divorcees undertake a greater propor
-tion of tasks related to child rearing, work and maintaining
a household than do their married counterparts.13,34 Men
between the ages of 50 and 65 are more likely to display
depressive symptomatology. It is important to identify and treat depression in elderly men. They may experience
more stress, particularly if they have changed or modiied
The loss of this cultural role, e.g., through retirement, leads to a loss of self-esteem that can cause depression and can
sometimes lead to a high risk of suicide.35 In addition, we found
that being a widower increased the risk of developing depres -sive symptomatology. This supports prior results from Burin (1990),36 who noted that men who have lost their partners are
more likely to develop depressive discomfort because, among other factors, they ind it culturally complicated to care for
and pay attention to themselves without a spouse.
Many of our results are intuitive and coincide with inter-national studies. Both our studies and the existing literature suggest that single people and those with low educational at-tainment show higher indices of depressive symptomatology.37
Sexual abuse is a signiicant predictor of depressive symp
-tomatology for both men and women. It is crucial to make health workers aware of the need for the timely detection
of this traumatic event. Sexual abuse creates a stigma, and victims may hide what they have experienced. Men, in
particu-lar, may keep silent because of perceived cultural and gender issues. Indeed, the literature conirms that people who have been sexually abused are more likely to develop depression,
suicidal ideation, post-traumatic stress disorder and anxiety.38
Finally, the consumption of alcohol and other substances
increases the risk for depressive symptomatology. The depressive risk related to the consumption of alcohol was signiicant for both genders, while the consumption of other illegal substances was only a signiicant predictor for men.
International research has questioned whether the use of toxic substances is a symptom of underlying depression or a dysfunction that occurs simultaneously.39 In Mexico, data
from the ENEP showed that one third of individuals with substance abuse disorders also had an affective disorder. Moreover, half the men who displayed substance abuse or dependence had also previously displayed depressive symptoms.16 A survey conducted among female middle and
high school students found that 60.7% of the women who had consumed drugs displayed depressive symptomatol-ogy, whereas only 25.2% of the non-consumers reported symptoms.40 Given that drug consumption is a risk factor
for displaying other mental health problems, it is important to provide integrated treatment.
Limitations of the study
This study was conducted in a national sample, which enabled us to describe the distribution of depressive symptoms in Mexico and their related factors. Nevertheless, one study limitation is derived from the study design because it is transversal and correlational. Information drawn from it can only be interpreted as elements related to the problem under study, although the statistical design could imply a possibly causal relationship.
Another limitation is derived from the use of the CES-D, which is a list of symptoms rather than a diagnostic test. The results described here should be regarded more as a
risk-based screen than as a possible diagnosis.
Conclusion
The regional distribution of depressive symptomatology
illustrated in this work clearly shows which regions would beneit from enhanced prevention and intervention programs,
especially those designed for women. Social problems, such as drug and alcohol consumption or migration, may disproportionately affect women’s emotional well-being. It is necessary to conduct more research at the national level to detect depression and other mental health problems in men in a timely fashion. As well as more research on the most vulnerable populations, such as rural and indigenous settlements that would provide greater clarity about the way
they express their discomfort. Likewise, it is important to consider the inluences of socio-demographic and personal
factors on the rate of suffering in both men and women. Finally, it is worth mentioning that although women showed a higher prevalence of depressive symptomatology, the socio-demographic and personal factors related to discomfort were almost the same for both genders. These discoveries indicate that it is necessary to intervene in the same areas for both men and women. However, it is also necessary to consider
speciic features related to the social construction of each
gender because the meanings attributed to the depressive experience may vary subjectively between genders.
Acknowledgments
We would like to thank Dr. Silvia Cruz for the valuable com
-ments and suggestions she made on this work, as well as the
Río Arronte Foundation and the National Addictions Council
(Consejo Nacional contra las Adicciones) for the inancial
support given to this project.
Disclosures
Clara Fleiz Bautista
Employment: Direction of Epidemiologic and Psychosocial Research, Instituto Nacional de Psiquiatría Ramón de la Fuente Muñiz (National Institute of Psychiatry Ramón de la Fuente Muñiz), Mexico.
Jorge Villatoro Velázquez
Employment:Direction of Epidemiologic and Psychosocial Research, Instituto Nacional de Psiquiatría Ramón de la Fuente Muñiz (National Institute of Psychiatry Ramón de la Fuente Muñiz), Mexico.
María Elena Medina-Mora Icaza
Employment:General Director of the Instituto Nacional de Psiquiatría Ramón de la Fuente Muñiz (National Institute of Psychiatry Ramón de la Fuente Muñiz), Mexico.
Midiam Moreno López
Employment: Direction of Epidemiologic and Psychosocial Research, Instituto Nacional de Psiquiatría Ramón de la Fuente Muñiz (National Institute of Psychiatry Ramón de la Fuente Muñiz), Mexico.
María de Lourdes Gutiérrez López
Employment:Direction of Epidemiologic and Psychosocial Research, Instituto Nacional de Psiquiatría Ramón de la Fuente Muñiz (National Institute of Psychiatry Ramón de la Fuente Muñiz), Mexico.
Natania Oliva Robles
Employment:Direction of Epidemiologic and Psychosocial Research, Instituto Nacional de Psiquiatría Ramón de la Fuente Muñiz (National Institute of Psychiatry Ramón de la Fuente Muñiz), Mexico.
This study involved no conlicts of interest, whether economic, personal,
political or academic, related to any of the authors. * Modest
** Signiicant
*** Signiicant. Amounts given to the author’s institution or to a colleague for research in which the author has participation, not directly to the author.
References
2. Murray CJ, López AD. Alternative projections of mortality and disability by cause 1990-2020: Global burden of disease study. Lancet. 1997;349(9064):1498-504.
3. Medina-Mora ME, Borges G, Lara C, Benjet C, Blanco J, Fleiz C, Villatoro J, Rojas G, Zambrano J, Casanova L, Aguilar-Gaxiola S. Prevalencia de trastornos mentales y uso de servicios: resultados de la Encuesta Nacional de Epidemiología Psiquiátrica en México. Salud Ment. 2003;26(4):1-16.
4. Belló M, Puentes E, Medina-Mora ME, Lozano R. Prevalencia y diagnóstico de depresión en población adulta en México. Salud Publica Mex. 2005;47(1):4-11.
5. Radloff L. The CES-D scale: a self report depression scale for research in the general population. Appl Psychol Measurement. 1977;1:385-401.
6. Salgado de Snyder VN, Maldonado M. Características psicométricas de la escala de depresión del Centro de Estudios Epidemiológicos en mujeres adultas de áreas rurales. Salud Publica Mex. 1994;36(2):200-9.
7. González C, Jiménez JA, Ramos L, Wagner F. Aplicación de la escala de depresión del center of epidemiological studies in teenagers de la ciudad de México. Salud Publica Mex. 2008;50(4):292-9.
8. Lara MA, Navarro C, Navarrete L, Mondragón L, Rubi N. Seguimiento a dos años de una intervención psicoeducativa para mujeres con síntomas de depresión, en servicios de salud para población abierta. Salud Ment. 2003;26(3):27-36.
9. Aguilera-Guzmán R, Carreño M, Juárez F. Características psicométricas de la CES-D en una muestra de adolescentes rurales mexicanos de zonas con alta tradición migratoria. Salud Ment. 2004;27(6):57-66.
10. Ávila JA, Melano E, Payette H, Amieva H. Síntomas depresivos como factor de riesgo de dependencia en adultos mayores. Salud Publica Mex. 2007;49(5):367-75.
11. Medina-Mora ME, Rascón ML, Tapia R, Mariño M, Juárez F, Villatoro J, Caraveo J, Goméz M. Trastornos emocionales en población urbana mexicana: resultados de un estudio nacional. An Inst Mex Psiquiatr. 1992;3:48-55.
12. Medina-Mora ME, Cravioto P, Villatoro J, Fleiz C, Galván F, Tapia R. Consumo de drogas entre adolescentes: resultados de la Encuesta Nacional de Adicciones, 1998. Salud Publica Mex. 2003;45(1):16-25.
13. Berenzon S, Tiburcio M, Medina-Mora ME. Variables demográicas
asociadas con la depresión: diferencias entre hombres y mujeres que habitan en zonas urbanas de bajos ingresos. Salud Ment. 2005;28(6):33-40.
14. Fleiz C, Ito ME, Medina-Mora ME, Lira R. Los malestares masculinos: Narraciones de un grupo de varones adultos de la Ciudad de México. Salud Ment. 2008;31(5):381-90.
15. Natera G, Juárez F, Medina-Mora ME, Tiburcio M. La depresión y su relación con la violencia de pareja y el consumo de alcohol en mujeres mexicanas. Rev Mex Psicol. 2007;24(2):165-73. 16. Medina-Mora ME, Rojas E, Borges G, Vázquez L, Fleiz C,
Real T. Comorbidity: depression and substance abuse. In: Aguilar-Gaxiola S, Guillota T (comps). Depression in Latinos.
Assessment, treatment and prevention. New York. USA:
Springer; 2008: pp. 73-92.
17. Consejo Nacional contra las Adicciones, Instituto Nacional de Psiquiatría Ramón de la Fuente, Instituto Nacional de Salud Pública. Encuesta Nacional de Adicciones, 2008. Reporte Nacional. México, Instituto Nacional de Salud Pública; 2009. 18. Gempp R, Avendaño C, Muñoz C. Normas y punto de corte para
la escala de depresión del Centro para Estudios Epidemiológicos (CES-D) en población juvenil chilena. Terapia Psicológica 2004;22(2):145-56.
19. Mariño MC, Medina-Mora ME, Chaparro JJ, González-Forteza C.
Coniabilidad y estructura factorial del CES-D en una muestra
de adolescentes mexicanos. Rev Mex Psicol. 1993;10(2):141-5.
20. Medina-Mora ME, Rascón ML, Tapia R, Mariño MC, Juárez F, Villatoro J et al. Trastornos emocionales en población urbana mexicana: resultados de un estudio nacional. An Inst Mex Psiquiatr. 1992;3:48-55.
21. Herrero J, Gracia E. Una medida breve de la sintomatología depresiva (CESD-7). Salud Ment. 2007;30(5):40-6.
22. Villatoro J, Domenech M, Medina-Mora ME, Fleiz C, Fresán A. Percepción de la inseguridad social y su relación con el uso de drogas. Rev Mex Psicol. 1997;14(2):105-12.
23. Secretaría de Salud, Subsecretaría de Prevención y Control de Enfermedades, Instituto Mexicano de Psiquiatría, Dirección General de Epidemiología, Consejo Nacional Contra las Adicciones. Tercera Encuesta Nacional de Adicciones 1998, México: Secretaría de Salud; 1998.
24. Substance Abuse and Mental Health Services Administration,
Ofice of Applied Studies. National Household Survey on Drug Abuse: Main Findings, 1991: Rockville, MD: Department of Health
and Human Services; 1993.
25. American Psychiatric Association. Diagnostic and statiscal manual of mental disorders, 4a ed. Washington, DC: American Psychiatric Association; 1995.
26. Ramos L, Saldivar G, Medina-Mora ME, Rojas E, Villatoro J. Prevalencia de abuso sexual en estudiantes y su relación con el consumo de drogas. Salud Publica Mex. 1998;40(3):221-33. 27. Weich S, Blanchard M, Prince M, Burton E, Erens B, Sproston
K. Mental health and the built environment: cross-sectional
survey of individual and contextual risk factors for depression.
Br J Psych. 2002;180:428-33.
28. Salgado de Synder VM; Díaz MJ. Salud mental de las mujeres rurales: problemas, necesidades y alternativas. In: Lara MA, salgado de Synder VM, editors. Cálmese, son sus nervios, tómese un tecito. México: Pax, 2002. pp. 151-72.
29. Piccinelli M, Wilkinson G. Gender differences in depression.
Critical review. Br J Psych. 2000;177:486-92.
30. Salgado de Snyder NV, González T, Bojorquez I, Infante C. Vulnerabilidad social, salud y migración México-Estados Unidos. Salud Publica Mex. 2007;49:8-10.
31. Arias P, Mummert G. Familia, mercados de trabajo y migración en el centro de México. Revista Nueva Antropología. 1987;9(32):105-28. 32. Perkins D, Meeks W, Taylor RB. The physical environment of street
blocks and resident perceptions of crime and disorder: Implications
for theory and measurement. J Env Psychol. 1992;12:21-43. 33. Santana P, Nogueira H. Environment and Health: Place, sense
of place and weight gain in urban areas. In: Eyles J, Williams A, editors. Place, sense of place and quality of life. Hampshire: Ashgate, 2008. pp. 153-65.
34. Valdés A, Basulto G, Choza E. Percepciones de mujeres divorciadas acerca del divorcio. Enseñanza e Investigación en Psicología. 2009;14(1):23-35.
35. Conwell Y. Suicide in later life: a review and recommendations for prevention. Suicide Life Threat Behav. 2001;31:32-47.
36. Burin M. Delimitación del campo de la salud mental de las mujeres. En: Burin M, Moncarz E, Velázquez S, comps. El malestar de las mujeres. La tranquilidad recetada México: Paidós; 1990; pp. 13-21. 37. Inaba A, Thoits P, Ueno K, Gove W, Evenson R, Sloan M. Depression in the United States and Japan: Gender, marital status and SES patterns. Soc Sci Med. 2005;61(11):2280-92.
38. Finkelhor D, Browne W. Sexually victimized children, New York:
Free Press; 1985.
39. Regier DA, Rae DS, Narrow WE, Kaelber CT, Schatzberg AF. Prevalence of anxiety disorders and their comorbidity with mood and addictive disorders. Br J Psych. 1998;173(Supl. 34):24-8. 40. Villatoro J, Gutiérrez ML, Quiroz M, Gaytán L, Gaytán F,