Quantitative inheritance of some wheat plant traits
D. Novoselovic
1, Marijana Baric
2, G. Drezner
1, J. Gunjaca
2and A. Lalic
1 1Agricultural Institute Osijek, Osijek, Croatia.
2
University of Zagreb, Faculty of Agriculture, Zagreb, Croatia.
Abstract
The objective of this study was to estimate gene effects and genetic variability for some quantitative traits of two winter wheat crosses (Soissons/Zitarka and Soissons/Sana) by generation mean analysis. In most cases a digenic epistatic model was sufficient to explain variation in generation means. The additive-dominance model was adequate for plant height and grain weight per spike of the longest culm. In two cases (grain yield per plant and single grain weight) these models failed to explain variation in generation means, implying the presence of higher order interactions or interactions between linked loci. Dominance effects and additive x additive epistasis were more important than additive effects and other epistatic components. Only complementary type epistasis was observed. The estimated values of narrow-sense heritability (h2
n) varied for plant height (54-81%), number of heads per plant
(9-76%), number of grains per spike (11-99.8%), grain weight per spike (23-73%), grain yield per plant (21-78%) and single grain weight (49.7-72%). The adequacy of certain modes of inheritance as well as the importance and significance of gene effects and genetic components of variance for analyzed traits were dependent upon the particular crossing combination and experimental site.
Key words:wheat, quantitative traits, joint scaling test, gene effects, heritability.
Received: February 12, 2003; Accepted: August 20, 2003.
Introduction
Grain yield is a complex trait made up of the interac-tion between different yield components and environmen-tal effects. Because of these complex interactions it is difficult to improve yield through breeding (especially in the early generations) if yield is the only factor recorded, suggesting that component traits should also be used as se-lection criteria for yield improvement. This is the reason why it is necessary to know the genetic architecture of yield components (Misraet al., 1994). Generation mean analysis is a simple but useful technique for estimating gene effects for a polygenic trait, its greatest merit lying in the ability to estimate epistatic gene effects such as additive x additive (aa), dominance x dominance (dd) and additive x domi-nance (ad) effects (Singh and Singh, 1992).
Besides gene effects, breeders would also like to know how much of the variation in a crop is genetic and to what extent this variation is heritable, because efficiency of selection mainly depends on additive genetic variance, in-fluence of the environment and interaction between geno-type and environment.
The research reported in this paper was carried out to provide information about gene effects and available ge-netic variability for the most important quantitative traits of winter wheat (Triticum aestivum L.).
Material and Methods
We used winter wheat (Triticum aestivum L.), the fe-male parent used in the crosses being cultivar (cv.) Soissons (bred by Desprez, Veuve et Fils, France) and the male par-ent cv. Sana (bred by the Bc Institute for Plant Breeding and Seed Production, Zagreb, Croatia) and cv. Zitarka (bred by the Agricultural Institute, Osijek, Croatia).
The six basic generations (parent cultivars (P1, P2),
first and second filial generations (F1, F2), first and second
backcrosses (BC1, BC2)) of two combinations of crossings
(Soissons/Zitarka and Soissons/Sana) were planted in a randomized block design in two replicate plots at two sites (Osijek and Nova Gradiska, Croatia) during the autumn season of 1999/2000. The experimental field layout was rectangular at the Osijek site and square at the Nova Gradiska site. The plots were 1 m long with a between-row spacing of 20 cm and a within-row spacing of 10 cm. The number of rows per plot and the number of analyzed plants per plot varied depending on the generation.
www.sbg.org.br
Send correspondence to Dario Novoselovic. Agricultural Institute Osijek, Juzno predgradje 17, Hr-31000 Osijek, Croatia. E-mail: [email protected].
The traits assessed were: plant height (cm); number of heads per plant; number of grains per spike of the longest culm; grain weight per spike of the longest culm (g); grain yield per plant (g) and single grain weight (mg),i.e.grain weight per spike of the longest culm divided by the number of grains on that particular spike.
The mean values, standard errors and variances of the different generations were subjected to weighted least squares analysis using the joint scaling test (Mather and Jinks, 1982) to estimate gene effects and the maximum likelihood method (Hayman, 1960) to estimate variance components to fit models of increasing complexity until an adequate description of the observed means were found as shown by non-significance in theχ2test. The significance
of genetic parameters was tested by t-test.
The type of epistasis was determined only when dom-inance (d) and domdom-inance x domdom-inance (dd) effects were significant, when these effects had the same sign the effects were complementary while different signs indicated dupli-cate epistasis (Kearsey and Pooni, 1996).
Homogeneity of variances of non-segregating gener-ations was tested for using Bartlett’s test (Bartlett, 1937), and when the variances were heterogeneous the environ-mental variance (VE) was replaced by an adequate number
of separate parameters in the model fitting and pooled to produce a single environmental variance. Additive, domi-nance and environmental variance components were esti-mated using the maximum likelihood method with the observed variances of the six basic generations being used as the initial weights (df/2*s2+ 2) until theχ2test values
reached a minimum (Lynch and Walsh, 1998).
Narrow-sense heritability (h2n) was calculated as
fol-lows:
h2n= V*A/V*A+ V*D+ VE, where V*A= 0.5*a2Ais
the additive genetic component of variance, V*D =
0.25*d2A the dominance or non-additive genetic
compo-nent of variance and VE the environmental variance
(Kearsey and Pooni, 1996). The V*Dvalue was set to zero
when estimated variance turned out to be a negative. All statistical analyses were carried out using the STAT module and PROC REG procedure of the SAS soft-ware (SAS Institute, 1996).
Results
The mean values, their standard errors and variances for the analyzed traits of the two crosses at the two sites are presented in Tables 1 and 2. The parents of the Soissons/ Zitarka cross differed in respect to the number of heads per plant, grain yield per plant and single grain weight at both sites, although for the F1generation only the means for the
number of grains and grain weight per spike of the longest culm and single grain weight were greater than the better parent, and this occurred only at the Nova Gradiska site. For the other traits, differences were not so conspicuous
Novoselovicet al. 93
Table 1- Quantitative trait data for the Soissons/Zitarka cross at the
Osijek and Nova Gradiska sites.
Quantitative trait data for the Soissons/Zitarka cross
Osijek site Nova Gradiska site
Generation1 Mean ± SE2 Variance Mean ± SE Variance
Plant height (cm)
P1 64.3 ± 0.69 30.47 75.3 ± 0.29 5.80
P2 65.0 ± 0.58 22.88 68.4 ± 0.36 8.68
F1 63.9 ± 0.78 42.59 70.7 ± 0.54 28.58
F2 70.0 ± 0.44 75.31 73.6 ± 0.38 48.95
BC1 64.0 ± 0.88 49.28 72.1 ± 0.52 23.79
BC2 67.1 ± 0.60 31.32 71.6 ± 0.50 23.25
Number of heads per plant
P1 11.0 ± 0.34 7.39 9.0 ± 0.25 4.31
P2 7.6 ± 0.23 3.59 6.9 ± 0.21 2.95
F1 8.6 ± 0.35 8.58 6.8 ± 0.23 5.18
F2 10.8 ± 0.21 17.15 7.0 ± 0.11 4.10
BC1 9.0 ± 0.28 6.04 7.6 ± 0.19 3.18
BC2 8.5 ± 0.24 5.01 7.9 ± 0.24 5.36
Number of grains per spike of the longest culm
P1 58.5 ± 1.23 96.83 53.8 ± 0.89 54.65
P2 58.3 ± 0.92 57.56 52.1 ± 0.91 55.48
F1 55.4 ± 1.09 83.17 55.9 ± 1.05 108.05
F2 58.7 ± 0.70 190.61 52.5 ± 0.59 118.00
BC1 61.1 ± 1.31 132.14 53.1 ± 1.12 110.39
BC2 60.4 ± 0.93 75.25 53.6 ± 0.96 85.71
Grain weight per spike of the longest culm (g)
P1 2.55 ± 0.06 36.97 2.18 ± 0.04 0.11
P2 2.72 ± 0.05 6.54 2.20 ± 0.04 0.11
F1 2.47 ± 0.06 24.37 2.42 ± 0.05 0.25
F2 2.61 ± 0.04 130.86 2.26 ± 0.03 0.31
BC1 2.61 ± 0.06 43.31 2.23 ± 0.05 0.22
BC2 2.80 ± 0.05 29.27 2.22 ± 0.04 0.15
Grain yield per plant (g)
P1 20.37 ± 0.83 44.09 17.88 ± 0.60 24.84
P2 14.36 ± 0.53 19.10 10.97 ± 0.39 10.19
F1 16.76 ± 0.83 48.22 13.57 ± 0.54 28.58
F2 20.96 ± 0.52 105.19 13.42 ± 0.26 22.92
BC1 15.89 ± 0.66 33.54 14.37 ± 0.51 22.89
BC2 17.68 ± 0.63 34.53 13.75 ± 0.44 18.00
Single grain weight (mg)
P1 43.55 ± 0.49 15.37 40.56 ± 0.35 8.45
P2 46.63 ± 0.43 12.57 42.23 ± 0.34 7.75
F1 44.51 ± 0.52 18.93 43.25 ± 0.33 10.67
F2 44.16 ± 0.30 35.01 43.12 ± 0.23 17.93
BC1 42.68 ± 0.46 16.29 42.15 ± 0.41 14.79
BC2 46.26 ± 0.40 13.92 41.53 ± 0.38 13.43
1
P1, P2= parent cultivars; F1, F2= first and second filial generations; BC1, BC2= first and second backcrosses.
2
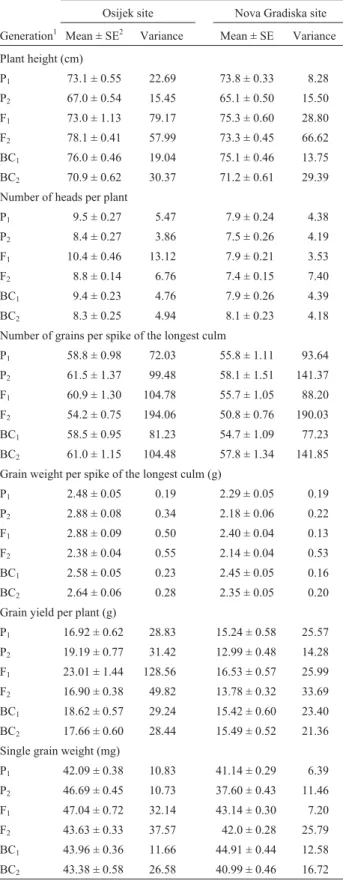
and consistent. The observed variances were lower at the Nova Gradiska site for all analyzed traits (Table 1). For the Soissons/Sana cross, at both sites, parents differed in re-spect of plant height and number of grains per spike of the longest culm but, depending on the site, differences be-tween these parents were inconsistent for grain weight per spike of the longest culm, grain yield per plant and single grain weight. For the number of heads per plant differences were not so conspicuous at either site. At both sites the mean grain yield per plant and single grain weight of the F1
generation of this cross was greater than that of the better parent, but the means for plant height and grain weight per spike of the longest culm of the F1generation were greater
than the corresponding means for the parents only at the Nova Gradiska site, while the mean number of heads per plant was greater for the F1generation only at the Osijek
site. The variances were lower at the Nova Gradiska site for all the analyzed traits except number of grains per spike of the longest culm where the differences were not so consis-tent (Table 2).
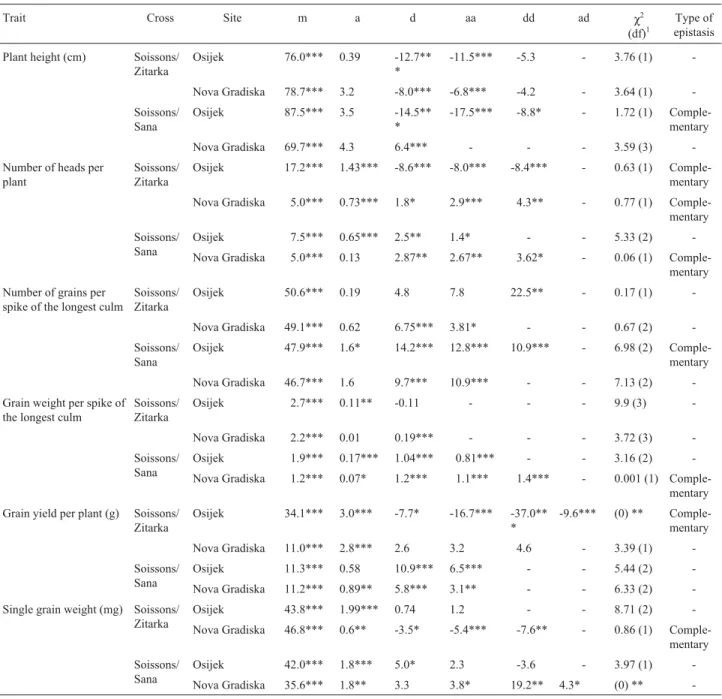
The estimates of the main and first order interaction gene effects andχ2values are presented in Table 3.
For plant height, an additive-dominance model was adequate only for the Soissons/Sana cross at the Nova Gradiska site, while a digenic epistatic model was adequate for the Soissons/Sana cross at the Osijek site and the Soissons/Zitarka cross at both sites (non-significant χ2
test), with dominance effects and additive x additive epistasis being more important than other genetic effects and complementary epistasis being found only in the Sois-sons/Sana cross at the Osijek site. For the number of heads per plant and the number of grains per spike of the longest culm the digenic epistatic model was adequate for both crosses and for both sites, with dominance effects and dom-inance x domdom-inance epistasis, when present, being more important as compared to other genetic effects. Except for the Soissons/Sana cross at the Osijek site, both crosses showed complementary epistasis for the number of heads per plant. For the number of grains per spike of the longest culm complementary epistasis was only found in the cross Soissons/Sana at the Osijek site. For grain weight per spike of the longest culm, an additive-dominance model ade-quately explained variation between generations of the Soissons/Zitarka cross, while a digenic epistatic model was applicable to the Soissons/Sana cross at both sites, although complementary epistasis was found only in the Soissons/ Sana cross at the Nova Gradiska site. For grain yield per plant,both models failed to explain variation between gen-erations (significantχ2test) for the Soissons/Zitarka cross
at the Osijek site, with all three epistasis components being significant and both negative and complementary epistasis also being found. However, at the Nova Gradiska site a digenic epistatic model adequately explained variation be-tween the Soissons/Zitarka cross generations regarding
Table 2- Quantitative trait data for the Soissons/Sana cross at the Osijek
and Nova Gradiska sites.
Quantitative trait data for the Soissons/Sana cross
Osijek site Nova Gradiska site
Generation1 Mean ± SE2 Variance Mean ± SE Variance
Plant height (cm)
P1 73.1 ± 0.55 22.69 73.8 ± 0.33 8.28
P2 67.0 ± 0.54 15.45 65.1 ± 0.50 15.50
F1 73.0 ± 1.13 79.17 75.3 ± 0.60 28.80
F2 78.1 ± 0.41 57.99 73.3 ± 0.45 66.62
BC1 76.0 ± 0.46 19.04 75.1 ± 0.46 13.75
BC2 70.9 ± 0.62 30.37 71.2 ± 0.61 29.39
Number of heads per plant
P1 9.5 ± 0.27 5.47 7.9 ± 0.24 4.38
P2 8.4 ± 0.27 3.86 7.5 ± 0.26 4.19
F1 10.4 ± 0.46 13.12 7.9 ± 0.21 3.53
F2 8.8 ± 0.14 6.76 7.4 ± 0.15 7.40
BC1 9.4 ± 0.23 4.76 7.9 ± 0.26 4.39
BC2 8.3 ± 0.25 4.94 8.1 ± 0.23 4.18
Number of grains per spike of the longest culm
P1 58.8 ± 0.98 72.03 55.8 ± 1.11 93.64
P2 61.5 ± 1.37 99.48 58.1 ± 1.51 141.37
F1 60.9 ± 1.30 104.78 55.7 ± 1.05 88.20
F2 54.2 ± 0.75 194.06 50.8 ± 0.76 190.03
BC1 58.5 ± 0.95 81.23 54.7 ± 1.09 77.23
BC2 61.0 ± 1.15 104.48 57.8 ± 1.34 141.85
Grain weight per spike of the longest culm (g)
P1 2.48 ± 0.05 0.19 2.29 ± 0.05 0.19
P2 2.88 ± 0.08 0.34 2.18 ± 0.06 0.22
F1 2.88 ± 0.09 0.50 2.40 ± 0.04 0.13
F2 2.38 ± 0.04 0.55 2.14 ± 0.04 0.53
BC1 2.58 ± 0.05 0.23 2.45 ± 0.05 0.16
BC2 2.64 ± 0.06 0.28 2.35 ± 0.05 0.20
Grain yield per plant (g)
P1 16.92 ± 0.62 28.83 15.24 ± 0.58 25.57
P2 19.19 ± 0.77 31.42 12.99 ± 0.48 14.28
F1 23.01 ± 1.44 128.56 16.53 ± 0.57 25.99
F2 16.90 ± 0.38 49.82 13.78 ± 0.32 33.69
BC1 18.62 ± 0.57 29.24 15.42 ± 0.60 23.40
BC2 17.66 ± 0.60 28.44 15.49 ± 0.52 21.36
Single grain weight (mg)
P1 42.09 ± 0.38 10.83 41.14 ± 0.29 6.39
P2 46.69 ± 0.45 10.73 37.60 ± 0.43 11.46
F1 47.04 ± 0.72 32.14 43.14 ± 0.30 7.20
F2 43.63 ± 0.33 37.57 42.0 ± 0.28 25.79
BC1 43.96 ± 0.36 11.66 44.91 ± 0.44 12.58
BC2 43.38 ± 0.58 26.58 40.99 ± 0.46 16.72
1
P1, P2= parent cultivars; F1, F2= first and second filial generations; BC1, BC2= first and second backcrosses.
2
grain yield per plant, although only additive effects were significant.
For the Soissons/Sana cross, grain yield per plant was adequately explained by a digenic epistatic model with dominance effects and additive x additive epistasis being most important. For single grain weight, the digenic epistatic model was satisfactory for the Soissons/Zitarka and Soissons/Sana crosses at the Osijek site, although both the additive-dominance model and the digenic epistatic model failed to explain variation in single grain weight in
the Soissons/Sana cross at the Nova Gradiska site where all three epistasis components were significant and positive. Complementary type of epistasis was only found in the Soissons/Zitarka cross at the Nova Gradiska site (Table 3).
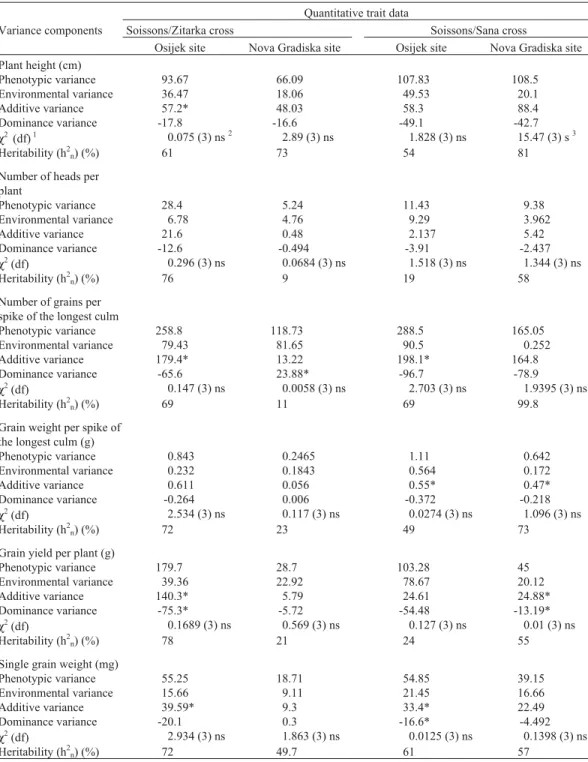
The estimates of the different variance components and narrow-sense heritability (h2n) are presented in Table 4.
Maximum likelihood estimates of environmental variance were higher at the Osijek site than the Nova Gradiska site for all traits and crosses except the number of grains per spike of the longest culm for the Soissons/Zitarka cross.
Novoselovicet al. 95
Table 3- The estimates of gene effects for six quantitative traits in two crossing combinations and sites.
Trait Cross Site m a d aa dd ad χ2
(df)1
Type of epistasis
Plant height (cm) Soissons/ Zitarka
Osijek 76.0*** 0.39 -12.7** *
-11.5*** -5.3 - 3.76 (1)
-Nova Gradiska 78.7*** 3.2 -8.0*** -6.8*** -4.2 - 3.64 (1)
-Soissons/ Sana
Osijek 87.5*** 3.5 -14.5** *
-17.5*** -8.8* - 1.72 (1) Comple-mentary
Nova Gradiska 69.7*** 4.3 6.4*** - - - 3.59 (3)
-Number of heads per plant
Soissons/ Zitarka
Osijek 17.2*** 1.43*** -8.6*** -8.0*** -8.4*** - 0.63 (1) Comple-mentary
Nova Gradiska 5.0*** 0.73*** 1.8* 2.9*** 4.3** - 0.77 (1) Comple-mentary
Soissons/ Sana
Osijek 7.5*** 0.65*** 2.5** 1.4* - - 5.33 (2)
-Nova Gradiska 5.0*** 0.13 2.87** 2.67** 3.62* - 0.06 (1) Comple-mentary
Number of grains per spike of the longest culm
Soissons/ Zitarka
Osijek 50.6*** 0.19 4.8 7.8 22.5** - 0.17 (1)
-Nova Gradiska 49.1*** 0.62 6.75*** 3.81* - - 0.67 (2)
-Soissons/ Sana
Osijek 47.9*** 1.6* 14.2*** 12.8*** 10.9*** - 6.98 (2) Comple-mentary
Nova Gradiska 46.7*** 1.6 9.7*** 10.9*** - - 7.13 (2)
-Grain weight per spike of the longest culm
Soissons/ Zitarka
Osijek 2.7*** 0.11** -0.11 - - - 9.9 (3)
-Nova Gradiska 2.2*** 0.01 0.19*** - - - 3.72 (3)
-Soissons/ Sana
Osijek 1.9*** 0.17*** 1.04*** 0.81*** - - 3.16 (2)
-Nova Gradiska 1.2*** 0.07* 1.2*** 1.1*** 1.4*** - 0.001 (1) Comple-mentary
Grain yield per plant (g) Soissons/ Zitarka
Osijek 34.1*** 3.0*** -7.7* -16.7*** -37.0** *
-9.6*** (0) ** Comple-mentary
Nova Gradiska 11.0*** 2.8*** 2.6 3.2 4.6 - 3.39 (1)
-Soissons/ Sana
Osijek 11.3*** 0.58 10.9*** 6.5*** - - 5.44 (2)
-Nova Gradiska 11.2*** 0.89** 5.8*** 3.1** - - 6.33 (2)
-Single grain weight (mg) Soissons/ Zitarka
Osijek 43.8*** 1.99*** 0.74 1.2 - - 8.71 (2)
-Nova Gradiska 46.8*** 0.6** -3.5* -5.4*** -7.6** - 0.86 (1) Comple-mentary
Soissons/ Sana
Osijek 42.0*** 1.8*** 5.0* 2.3 -3.6 - 3.97 (1)
-Nova Gradiska 35.6*** 1.8** 3.3 3.8* 19.2** 4.3* (0) **
-1
df = degrees of freedom, calculated as the number of generations minus the number of estimated genetic parameters. * = statistically significant at p = 0.95.
The additive and dominance variance components es-timates were inconsistent between crosses and across the testing sites. The values of narrow-sense heritability (h2n)
varied depending on the testing site, crossing combination and trait analyzed. For the Soissons/Sana cross higher h2n
values were observed for all traits (except for single grain
weight) at the Nova Gradiska site, while for the Soissons/ Zitarka cross higher values were found for all traits (except for plant height) at the Osijek site. The h2nvalues for the
Soissons/Zitarka cross were highest for plant height, single grain weight and grain yield per plant, whilst for the Soissons/Sana cross the h2n values were highest for the
Table 4- Estimation of variance components and narrow-sense heritability (h2n) for some quantitative traits of the Soissons/Zitarka and Soissons/Sana
crosses at the Osijek and Nova Gradiska sites.
Quantitative trait data
Variance components Soissons/Zitarka cross Soissons/Sana cross
Osijek site Nova Gradiska site Osijek site Nova Gradiska site Plant height (cm)
Phenotypic variance 93.67 66.09 107.83 108.5 Environmental variance 36.47 18.06 49.53 20.1
Additive variance 57.2* 48.03 58.3 88.4
Dominance variance -17.8 -16.6 -49.1 -42.7
χ2(df)1 0.075 (3) ns2 2.89 (3) ns 1.828 (3) ns 15.47 (3) s3
Heritability (h2n) (%) 61 73 54 81
Number of heads per plant
Phenotypic variance 28.4 5.24 11.43 9.38
Environmental variance 6.78 4.76 9.29 3.962
Additive variance 21.6 0.48 2.137 5.42
Dominance variance -12.6 -0.494 -3.91 -2.437
χ2(df) 0.296 (3) ns 0.0684 (3) ns 1.518 (3) ns 1.344 (3) ns
Heritability (h2n) (%) 76 9 19 58
Number of grains per spike of the longest culm
Phenotypic variance 258.8 118.73 288.5 165.05 Environmental variance 79.43 81.65 90.5 0.252
Additive variance 179.4* 13.22 198.1* 164.8
Dominance variance -65.6 23.88* -96.7 -78.9
χ2(df) 0.147 (3) ns 0.0058 (3) ns 2.703 (3) ns 1.9395 (3) ns
Heritability (h2n) (%) 69 11 69 99.8
Grain weight per spike of the longest culm (g)
Phenotypic variance 0.843 0.2465 1.11 0.642
Environmental variance 0.232 0.1843 0.564 0.172
Additive variance 0.611 0.056 0.55* 0.47*
Dominance variance -0.264 0.006 -0.372 -0.218
χ2(df) 2.534 (3) ns 0.117 (3) ns 0.0274 (3) ns 1.096 (3) ns
Heritability (h2n) (%) 72 23 49 73
Grain yield per plant (g)
Phenotypic variance 179.7 28.7 103.28 45
Environmental variance 39.36 22.92 78.67 20.12
Additive variance 140.3* 5.79 24.61 24.88*
Dominance variance -75.3* -5.72 -54.48 -13.19*
χ2(df) 0.1689 (3) ns 0.569 (3) ns 0.127 (3) ns 0.01 (3) ns
Heritability (h2n) (%) 78 21 24 55
Single grain weight (mg)
Phenotypic variance 55.25 18.71 54.85 39.15
Environmental variance 15.66 9.11 21.45 16.66
Additive variance 39.59* 9.3 33.4* 22.49
Dominance variance -20.1 0.3 -16.6* -4.492
χ2(df) 2.934 (3) ns 1.863 (3) ns 0.0125 (3) ns 0.1398 (3) ns
Heritability (h2n) (%) 72 49.7 61 57
1df = degrees of freedom, calculated as the number of generations minus the number of estimated variance parameters. 2
ns = non-significantχ2test. 3
s = significantχ2test.
number of grains per spike of the longest culm, plant height and grain weight per spike of the longest culm.
Discussion
Although varying depending on the cross, experi-mental site and trait, in most cases the variation in the gen-eration means fitted a digenic epistatic model which indicated that improvement of the traits studied would be moderately difficulty as compared to the situation pertain-ing had an additive-dominance model (best from a breeders point of view) provided the best fit. These findings corre-spond with the results published by some other authors (Pawaret al., 1988; Singh and Singh, 1992; Misraet al., 1994; Singhet al., 1998) but not with those reported by Sawant and Jain (1985). This situation is even more com-plicated when dominance effects are more important than additive effects, as was the case in this experiment.
For grain yield per plant in the Soissons/Zitarka cross at the Osijek site and single grain weight in the Soissons/ Sana cross at the Nova Gradiska site none of the models ex-plained variation between generations, indicating more complex mechanisms of genetic control. Such a situation is the least favorable from a breeders point of view, suggest-ing that a revised selection strategy is needed for the early generations due to complexity of the gene effects occurring in these generations. These results are in accordance with reports published by other authors (e.g. Chatrtah et al., 1986; Srivastavaet al., 1992; Amawate and Behl, 1995, Kathiria and Sharma, 1996).
To identify whether a cause of the model failure is the presence of higher order interactions or linkage effects there further analyses needs to be carried out with enough generations to fit a full trigenic interaction and linkage model. In respect of epistatic effects, additive x additive fects were more important than dominant x dominant ef-fects and only complementary epistasis was observed.
This situation is more favorable than the presence of dominant x dominant effects and/or duplicate epistasis due to a greater chance of breeding success, and partially plains why heterosis was not as frequent as might be ex-pected from the fact that dominance effects were more important than additive effects. Snape (1987) pointed out that a very common situation, especially when analyzing yield and yield components, is to find that the additive ef-fect is small and non-significant while the dominance esti-mate is large and highly significant. Estiesti-mates of additive effects can be small due to a high degree of dispersion of in-creasing alleles between parents, and dominance can be small due to its bi-directional nature. This might explain why additive genetic component of variance (VA*) varied
greatly, although a clear-cut relationship between additive effects and additive genetic variance could not be detected. On the other hand, the negative and non-significant esti-mates of dominance variance (VD*) seen in our study could
have been due to sampling errors and/or the fact that basic
generations are inefficient when used for determining dom-inance variance.
The estimated values of narrow-sense heritability (h2n) varied for plant height (54-81%), number of heads per
plant (9-76%), number of grains per spike of the longest culm (11-99.8%), grain weight per spike of the longest culm (23-73%), grain yield per plant (21-78%) and single grain weight (49.7-72%) depending on the crossing combi-nation and testing site. These heritability values are in ac-cordance with those reported by other authors (Sidwell, 1978; Baric, 1996 and Drezner, 1996).
From a breeders point of view, the heritability esti-mates from both sites show that the Soissons/Zitarka cross has the greatest chance of genetic improvement in the num-ber of heads per plant, grain yield per plant and single grain weight, while the Soissons/Sana cross has the greatest chance of increase in the number of grains per spike and grain weight per spike of the longest culm. The higher h2n
values found at the Osijek site can be partially explained by the fact that the experimental field layout was rectangular at the Osijek site and square at the Nova Gradiska site. The es-timates of heritability suggest that it would be better to breed the Soissons/Zitarka cross at the Osijek site and the Soissons/Sana cross at the Nova Gradiska site, suggesting that success in a breeding program could be under the influ-ence of environment, even as regards specific genetic ef-fects. These results show that both the adequacy of certain modes of inheritance as well as the importance and signifi-cance of gene effects for a certain trait were dependent upon the particular cross and experimental site, stressing the importance of the appropriate selection of both parents and breeding site for the success of a program.
References
Amawate JS and Behl PN (1995) Genetical analysis of some quantitative components of yield in bread wheat. Indian Journal of Genetics 55:120-125.
Baric M (1996) Kombinacijska sposobnost i nasljednost nekih kvantitativnih svojstava psenice (Tr. aestivum L.). PhD the-sis, University of Zagreb, Zagreb.
Bartlett MS (1937) Some examples of statistical methods of re-search in agriculture and applied biology. J R Statist Soc Suppl 4:137-183.
Chatrtah R, Satija DR and Gupta VP (1986) Genetic analysis of grain yield in wheat. Indian Journal of Genetics 46:466-471. Drezner G (1996) Selekcija psenice (Tr.aestivum L.) u ranim
generacijama zavisno o kriterijima izbora. PhD thesis, Uni-versity of Zagreb, Osijek.
Hayman BI (1960) Maximum likelihood estimation of genetic components of variation. Biometrics 16:369-381.
Kathiria KB and Sharma RK (1996) Genetic analysis for earli-ness, plant height and kernel weight in two breadwheat crosses under normal and saline sodic soils. Indian Journal of Genetics 56:548-552.
Kearsey MJ and Pooni HS (1996) The genetical analysis of quan-titative traits. 1st edition. Chapman & Hall, London, 381 pp.
Lynch M and Walsh B (1998) Genetics and analysis of quantita-tive traits. Sinauer Associates, Inc., Sunderland, 980 pp. Mather K and Jinks JL (1982) Biometrical genetics. 3rd edition.
Chapman & Hall, London, 396 pp.
Misra SC, Rao VS, Dixit RN, Surve VD and Patil VP (1994) Ge-netic control of yield and its components in breadwheat. In-dian Journal of Genetics 54:77-82.
Pawar IS, Paroda RS and Singh S (1988) Gene effects for six met-ric traits in four spring wheat crosses. Indian Journal of Ge-netics 48:195-199.
SAS STAT Software 6.12. Release (1989-1996) Copyright (c) by SAS Institute Inc., Cary, NC, USA.
Sawant AR and Jain KB (1985) Gene action for certain quantita-tive characters in common wheat in optimal and suboptimal environments. Indian Journal of Genetics 45:376-384. Sidwell RJ, Smith EL and McNew RW (1978) Heritability and
genetic advance of selected agronomic traits in a winter cross. Cereal Research Communications 6(2):103-111.
Singh G, Nanda GS and Sohu VS (1998) Gene effects for grains per spike, grain weight and grains per spikelet in a set of nineteen crosses of wheat. Indian Journal of Genetics 58:83-89.
Singh RP and Singh S (1992) Estimation of genetic parameters through generation mean analysis in breadwheat. Indian Journal of Genetics 52:369-375.
Snape JW (1987) Conventional methods of genetic analysis in wheat. In: Lupton FGH (ed) Wheat breeding, its scientific basis. Chapman & Hall, London, New York, pp 109-128. Srivastava RB, Sharma SC and Yunus M (1992) Additive and
nonadditive gene effects for yield and yield components in two wheat crosses. Indian Journal of Genetics 52:297-301. Whalia DP, Tashi Dawa and Plaha P (1994) Genetics of yield
components in spring wheat. Cereal Research Communica-tion 22:185-186.