Albanian j. agric. sci. 2013;12 (4): 545-554 Agricultural University of Tirana
Correspondence: Majid Abdoli, Department of Agronomy and Plant Breeding, Faculty of Agriculture, Maragheh University, Maragheh, Iran; Email: [email protected];
(Accepted for publication 17 October 2013)
RESEARCH ARTICLE
(Open Access)
Evaluation of drought resistance of barley (
Hordeum vulgare
L.) cultivars
using agronomic characteristics and drought tolerance indices
MOHSEN SAEIDI1, MAJID ABDOLI2,3*, MANDANA AZHAND4, MARYAM KHAS-AMIRI4
1
Assistant Prof., Department of Agronomy and Plant Breeding, Campus of Agriculture and Natural Recourse, Razi University, Kermanshah, Iran.
2
Ph.D. Student in Crop Physiology, Department of Agronomy and Plant Breeding, Faculty of Agriculture, Maragheh University,
Maragheh, Iran. 3
Young Researchers and Elite Club, Zanjan Branch, Islamic Azad University, Zanjan, Iran.
4
Former M.Sc. Student in Agronomy, Department of Agronomy and Plant Breeding, Campus of Agriculture and Natural Recourse, Razi University, Kermanshah, Iran.
Abstract:
In order to determine the performance of barley under drought stress conditions and screening quantitative indices of drought tolerance, twelve barley (Hordeum vulgare L.) cultivars were tested in a split-plot arranged in a randomized complete blocks design with three replications under irrigated and post-anthesis water deficiency conditions. This study was carried out in the field research of campus of agriculture and natural resources, Razi university, Kermanshah state in the west of Iran during 2010-2011. The results showed that post anthesis water deficiency caused 22, 18.3, 5.9, 5.5 and 21.9 percent reduction in grain yield, biomass, thousand grain weight, number of grain per spike and number of spike per m2 in average respectively, but had no significant effect on harvest index. Mean comparisons showed that Nosrat cultivar with 838 g m-2 and Afzal cultivar with 392 g m-2, respectively had the highest and the lowest grain yield under non-stress condition. Under water stress environment Nosrat and Karoun cultivars with 696 and 656 g m-2 and also, Aras and Sahra cultivars with 322 and 327 g m-2, respectively had the highest and the lowest grain yield. The estimates of stress tolerance attributes indicated that the identification of drought-tolerant genotypes based on a single criterion was contradictory. For example, according to STI, GMP and MP cultivars Nosrat, Karoun and Sararud were the most, whereas Aras and Afzal cultivars the least relative tolerant genotypes. As to YI cultivars Nosrat, Karoun and Sararud were the most and Aras, Sahra and Afzal the least relative tolerant genotypes. According to YSI, SSPI, RDI and ATI indices selected the Sararud and Zarjo cultivars as the most relatively tolerant genotypes. DI selected the cultivars Sararud, Nosrat and Karoun as the best, while the cultivars Sahra, Aras and Reihan as the the worst relatively tolerant genotypes. Grain yield in stress condition was significantly and positively correlated with MP, GMP, STI, Harm, YI and DI. Also, grain yield in non-stress condition was significantly and positively correlated with MP, GMP, STI, Harm, YI, DI and ATI indicating that these criteria were more effective in identifying high yielding cultivars under different moisture conditions.
Keywords: Barley, Water deficiency, Agronomic characteristics, Drought tolerance indices.
Abbreviations: Grain Yield (Y), Biomass (B), Harvest Index (HI), Thousand Grain Weight (TKW), Number of Grain per Spike (NGPS), Number of Spike per m2 (NSPM), Potential Yield (Yp), Stress Yield (Ys), Stress Susceptibility Index (SSI), Stress Tolerance Index (STI), Geometric Mean Productivity (GMP), Tolerance (TOL), Mean Productivity (MP), Relative Drought Index (RDI), Yield Index (YI), Yield Stability Index (YSI), Drought Resistance Index (DI), Abiotic Tolerance Index (ATI) and Stress Susceptibility Percentage Index (SSPI).
1. Introduction
Barley (Hordeum vulgare L.) is grown as a commercial crop in one hundred countries and is one of the most important cereal crops in the world. Barley assumes the fourth position in total cereal production in the world after wheat, rice and maize [13]. Among all the factors limiting barley productivity, drought
remains the single most important factor affecting the world security and sustainability in agricultural production.
and/or lack of seedling establishment. Thus, conditions prepare for epidemic diseases, plant pests attack, physiological and biochemical changes. Even in cases of minor, injured and ultimately with reduction growth, damages yield [1]. So that, drought stress is the most significant environmental factor to impact on growth and yield of crops and it affects 40 to 60% of the world’s agricultural lands [8].
To evaluate response of plant genotypes to drought stress, some selection indices has been proposed based on a mathematical relation between stress and optimum conditions [9, 17]. Drought indices which provide a measure of drought based on loss of yield under drought condition in comparison to normal condition have been used for screening drought tolerant genotypes [31]. These indices are either based on drought resistance or susceptibility of genotypes [17]. Drought resistance is defined by Hall [24] as the relative yield of genotype compared to other genotypes subjected to the same drought stress [24]. Drought susceptibility of a genotype is often measured as a function of the reduction in yield under drought stress [5].
Breeding for drought resistance is complicated by the lack of fast, reproducible screening techniques and the inability to routinely create defined and repeatable water stress conditions when a large amount of genotypes can be evaluated efficiently [41]. Achieving a genetic increase in yield under these environments has been recognized to be a difficult challenge for plant breeders while progress in grain yield has been much higher in favourable environments [42]. Thus, drought indices which provide a measure of drought based on yield loss under drought condition in comparison to normal condition have been used for screening drought-tolerant genotypes [31].
Rosielle and Hamblin [43] defined stress tolerance (TOL) as the differences in yield between the stress and non-stress environments and mean productivity (MP) as the average yield under stress and non-stress environments. Fischer and Maurer [18] proposed a stress susceptibility index (SSI) of the cultivars. Fernandez [17] defined a new advanced index (STI), which can be used to identify genotypes that produce high yield under both stress and non-stress conditions. Other yield based estimates of drought resistance are geometric mean (GM), MP and TOL. The Geometric mean is often used by breeders interested in relative performance since drought stress can vary in severity in field environment over years [41].
Fischer and Wood [19] introduced another index as relative drought index (RDI). Bidinger et al. [4] suggested drought response index (DRI) with its positive values indicating stress tolerance. Other yield based estimates of drought resistance are yield index (YI) [20] and yield stability index (YSI) [7].
Yield stability index (YSI) also was computed and suggested by Bouslama and Schapaugh [7]. This parameter is calculated for a given genotype using grain yield under stressed relative to its grain yield under non-stressed conditions. The genotypes with high YSI is expected to have high yield under stressed and low yield under non-stressed conditions [32]. In present study, drought tolerance in twelve genotypes of barley was investigated under post-anthesis drought stress conditions based on drought tolerance indices.
2. Materials and Methods
2.1. Plant material and treatments
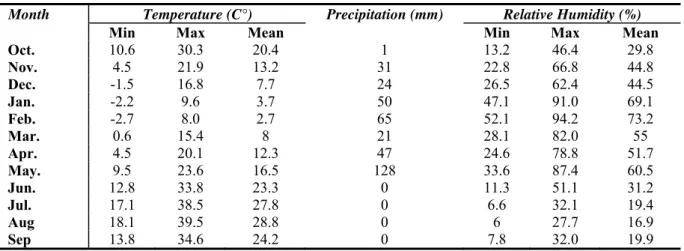
This research carried out during 2010-2011 in the field research of campus of agriculture and natural resources, Razi university, Kermanshah state in the west of Iran (34º 20' N latitude, 47º 20' E longitude, elevation 1351 m above see level) in the moderate-cold and semi arid zone. he soil was a clay loam (36.1% clay, 30.7% silt) and the experiment was laid out in a split-plot arranged in a randomized complete blocks design with three replications. Two levels of moisture regimes (includes: irrigation in all stages of plant growth normally and post anthesis water deficiency with withholding of irrigation) as the main-plot and different improved cultivars (includes: Aras, Afzal, Jonub, Reihan, Zarjo, Sararud, Sahra, Fajr-30, Karoun, Gorgan-4, Makuei and Nosrat) as sub-plot were considered. Date of anthesis was determined from middle rows in each plot when 50% of the spikes had extruded anthers [12]. Seeds were sown at a density of 400 seeds m-2 on 12th October. Humidity and moderate temperatures during the crop season is presented in Table 1.
2.2. Grain yield and some agronomic traits
Evaluation of drought resistance of barley cultivars using agronomic characteristics and drought tolerance indices
Table 1. Minimum, maximum and mean of temperature and relative humidity also precipitation in the Kermanshah region in the west of Iran during 2010-2011.
Month Temperature (C°) Precipitation (mm) Relative Humidity (%)
Min Max Mean Min Max Mean
Oct. 10.6 30.3 20.4 1 13.2 46.4 29.8
Nov. 4.5 21.9 13.2 31 22.8 66.8 44.8
Dec. -1.5 16.8 7.7 24 26.5 62.4 44.5
Jan. -2.2 9.6 3.7 50 47.1 91.0 69.1
Feb. -2.7 8.0 2.7 65 52.1 94.2 73.2
Mar. 0.6 15.4 8 21 28.1 82.0 55
Apr. 4.5 20.1 12.3 47 24.6 78.8 51.7
May. 9.5 23.6 16.5 128 33.6 87.4 60.5
Jun. 12.8 33.8 23.3 0 11.3 51.1 31.2
Jul. 17.1 38.5 27.8 0 6.6 32.1 19.4
Aug 18.1 39.5 28.8 0 6 27.7 16.9
Sep 13.8 34.6 24.2 0 7.8 32.0 19.9
Table 2. Drought tolerance indices.
Fischer and Maurer [18]
SSI = [1− (Ys /Yp)]/SI
Stress Susceptibility Index
⎟⎟
⎠
⎞
⎜⎜
⎝
⎛
−
=
p
Y
s
Y
SI
1
Stress IndexRosielle and Hamblin [43]
TOL = Yp − Ys
Stress Tolerance
Rosielle and Hamblin [43]
2
Yp
Ys
MP
=
+
Mean Productivity
Fernandez [17]
Yp
Ys
GMP
=
×
Geometric Mean Productivity
Fernandez [17]
( )
2p
Y
Ys
Yp
Yp
s
Y
s
Y
Ys
p
Y
Yp
STI
=
×
×
=
×
Stress Tolerance Index
Kristin et al. [27]
Ys
Yp
Ys
Yp
HARM
+
×
=
2
(
)
Harmonic Mean
Fischer and Wood [19]
)
(
)
(
p
Y
s
Y
Yp
Ys
RDI
+
×
=
Relative Drought Index
Lin et al. [29]
p
Y
Ys
YI
=
Yield Index
Bouslama and Schapaugh [7]
Yp
Ys
YSI
=
Yield Stability Index
Lan [28]
( )
Y
s
Ys
Yp
Ys
DI
=
×
(
×
)
Drought Resistance Index
Moosavi et al. [34]
(
Y
p
Y
s
)
Yp
Ys
Ys
Yp
ATI
⎥
×
×
⎦
⎤
⎢
⎣
⎡
−
=
/
)
(
Abiotic Tolerance Index
Moosavi et al. [34]
(
)
100 ) ( 2 × − = p Y Ys Yp SSPIStress Susceptibility Percentage Index
Yp and Ys: Grain yield of each genotype under non-stress and stress conditions, respectively.
Ỹp and Ỹs: Mean grain yield of all genotypes under non-stress and stress conditions, respectively.
2.3. Drought resistance indices
In order to estimates the sensitivity and tolerance indices in post anthesis water stress in different improved wheat cultivars, the relationships that
proposed by Fischer and Maurer [18], Rosielle and Hamblin [43], Fernandez [17], Kristin et al. [27], Lin
et al. [29], Lan [28], Moosavi et al. [34], Fischer and Wood [19] and Bouslama and Schapaugh [7] were used. These indices are includes (Table 2).
Saeidi et al
2.4. Statistical analysis
Statistical analyses were performed using MSTATC and SAS softwares. Mean comparisons were also performed using LSD at 5% level.
3. Result and Discussion
3.1. Effects of post-anthesis water deficiency on agronomic traits
The results obtained from mean comparison analysis of grain yield and its components are shown in Table 2. showed that post anthesis water deficiency stress caused 22, 18.3, 5.9, 5.5 and 21.9% reduction in grain yield, biomass, thousand grain weight, number of grain per spike and number of spike per m2 in average respectively, but had no significant effect on harvest index. The averages of grain yield, biological weight (dry matter weight) and thousand grain weight of different cultivars in well watered condition were 613 g m-2, 1660 g m-2 and 41.1 g respectively, while under water deficiency stress these values significantly reduced to 478 g m-2, 1356 g m-2 and 38.7 g. Gupta et
al. [22] evaluated two spring wheat cultivars, Kalyansona and C-306, for yield and yield attributes and noted that water stress caused significant reduction in plant height, leaf area, number of grain per spike, test weight and yield.
The results showed that there were significant differences among genotypes in respect to grain yield under non-stress condition. Also, significant differences were observed among genotypes under stress condition (Table 3). These results demonstrate high diversity among genotypes that enable us to select genotypes under non-stress and stress environments. Grain yield of main spike of wheat genotypes is significantly affected due to severe water stress. Mean comparisons showed that Nosrat cultivar with 838 g m
-2
and Afzal cultivar with 392 g m-2, respectively had the highest and the lowest grain yield under non-stress condition (Table 3). Under water stress environment Nosrat and Karoun cultivars with 696 and 656 g m-2 and also, Aras and Sahra cultivars with 322 and 327 g m-2, respectively had the highest and the lowest grain yield. Blum and Pnuel [6] reported that the final grain yield and its associated traits of bread wheat were significantly decreased due to water stress. Reduction in grain weight of wheat was also reported by various other researchers [1, 2, 36]. Kar et al. [25] observed that under water deficit condition, supplemental irrigation during reproductive phases had a significant effect on increasing seed yield. Water stress at
flowering negatively influenced the formation of grain, seed size, resulting in lower final grain yield.
At normal irrigation, comparison of means among all genotypes under study showed significan differences with each other. The highest (48.8 and 48 g) thousand grain weight was noted in Sararud and Gorgan-4 cultivars and lowest (36.3 g) was in Fajr-30 (Table 3). Post-anthesis water stress reduced thousand grain weight of all genotypes. In term of the thousand grain weight under water stress condition, Sararud cultivar had the highest (44.5 g) and Fajr-30 cultivar had the lowest values (33.7 g). The results of this conform to the findings of Karim et al. [26] and Baque
et al. [3] who reporteds that water stress reduced grain yield by reducing productive tillers per plant, fertile spikelet per plant, number of grains per plant and individual grain weight.
Water stress at anthesis caused significant effect on yield traits and cultivars also showed significant variability for grain spike-1, grain yield per plant, biological weight (dry matter weight) and harvest index. In term of the harvest index under well water condition, Nosrat and Fajr-30 cultivars had the highest (42.1%) and Afzal cultivar had the lowest values (25.3%). But, under post anthesis water deficiency stress Sararud and Fajr-30 cultivars had the highest (42.3 and 41.4%, respectively) and Aras cultivar lowest (27.7%) values (Table 3).
Mean comparisons showed that Karoun cultivar with 2230 g m-2 and also, Aras and Reihan cultivars (1350 and 1380 g m-2), respectively had the highest and the lowest biological yield under well water condition (Table 3). Under water stress environment Karoun cultivar with 1880 g m-2 and Sahra cultivar with 1020 g m-2, respectively had the highest and the lowest biological yields.
Evaluation of drought resistance of barley cultivars using agronomic characteristics and drought tolerance indices
In term of the number of spike per m2 under non-stress condition, Sararud and Gorgan-4 cultivars had the highest (701 and 686 spike m-2, respectively) and Sahra cultivar had the lowest values (383 spike m-2). Under post anthesis water deficiency stress Sararud and Sahra cultivars had the highest (607 spike m-2) and lowest (262 spike m-2) values. The effects of water stresses during various growth stages on various morphological traits such as tillers, number of spike per m2, number of grain per spike, thousand grain weight, spike weight and grain weight per spike, have also been reported in wheat by several researchers [37, 39, 42].
In well water and water deficiency conditions a correlation was found between grain yield and the biomass, harvest index and number of spike per m-2 (Table 6). Also, in well water and water stress conditions a negative correlation was found between thousand grain weight and the number of grain per spike (Table 6). The findings of the current study are consistent with those of Moral et al. [35] who found that also negative correlation between these two traits. They concluded that this negative correlation is related to compensation effect of yield components on each other. In this situation, by increasing the number of grain per spike, plants can not fill all of them and then this is caused shrinking of grains and finally caused weight loss of the grains.
3.2. Assessment of drought resistance indices
Data concerning yield (Yp and Ys ) and indices are given in Table 4. The estimates of stress tolerance attributes (Table 4) indicated that the identification of drought-tolerant genotypes based on a single criterion was contradictory. For example, according to STI, GMP and MP cultivars Nosrat, Karoun and Sararud were the most, whereas Aras and Afzal cultivars the least relative tolerant genotypes. For TOL and SSI the desirable drought tolerant genotypes were Sararud, Afzal and Zarjo. As to YI cultivars Nosrat, Karoun and Sararud were the most and Aras, Sahra and Afzal the least relative tolerant genotypes (Table 4). According to YSI, SSPI, RDI and ATI indices selected the Sararud and Zarjo cultivars as the most relatively tolerant genotypes. DI selected the Sararud, Nosrat and Karoun cultivars as the best, while the Sahra, Aras and Reihan cultivars as the the worst relatively tolerant genotypes. Majidi et al. [30] reported that GMP, STI and HM indices were similarly able to separate drought sensitive and tolerant genotypes of safflower in both mild and intense water stress environments. Talebi et al. [44] also reported that cultivars producing high yield in both drought and well watered conditions
can be identified by STI, GMP and MP values. Pireivatlou et al. [38] was also noted that STI can be a reliable index for selecting high yielding cultivars.
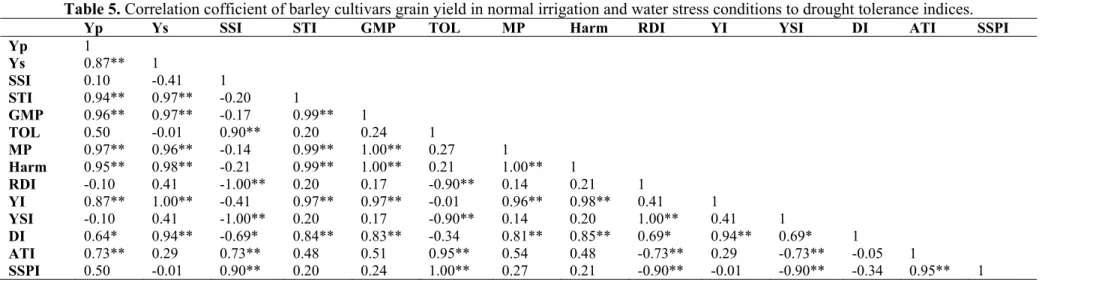
Yield in stress (Ys) condition was significantly and positively correlated with MP, GMP, STI, Harm, YI and DI. Yield in non-stress (Yp) condition was significantly and positively correlated with MP, GMP, STI, Harm, YI, DI and ATI indicating that these criteria were more effective in identifying high yielding cultivars under different moisture conditions (Table 5). Farshadfar et al. [15] reported that the results under both stress environments indicated positive and significant correlations between Yp with TOL, MP, GMP, STI, YI, DI, K1STI, K2STI, ATI and
SSPI selection indices. Also, Majidi et al. [30] reported that the results under both stress environments indicated positive and significant correlations between Yp with TOL, MP, GMP, STI, SSI and HM selection indices. They reported that correlations between YS with GMP, STI, and HM indicated that selection based on these indices may increase yield in stress and non-stress conditions. Mollasadeghi [33] in a study evaluating 12 bread wheat genotypes concluded that the indices MP, GMP, STI and MSTI having the highest correlation with grain yield under normal irrigation and water stress conditions were introduced as superior indices.
Farshadfar et al. [16] believed that most appropriate index for selecting stress-tolerant cultivars is an index which has partly high correlation with grain yield under stress and non-stress conditions. The observed relations were consistent with those reported by Fernandez [17] in mungbean, Farshadfar and Sutka [14] in maize, Golabadi et al. [21] in durum wheat and Abdoli and Saeidi [1] in wheat.
Ramirez and Kelly [41] reported that selection based on a combination of both SSI and GM indices may provide a more desirable criterion for improving drought resistance in common beans. Guttieri et al. [23], using SSI criterion in spring wheat, suggested that more than 1 unit of SSI value may indicate above-average susceptibility for drought stress and less than one unit has below-average susceptibility. Golabadi et
Table 4. Evaluation of barley cultivars based on drought tolerances (TOL, STI, SSI, GMP, MP, Harm, RDI, YI, YSI, DI, ATI and SSPI) indices. Cultivars (g mYp -2) (g mYs -2) SSI STI GMP TOL MP Harm RDI YI YSI DI ATI SSPI
Aras 413.2 321.9 1.006 0.354 364.7 91.4 367.5 361.9 0.998 0.673 0.779 0.524 25994.4 7.5
Afzal 391.9 339.3 0.611 0.354 364.7 52.6 365.6 363.7 1.110 0.709 0.866 0.614 14971.6 4.3
Jonub 748.4 489.2 1.576 0.974 605.1 259.2 618.8 591.6 0.838 1.023 0.654 0.669 122345.1 21.1
Reihan 489.8 363.4 1.175 0.474 421.9 126.4 426.6 417.2 0.951 0.760 0.742 0.564 41616.6 10.3
Zarjo 547.7 493.2 0.452 0.719 519.7 54.4 520.4 519.0 1.154 1.031 0.901 0.929 22072.4 4.4
Sararud 658.9 630.0 0.200 1.105 644.3 28.9 644.4 644.1 1.225 1.317 0.956 1.259 14523.3 2.4
Sahra 472.9 326.8 1.407 0.411 393.1 146.2 399.9 386.5 0.885 0.683 0.691 0.472 44837.9 11.9
Fajr-30 610.8 476.2 1.003 0.774 539.3 134.6 543.5 535.2 0.999 0.996 0.780 0.776 56629.9 11.0
Karoun 777.7 656.1 0.712 1.358 714.3 121.7 716.9 711.7 1.081 1.372 0.844 1.157 67811.5 9.9
Gorgan-4 707.0 458.3 1.601 0.862 569.2 248.7 582.6 556.1 0.831 0.958 0.648 0.621 110443.1 20.3
Makuei 699.0 488.9 1.368 0.909 584.6 210.1 593.9 575.3 0.896 1.022 0.699 0.715 95843.6 17.1
Nosrat 838.3 695.9 0.773 1.552 763.8 142.4 767.1 760.5 1.064 1.455 0.830 1.208 84874.6 11.6
Mean 613.0 478.3 0.990 0.821 540.4 134.7 545.6 535.2 1.003 1.000 0.782 0.792 58497.0 11.0 Yp: Potential Yield, Ys: Stress Yield , SSI: Stress Su sceptibility Index, STI: Stress To lerance Index, GMP: Geo metric Mean Productivity, TOL: To lerance, MP: Mean Productivity, RDI: Relative Drought Index, YI: Yield Index, YSI: Yield Stability Index, DI: Drought Resistance Index, ATI: Abiotic Tolerance Index and SSPI: Stress
Susceptibility Percentage Index.
Table 5. Correlation cofficient of barley cultivars grain yield in normal irrigation and water stress conditions to drought tolerance indices.
Yp Ys SSI STI GMP TOL MP Harm RDI YI YSI DI ATI SSPI
Yp 1
Ys 0.87** 1
SSI 0.10 -0.41 1
STI 0.94** 0.97** -0.20 1
GMP 0.96** 0.97** -0.17 0.99** 1
TOL 0.50 -0.01 0.90** 0.20 0.24 1
MP 0.97** 0.96** -0.14 0.99** 1.00** 0.27 1
Harm 0.95** 0.98** -0.21 0.99** 1.00** 0.21 1.00** 1
RDI -0.10 0.41 -1.00** 0.20 0.17 -0.90** 0.14 0.21 1
YI 0.87** 1.00** -0.41 0.97** 0.97** -0.01 0.96** 0.98** 0.41 1
YSI -0.10 0.41 -1.00** 0.20 0.17 -0.90** 0.14 0.20 1.00** 0.41 1
DI 0.64* 0.94** -0.69* 0.84** 0.83** -0.34 0.81** 0.85** 0.69* 0.94** 0.69* 1
ATI 0.73** 0.29 0.73** 0.48 0.51 0.95** 0.54 0.48 -0.73** 0.29 -0.73** -0.05 1
SSPI 0.50 -0.01 0.90** 0.20 0.24 1.00** 0.27 0.21 -0.90** -0.01 -0.90** -0.34 0.95** 1 * and **: Significant at the 5 and 1 percent levels, respectively.
Saeidi et al
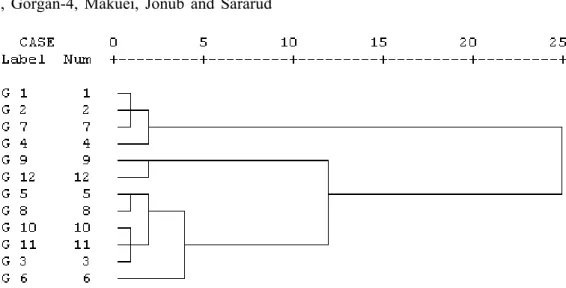
3.3. Cluster analysis
Cluster analysis using cluster analysis with UPGMA and based on drought tolerance criteria (Figure 1), the cultivars classified in three groups. Group 1 (drought tolerance) consisted of Karoun and Nosrat cultivars, group 2 (semi-resistance) included Zarjo, Fajr-30, Gorgan-4, Makuei, Jonub and Sararud
cultivars and group 3 (drought sensitive) discriminated Aras, Afzal, Sahra and Reihan cultivars. As group 1 an 3 showed maximum between group variance, therefore they are recommended for the genetic analysis using diallel or scaling test and QTLs mapping of drought tolerance indices.
Figure 1. Dandogram resulted from cluster analysis based on drought tolerance indicators (GMP, MP, Harm, STI, YI and DI). Aras (G1), Afzal (G2), Jonub (G3), Reihan (G4), Zarjo (G5), Sararud (G6), Sahra (G7), Fajr-30
(G8), Karoun (G9), Gorgan-4 (G10), Makuei (G11) and Nosrat (G12).
Table 6. Correlation coefficients among grain yield and some agronomic traits in barley cultivars under post anthesis water deficiency.
Parameters Condition Y B HI TKW NGPS NSPM
Y Well water 1
Water deficiency 1
B Well water 0.85** 1
Water deficiency 0.92** 1
HI Well water 0.76** 0.30 1
Water deficiency 0.71* 0.38 1
TKW Well water -0.06 -0.10 0.02 1
Water deficiency -0.10 -0.23 0.12 1
NGPS Well water 0.32 0.30 0.22 -0.69* 1
Water deficiency 0.17 0.26 0.01 -0.64* 1
NSPM Well water 0.70* 0.64* 0.47 0.14 -0.29 1
Water deficiency 0.71** 0.67* 0.48 -0.02 -0.37 1
Y: Grain Yield (g m-2), B: Biomass (g m-2), HI: Harvest Index (%), TKW: Thousand Grain Weight (g), NGPS: Number of Grain per Spike and NSPM: Number of Spike per m2.
* and **: Significant at the 5 and 1 percent levels, respectively.
4. Conclusion
The newly evolved genotypes indicated some genetic improvement as they possess tolerance to water stress conditions and could produce high grain yield with less availability of water. Some cultivars have potential to produce better yield with less irrigation. This information will be helpful for wheat breeders in improving drought tolerance. The selected material will be utilised in hybridization programme to create new genetic variability. Also, based on this concept
Evaluation of drought resistance of barley cultivars using agronomic characteristics and drought tolerance indices
5. Acknowledgments
The authors would like to thank their colleagues in Agricultural and Natural Resource, University of Razi, Kermanshah, Iran.
6. References
1. Abdoli M, Saeidi M: Using different indices for selection of resistant w heat cultivars to post anthesis water deficit in the west of Iran.Annals of Biological Research 2012, 3: 1322-1333. 2. Anjum SA, Wang LC, Farooq M, Hussain M, Xue
LL, Zou CM: Brassinolide application improves the drought tolerance in mai ze through modulation of en zymatic antioxidants and leaf gas exchange. Journal of Agronomy and Cro p Science 2011, 197(3): 177-185.
3. Baque MDA, Karim MDA, Hamid A, Tetsush H: Effects of fe rtilizer potassium on gr owth, yield and nutrient uptake of wheat ( Triticum
aestivum) under water stress conditions. South
Pacific Stud 2006, 27: 25-35.
4. Bidinger FR, Mahalakshmi V, Rao GDP: Assessment of drought resistance in millet
Factors effecting yields under stress. Australian Journal of Agriculture Research 1978, 38: 37-48. 5. Blum A: Plant breeding for stress environments.
CRC Press, Florida 1988, 212 pp.
6. Blum A, Pnuel Y: Physiological attributes associated with drought resistanc e on wheat cultivars in a Medite rranean environment.
Australian Journal of Agriculture Res earch 1990, 41: 799-810.
7. Bouslama M, Schapaugh WT: Stress tolerance in soybean. Part 1. Evaluation of three screening techniques for heat and drought tolerance.Crop Science 1984, 24: 933-937.
8. Bray EA: Molecular response to wa ter deficit.
Plant Physiology 1993, 1035-1040.
9. Clarke JM, De-Pauw RM, Townley-Smith TM: Evaluation of methods for quantification of drought tolerance in wh eat. Crop Science 1992, 32: 728-732.
10. Dencic S, Kastori R, Kobiljski B, Duggan B: Evaluation of grain yield and its co mponents in wheat cultivars and landraces under near optimal and drought conditions.Euphytica 2000, 113: 43-52.
11. Edward D, Wright D: The effects of winter water-logging and summ er drought on the growth and yield of winter wheat ( Triticum
aestivum L.). European Journal of Agronomy
2008, 28: 234-244.
12. Ehdaie B, Alloush GA, Madore MA, Waines JG: Genotypic variation for ste m reserves and mobilization in wheat: I I. Postanthesis changes in internode water-soluble carbohydrate. Crop Science 2006 b, 46: 2093-2103.
13. F.A.O: Stattistical database. Available online: Http// www. FAO. Org. 2004.
14. Farshadfar E, Sutka J: Screening drought tolerance criteria in maiz e. Acta Agronomica Hungarica 2002, 50(4): 411-416.
15. Farshadfar E, Jamshidi B, Aghaee M: Biplot analysis of drought tolerance indicators in bread wheat lanraces of Iran. International Journal of Agriculture and Crop Sciences 2012, 4(5): 226-233.
16. Farshadfar E, Zamani M, Matlabi M, Emam-Jome E: Selection for drought resistance in chickpea lines. International Journal of Agric ulture and Crop Sciences 2001, 32(1): 65-77.
17. Fernandez GCJ: Effective selection criteria for assessing stress tolerance. In: Proceedings of the international symposium on ad aptation of vegetables and other food Crops in t emperature and water stress. (Eds): Kuo, C.G. Public Tainan Taiwan 1992, 257-270.
18. Fischer RA, Maurer R: Drought resistance in spring wheat cultivars: I. Grain yield responses.
Australian Journal of Agriculture Res earch 1978, 29: 897-912.
19. Fischer RA, Wood JT: Drought resistance in spring wheat cultivars III Yield association with morpho-physiological traits. Australian Journal of Agriculture Research 1979, 30: 1001-1020. 20. Gavuzzi P, Rizza F, Palumbo M, Campaline RG,
Ricciardi GL, Borghi B: Evaluation of field and laboratory predictors of drought and hea t tolerance in winter cereals.Canadian Journal of Plant Science 1997, 77: 523-531.
21. Golabadi M, Arzani A, Maibody SAM:
Assessment of drought tolerance in s egregating populations in durum wheat. African Journal of Agriculture Research 2006, 1: 162-171.
22. Gupta NK, Gupta S, Kumar A: Effect of water stress on p hysiological attributes and their relationship with growth and yield of wheat cultivars at different stages. Journal of Agronomy and Crop Science 2001, 186: 55-62. 23. Guttieri MJ, Stark JC, Brien KO, Souza E:
Saeidi et al
and quality parameters to moisture deficit.Crop Science 2001, 41: 327-335.
24. Hall AE: Is dehydration tolerance relevant to genotypic differences in leaf senesc es and cop adaptation to dry env ironments?. In: Plant
responses to cellular dehydration during environmental stress. (Eds.): Close, T.J. and Bray, E.A. 1993, 1-10 pp.
25. Kar G, Kumar A, Martha M: Water use efficiency and crop c oefficients of dry seaso n oil seed crops.Agricultural Water Management 2007, 87: 73-82.
26. Karim MA, Hamid A, Rahman S: Grain growth and yield performa nce of wheat under subtropical conditions: II. Effect of water stress at reproductive stage. Cereal Research Communications 2000, 28: 101-107.
27. Kristin AS, Senra RR, Perez FI, Enriquez BC, Gallegos JAA, Vallego PR, Wassimi N, Kelley JD: Improving common bea n performance under drought stress. Crop Science 1997, 37: 43-50. 28. Lan J: Comparison of evaluatin g methods for
agronomic drought resistance in crops. Acta Agriculture Bor-occid Sinic 1998, 7: 85-87.
29. Lin CS, Binns MR, Lefkovitch LP: Stability analysis: where do w e stand?. Crop Science
1986, 26: 894-900.
30. Majidi M, Tavakoli V, Mirlohi A, Sabzalian MR: Wild safflower species (Carthamus oxyacanthus Bieb.): A possible sourc e of drought tolerance for arid en vironments. Australian Journal o f Crop Science 2011, 5(8): 1055-1063.
31. Mitra J: Genetics and genetic improvement o f drought resistance in crop plants. Current Science 2001, 80: 758-762.
32. Mohammadi R, Armion M, Kahrizi D, Amri A: Efficiency of scre ening techniques for evaluating durum wheat genotypes under mild drought conditions. International Journal of Plant Production 2010, 4(1): 1735-8043.
33. Mollasadeghi V: Effect of potassium humate on yield and yield com ponents of wheat genotypes under end seasonal drought stress condition. Thesis of M.Sc in plant breeding. Islamic Azad University, Ardabil branch. Iran. 2010.
34. Moosavi SS, Yazdi-Samadi B, Naghavi MR, Zali AA, Dashti H, Pourshahbazi A: Introduction of
new indices to ident ify relative drought tolerance and resistanc e in wheat genotypes.
Desert 2008, 12: 165-178.
35. Moral GLF, Rharrabti Y, Villegas D, Royo C: Evaluation of grain yield and its co mponents in durum wheat under mediterranean conditions: an ontogenic approach. Journal of Agronomy
2002, 95: 266-274.
36. Nasri M: Interaction of nutrient ele ments and drought stress in cultivars of Brassi ca napus.
The second international conference o n integrated approaches to sustai n and improve plant production under drought stress. Rome, Italy, September 24-28. 2005, 109 pp.
37. Noorka IR, Rehman SU, Haidry JR, Khaliq I, Tabassum S, Din GM: Effect of wate r stress on physico-chemical properties of wh eat (Triticum
aestivum L.). Pakistan Journal o f Botany 2009,
41(6): 2917-2924.
38. Pireivatlou AS, Masjedlou BD, Aliyev RT: Evaluation of yield potential and stress adaptive trait in wheat genotype s under post anthesis drought stress conditio ns. African Journal of Agriculture Research 2010, 5: 2829-2836.
39. Plaut Z, Butow BJ, Blumenthal CS, Wrigley CW: Transport of dry m atter into developing wheat kernels. Field Crops Research 2004, 96: 185-198. 40. Pourdad SS: Study of drought resista nce indices
in spring safflower. Acta Agronomica Hungarica
2008, 56: 203-212.
41. Ramirez P, Kelly JD: Traits related to drought resistance in common be an. Euphytica 1998, 99: 127-136.
42. Richards RA, Condon AG, Rebetzke GJ: Traits to improve yield in dry environ ments. In:
Application of Physiology in Wheat Breeding.
(Eds): Reynolds, M.P. Ortiz Monasterio, J.I. and McNab, A. Mexico, CIMMYT. 2001, 88-100 pp.
43. Rosielle AA, Hamblin J: Theoretical aspects of selection for yield in stres s and non-stress environments. Crop Science 1981, 21(6): 943-946.