www.atmos-chem-phys.net/10/8855/2010/ doi:10.5194/acp-10-8855-2010
© Author(s) 2010. CC Attribution 3.0 License.
Chemistry
and Physics
The invigoration of deep convective clouds over the Atlantic: aerosol
effect, meteorology or retrieval artifact?
I. Koren1, G. Feingold2, and L. A. Remer3
1Department of Environmental Science and Energy Research, Weizmann Institute of Science, Rehovot, Israel 2NOAA Earth System Research Laboratory, Boulder CO, USA
3Laboratory for Atmospheres, NASA Goddard Space Flight Center, Greenbelt MD, USA Received: 11 January 2010 – Published in Atmos. Chem. Phys. Discuss.: 10 February 2010 Revised: 1 September 2010 – Accepted: 2 September 2010 – Published: 20 September 2010
Abstract. Associations between cloud properties and
aerosol loading are frequently observed in products derived from satellite measurements. These observed trends between clouds and aerosol optical depth suggest aerosol modifica-tion of cloud dynamics, yet there are uncertainties involved in satellite retrievals that have the potential to lead to incorrect conclusions. Two of the most challenging problems are ad-dressed here: the potential for retrieved aerosol optical depth to be cloud-contaminated, and as a result, artificially corre-lated with cloud parameters; and the potential for correla-tions between aerosol and cloud parameters to be erroneously considered to be causal. Here these issues are tackled directly by studying the effects of the aerosol on convective clouds in the tropical Atlantic Ocean using satellite remote sensing, a chemical transport model, and a reanalysis of meteorological fields. Results show that there is a robust positive correlation between cloud fraction or cloud top height and the aerosol optical depth, regardless of whether a stringent filtering of aerosol measurements in the vicinity of clouds is applied, or not. These same positive correlations emerge when re-placing the observed aerosol field with that derived from a chemical transport model. Model-reanalysis data is used to address the causality question by providing meteorological context for the satellite observations. A correlation exercise between the full suite of meteorological fields derived from model reanalysis and satellite-derived cloud fields shows that observed cloud top height and cloud fraction correlate best with model pressure updraft velocity and relative humidity. Observed aerosol optical depth does correlate with meteo-rological parameters but usually different parameters from
Correspondence to:I. Koren (ilan.koren@weizmann.ac.il)
those that correlate with observed cloud fields. The result is a near-orthogonal influence of aerosol and meteorological fields on cloud top height and cloud fraction. The results strengthen the case that the aerosol does play a role in invig-orating convective clouds.
1 Introduction
Aerosol effects on clouds are recognized as contributing sub-stantially to anthropogenic effects on climate and the wa-ter cycle. Understanding the different cloud feedbacks initi-ated by changes in aerosol properties poses one of the great-est challenges in climate, cloud and precipitation physics and radiative transfer (Ramanathan et al., 2001, Kaufman et al., 2002). The strong sensitivity of the climate system to clouds, and the steadily increasing pressure on water re-sources, makes this a problem of major importance (IPCC, 2007).
But why are aerosol-cloud interactions so difficult to quan-tify? Some of the important aspects of this problem are enu-merated below:
radiative properties (Twomey, 1977) but also the ability of the cloud to precipitate (Albrecht, 1989; Rosenfeld et al. 1999; Andreae et al., 2004) and the pathways via which precipi-tation develops (e.g., Khain et al., 2001; Lee et al., 2008). Modification of precipitation influences the dynamics of the environment by changing the vertical distribution of latent heat. It has been suggested that clouds growing in polluted environments are characterized by more vigorous convection owing to a combination of suppression of early rainout of the cloud and its attendant stabilization, together with sup-pression of freezing, and the eventual release of latent heat at higher altitudes (Koren et al., 2005; Khain et al., 2005). Aerosol perturbations to deep convective systems may in-fluence secondary convection (Seifert et al., 2006; van den Heever and Cotton, 2007; Lee et al., 2008) and other dynami-cal responses that magnify the initial microphysidynami-cal perturba-tion. Conversely, the feedbacks sometimes exhibit multiple microphysical, dynamical and radiative effects that counter one another (Kaufman and Koren, 2006; Jiang and Feingold 2006; Koren et al 2008) and yield a relatively small overall effect. It has been suggested recently that aerosol-cloud in-teractions occur within a buffered system so that the response of the system to the aerosol is much smaller than might have been expected had internal interactions not been accounted for (Stevens and Feingold, 2009). The challenge is to identify geographical regions or distinct regimes where the aerosol effect is likely to be largest.
Measurement Uncertainties: Clouds are extremely in-homogeneous and form complex, three-dimensional (3-D) structures, making them difficult to characterize from in situ measurements and causing remote sensing retrievals to be a true challenge (Platnick et al., 2003). The aerosol may be more homogeneous than clouds, but its measureable signal is weak relative to the background and instrument noise (Tanr´e et al., 1996, 1997; Kahn et al., 2005). The challenge grows even larger when measuring aerosol properties in the vicin-ity of clouds. When attempting to study cloud-aerosol inter-actions from observations, we often ask for the impossible: on the one hand we strive to measure the aerosol as close as possible to clouds in order to reflect the relevant aerosol properties that interact with the cloud. On the other hand, we ask for very accurate measurements of aerosol loading and properties, which are very difficult to achieve in the vicinity of clouds, especially by satellite remote sensing.
The inter-cloud region, sometimes referred to as the “cloud twilight zone”, is usually considered cloud-free, but has been shown to comprise sheared cloud fragments, tiny growing or decaying clouds, and hydrated aerosol. Thus the aerosol measured in this region is significantly different from the aerosol far-removed from cloud fields (Koren et al., 2007; Charlson et al., 2007). This difference introduces a series of complexities in interpreting remotely sensed aerosol prop-erties near clouds. The likelihood of the remotely sensed aerosol properties being contaminated by a contribution from undetectable clouds (the abovementioned small clouds or
clouds with weak optical signature) decreases as a function of the distance from detectable clouds (Koren et al., 2008b, 2009). Moreover, aerosol particles may change their (true and apparent) optical properties near clouds as the humid-ity increases (Charlson et al., 2007, Twohy et al., 2009) and due to enhancement in the mean photon flux as a result of the clouds serving as secondary photon sources illuminating the cloud field from their edges (Marshak et al., 2006; Wen et al., 2007). All of the above effects: undetectable clouds, aerosol humidification and the 3-D cloud effects, yield an ap-parent larger Aerosol Optical Depth (AOD) measured from space, and interfere with properly characterizing the aerosol measured from ground-based remote sensing or even in situ measurements.
Causality: Even assuming that clouds and aerosol can be measured correctly, the last and the ultimate problem is the strong coupling of clouds and aerosols to meteorology (en-vironmental properties). Are the observed aerosol-cloud re-lationships a result of the aerosol effect on clouds or does meteorology drive the changes in both aerosol and clouds properties? Meteorological conditions control most of the cloud properties. Variables such as temperature, humidity, surface fluxes and winds largely determine the depth of con-vection and the size of clouds. The major challenge is to find the cloud response to perturbations in the aerosol properties buried beneath the significant natural variability due to mete-orology. Numerical models that simulate the same scenario and change only the aerosol properties are often used to es-tablish causality but it is difficult to generalize the results for different regimes. It is not always clear if the observed rela-tionships are applicable to a wide variety of meteorological regimes, requiring great effort to decouple basic meteorolog-ical properties (humidity and temperature) from aerosol ef-fects (Teller and Levin, 2008; Altaratz et al., 2008).
1.1 Aerosol effects on deep convective clouds
Deep convective clouds are manifestations of strong forcing in a potentially very unstable atmosphere. When changes in the aerosol properties affect microphysical processes they may modify the vertical distribution of condensate and en-ergy, and thus modify cloud development.
1.1.1 Aerosol induced invigoration of convective clouds
Several observational and modeling studies support the hy-pothesis that higher aerosol loading leads to invigoration of convective clouds (Andreae et al., 2004; Khain et al., 2008). More aerosol particles provide more cloud conden-sation nuclei (CCN). Larger concentrations of CCN result in more, and smaller cloud droplets with smaller size variance (Twomey, 1977) that are less likely to collide and coalesce, and more likely to be lofted higher in the cloud because their fall velocities are smaller. Conversely, clean aerosol condi-tions promote the formation of larger droplets that can over-come updrafts, collecting enough droplets to form precipita-tion and its attendant surface cooling, which acts to stabilize the atmosphere. Therefore, polluted clouds are less likely to form early (warm) precipitation (Gunn and Phillips 1957; Warner 1968) and the updrafts are more likely to carry the smaller drops upwards and higher into the atmosphere, re-sulting in taller clouds that last longer (Koren et al., 2005, Fan et al., 2009). Once the cloud passes the freezing level (supercooled water), a chain of events is ignited in the mixed-and cold-phases. Heterogeneous ice nucleation is less effi-cient for smaller droplets. Therefore, heterogeneous freez-ing (and in colder environments, homogeneous freezfreez-ing) is likely to take place higher in the atmosphere in a colder envi-ronment (Rosenfeld and Woodley, 2000). Less effective ice nucleation will further delay precipitation initiated by cold processes (Andreae et al., 2004). Thus it is thought that cold rain suppression may lead to longer cloud lifetime and larger cold cloud fraction (Koren et al., 2005, Lindsey and Fromm, 2008). Another positive feedback is expected to be initiated when the larger number of droplets (and larger net water mass) eventually freezes at colder temperatures releas-ing the latent heat at higher altitudes, enhancreleas-ing buoyancy, and therefore, again promoting stronger updrafts that loft the ice phase higher (Rosenfeld and Woodley, 2000, Jenkins and Pratt, 2008). Finally, the stronger evaporative cooling associated with aerosol-perturbed clouds results in stronger cold-pool development and more intense secondary convec-tion (Seifert et al., 2006; van den Heever and Cotton, 2007; Lee et al., 2008). The net result of this hypothesized chain of events is that higher concentrations of aerosol generate larger and taller convective clouds. The fact that microphysical and dynamical processes in convective clouds are so complex, and that systems cycle through multiple stages of convection begs the question: is there an imprint of the aerosol on the
macroscale features of clouds such as cloud top height and cloud fraction, and is it measureable with current tools?
Because of their global coverage and ability to observe literally millions of clouds in a variety of aerosol regimes, satellites provide a substantial source of data for testing the hypothesis of invigoration. Prior analyses of these data pro-vide epro-vidence in support of aerosol invigoration of convec-tive clouds (Devasthale et al., 2005; Koren et al., 2005, 2008; Meskhidze et al., 2009; Quaas et al., 2009). These studies identify correlative relationships between satellite-retrieved cloud and aerosol products that show cloud fraction and cloud-top-height systematically increasing as aerosol loading increases. The studies interpret these associations between variables as indicators of causality, and conclude that aerosol has a detectable influence on the strength of the convection.
This conclusion is often challenged because of two of the most difficult problems associated with satellite-based stud-ies of aerosol-cloud interaction: contamination of the re-trieved aerosol product (Yang et al., 2008; Tian et al., 2008; Loeb and Manalo-Smith 2005; Zhang et al., 2005; Kaufman et al., 2005a), and the case for causality (Matsui et al., 2006; Loeb and Schuster, 2008; Mauger and Norris, 2007; Stevens and Brenguier, 2009). We define “contamination” as any in-fluence on the retrieved AOD that would interfere with its ability to provide a robust proxy for CCN. “Proving causal-ity” implies separating the cloud response due to aerosol from the response due to natural meteorological factors. The cloud type of interest will be deep convective clouds, and specifically the ITCZ region of the tropical Atlantic.
Fig. 1.Three day mean MODIS-derived cloud optical depth (upper) and aerosol optical depth (lower) for the 10 degree box that defines the study area (yellow outline) and for a larger region of the tropical Atlantic for context. Three periods are shown. 1–3 July 2007 (left) showing dust intrusion into the study box from the north. 31 July–2 August 2007 (center) showing overall clean background conditions in the study
box and biomass burning aerosol near the African coast at 10◦S. 12–14 August 2007 (right) showing elevated aerosol arriving in the study
box from the south and east that originates from the African biomass burning.
1.2 The tropical Atlantic
The tropical Atlantic is chosen as the study location because the magnitude of aerosol transport into the region, and its in-teraction with the prevalent convective cloud systems therein, present one of the most challenging situations for interpre-tation of aerosol-cloud studies (Koren et al., 2005, 2010; Huang et al., 2009). The focused study area is defined by a latitude-longitude box of 0◦–10◦N and 20◦–30◦W. The study period is July–August 2007.
The Intertropical Convergence Zone (ITCZ) passes through this region during this time period. The main axis of the ITCZ rainband, as defined by the Global Precipi-tation Climate Project (GPCP) (Huffman et al., 1997) and the Tropical Rainfall Measurement Mission (TRMM) (Fisher 2004) falls around 8oN during July and August (Huang et
al., 2009). Seasonal mean rain rates in this band exceed 6±1.5 mm/day in our area during this time period (Huang et al., 2009). While time-averaged plots show the ITCZ as an uninterrupted zonal band across the Atlantic, the day-to-day picture is not uniform. The rain band is associated with deep convective elements, surrounded by thinner ice anvils (Ko-ren et al., 2010). Figure 1 shows examples of 3-day averages of MODIS-derived cloud optical depth that demonstrates the location and spatial variability of the ITCZ in the study box. The primary sources of variability of the Atlantic ITCZ con-vection are meteorology and surface conditions, including local sea surface temperature (Zebiak, 1993) and synoptic easterly waves (Burpee, 1975; Norquist et al., 1977; Died-hou et al., 1999). The synoptic waves, in particular, prop-agate from the African continent during the boreal summer,
both north and south of the African Easterly Jet that has its main axis at 15◦N in July (Cook, 1999) . The southern wing of these easterly waves introduces a 3–5 day periodicity in the pressure troughs and ridges in the area of interest, with deep convection and rainfall associated with the passing low pressure and midtropospheric rising motion (Diedhou et al., 1999).
upon a large particle background. The determination that the elevated aerosol in our study box has biomass burning origins arises from examination of the aerosol from a broader geo-graphical perspective and knowledge of the transport paths. See Fig. 1.
We have chosen this small region in the Atlantic because of the prevalence of deep convective clouds and because the periodic transport of the smoke aerosol provides a significant range of aerosol concentrations. Unlike the dust transport to the north, with its obvious connection to the dynamics of easterly waves and the dry Saharan Air Layer above the boundary layer, the aerosol in our study area has weaker and not uniform link to meteorological factors.
2 Methods
2.1 Analysis of aerosol-cloud interactions from satellite
observations
There is a solid body of scientific literature addressing aerosol-cloud interaction using satellites as the primary tool (Coakley Jr. et al., 1987; Kaufman and Nakajima, 1993; Kaufman and Fraser, 1997; Wetzel and Stowe, 1999; Naka-jima et al., 2001; Br´eon et al., 2002; Feingold et al., 2001; Koren et al., 2004, 2005; Kaufman et al., 2005a; Berg et al., 2008; L’Ecuyer et al., 2009). Before the year 2000 these studies were based mostly on AVHRR reflectances, but be-ginning in 2000, after the launch of the NASA Terra satellite, aerosol-cloud studies mostly switched to using the Earth Ob-serving System (EOS) satellite sensors including the MOD-erate resolution Imaging Spectroradiometer (MODIS) that flies on Terra and Aqua. Other EOS sensors have been used in these studies, as well, including the active sensors (lidar and radar) CALIOP and CloudSat. While the challenges we address here have universal application to a wide vari-ety of measurement-based studies of aerosol-cloud interac-tion, the current investigation and analysis focuses on the use of MODIS and MODIS-like imagers such as AVHRR that view the Earth in multiple channels from the visible through the near-infrared and out to the thermal infrared. These im-agers are onboard polar orbiting satellites that provide instan-taneous views of the aerosol cloud field at relatively coarse temporal resolution. MODIS views the Earth in 36 chan-nels from 0.41 µm to 14 µm at a variety of spatial resolutions (250 m, 500 m and 1000 m). Among the hundreds of prod-ucts derived from MODIS-measured radiances is a suite of aerosol products (Remer et al., 2005, Levy et al., 2007) and another set of cloud products (King et al., 2003, Platnick et al., 2003), including cloud optical depth, cloud top pressure and cloud fraction.
Often the AOD is used as a proxy for the cloud conden-sation nucleus (CCN) concentration (Andreae, 2009). The reliability of this proxy depends on the uniformity of the aerosol size, composition, vertical distribution, but may in
many cases be used as a first approximation. AOD is vided as a 10 km product, and the cloud products are pro-vided at either 5 km or 1 km resolution.
To study the interactions between aerosol and clouds from satellite observations, information on both is needed, for the same time and location. However, aerosol cannot be retrieved beneath clouds under cloudy conditions by most satellite sensors, and cannot be retrieved above clouds by MODIS. To solve such a problem the characteristic spatial scale of the aerosol field is assumed to be larger than the scale of a cloud so that it is sufficient to measure aerosols in the vicinity of clouds. Often the resolution is degraded so the grid square size covers a much larger area compared with the finest retrieval resolution, increasing the likelihood of infor-mation on clouds from the cloudy part and on aerosol from the cloud-free part within the larger grid square.
Grid squares with larger coverage are also useful for vari-ance reduction. Due to their high instability and the high level of energy involved, convective clouds exhibit large vari-ance in their physical properties. This adds great difficulty to the detection and estimation of aerosol impacts on such clouds. To reduce the complexity, datasets that average mil-lions of clouds are needed. To simplify the data handling and analysis and to reduce the variance, pixels with large spatial area (1 degree) are used (King et al., 2003). Although lower resolution increases the likelihood of having both significant cloud and aerosol information, it may suffer from unavoid-able mixing between cloud types, and increase the possibility of contamination.
2.2 Cloud contamination
The MODIS aerosol algorithm was designed to minimize cloud contamination by using a sensitive cloud detection al-gorithm (Martins et al., 2002; Gao et al., 2002). Furthermore, the aerosol algorithm removes inadvertent cloudy pixels and cloud shadows that escape the cloud mask by eliminating the darkest and brightest 25% of every cluster of 400 pixels af-ter all detectable clouds have been removed (Remer et al., 2005). Nevertheless it has been shown that the MODIS AOD retrievals may contain residual artifacts introduced by clouds (Kaufman et al., 2005d; Zhang et al., 2005), by 3-D effects near clouds (Marshak et al., 2006; Wen et al., 2007) and by physical changes to the “aerosol” in the vicinity of clouds (Tackett and Di Girolamo, 2009).
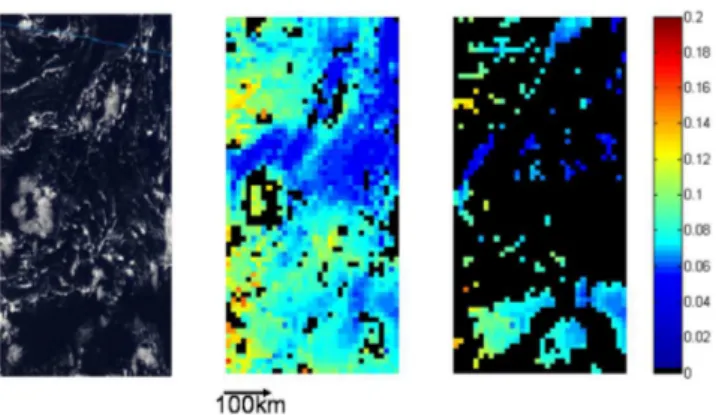
Fig. 2.Example of the consequences of removing MODIS aerosol retrievals collocated with more than 20% cloud fraction. Left – part of the 12 August 2007 MODIS visbile image over the Atlantic ITCZ. Center: the MODIS operational AOD retrieval for the scene. Right – the same retrieval after eliminating all AOD retrievals col-located with higher than 20% cloud fraction. Note how AOD re-trievals in the vicinity of any cloud are removed leaving only AOD in cloud-free islands.
2.2.1 Filtering AOD pixels with high cloud content
To estimate possible effects of cloud contamination on the aerosol retrieval we use collocated cloud and aerosol re-trievals in our study domain. Two aerosol data bases are cre-ated. The first is parallel to the operational MODIS product and is constructed from all MODIS Level 2, 10-km AOD retrievals, no matter how cloudy the original 10 km prod-uct. The second data base starts from the same initial 10 km aerosol retrievals, but includes only those retrievals that re-port less than 20% cloud fraction within the 10 km box. Pre-vious studies have suggested that the likelihood for cloud contamination or other biases in the retrieved AOD is pro-portional to the distance from detectable clouds (Koren et al., 2007). We note that the 20% cloud fraction cut-off corre-sponds to an average distance of 5 km between a pixel used by the AOD retrieval and an identified cloudy pixel. There is no guarantee that this procedure eliminates all possible cloud contamination, however most of the pixels likely to be cloud-contaminated are filtered out (Fig. 2). Other thresholds that range from 80% to 20% were tested and all showed simi-lar results. Here the results pertaining to the most stringent (20%) filter are shown. The 20% cutoff is therefore a conser-vative measure that should eliminate most, if not all, artificial relationships between retrieved AOD and retrieved cloud pa-rameters. However, such filtering while reducing cloud ef-fects on the aerosol retrieval can result in significant loss of useful data. Because the tropical sky is very cloudy such fil-tering results in a rejection of more than 40% of the 10-km aerosol retrievals and often a whole aerosol outbreak that is not necessarily cloud contaminated is rejected (Fig. 2).
The MODIS aerosol algorithm retrieves directly two aerosol parameters namely the AOD and the fine-fraction
(fraction of the optical thickness at 550 nm contributed by fine particles). Often, the fine-fraction information allows classification of aerosol types (Kaufman et al., 2005c). Cloud contamination in the aerosol retrievals is expected to de-crease the fine-fraction, by introducing larger particles in the form of cloud droplets and decreasing the Angstrom expo-nent. Figure 3 shows a scatter plot of the mean fine-fraction from each 1-degree×1-degree grid of the aerosol products subjected to the 20% cloud fraction cut-off plotted against the standard retrieval. The regression slope is 1.043 with an intersect of 0.0075, and a correlation ofR=0.91. The aver-age AOD and fine-fraction are 0.246 and 0.446, respectively, for the standard retrieval, and 0.227 and 0.473 for the strin-gently less cloudy data set. The data are also plotted as two-dimensional histograms in Fig. 3b and c. The effect of the stringent cloud clearing threshold is best seen in the wings of the histograms. Stringent cloud clearing increases the per-centage of data points reaching to the largest fine fractions, reduces substantially a lobe of points reaching to higher AOD at very low fine fraction and shifts the wing of highest AOD from fine fraction of 0.40 to the typical dust value of 0.50. All of these differences in the two-dimensional plots cou-pled with the differences in mean AOD and fine fraction are consistent with cloud contamination in the standard product. However, the main pattern of the two histograms are the same and consistent with a broad distribution of fine fraction at low AOD when the retrieval has the least sensitivity to parti-cle size and diluted continental-sourced aerosol overlays the background marine aerosol. The histograms also show the relatively rare dust events as an arm reaching to higher AOD at 0.50 fine fraction. We note the strong correlation between the data sets, the nearly 1:1 slope and small offset, despite the less cloudy data set losing 40% of the original retrievals, suggesting that the properties of the aerosol fine-fraction re-trieval are not strongly affected by the close proximity of clouds. The real question is not the relationship between the aerosol retrievals in the two data sets, but how the aerosol-cloud correlations differ when using either the standard or filtered data sets.
2.2.2 Selection of deep convective clouds
High resolution analysis of the cloud-top-pressure (CTP) height distribution over the study area (Fig. 4) suggests the existence of 3 cloud classes: Low boundary layer clouds with tops less than 850 hPa; Clouds of medium height – free tropospheric clouds with cloud-top height between 850 and 600 hPa; and high clouds with heights above 600 hPa. The data are analyzed first for all clouds and then only for high clouds.
The data are divided into four subsets:
Fig. 3. Left: Correlations between aerosol fine fraction ratio: the standard product (x-axis) and after applying a stringent 20% cloud fraction threshold to retain the least cloudy scenes (y-axis). Data
are aggregated at 1◦. Middle: 2-D normalized histogram (black =
zero, red = 1) of the AOD and fine fraction for the data before fil-tering AOD pixels with high cloud content. Right: 2-D normalized histogram (black = zero, red = 1) of the AOD and fine fraction for the data after filtering AOD pixels with high cloud content.
2. “All data filtered”: only those retrievals that were re-tained after the imposition of the 20% cloud fraction cut-off (at the 10 km pixel resolution) are aggregated into 1-degree grid squares.
3. “High only mode” – only those retrievals of clouds with CTP<600 hPa (high clouds) were averaged into the 1-degree resolution grid squares.
4. “High, filtered mode”: only those retrievals of clouds with CTP <600 hPa and cloud fraction <20% were gathered into the 1-degree resolution grid.
Each of the above datasets is further divided into 3 AOD lev-els of 0<AOD<0.15, 0.15<AOD<0.35 and 0.35<AOD<1. The levels were selected to represent clouds in relatively clean, moderately polluted and heavy aerosol conditions, with bins defined such that there are comparable numbers of samples in each one (∼103samples per bin).
3 Results
3.1 Correlations between MODIS-derived cloud top
pressure, cloud fraction and aerosol optical depth
The histograms as well as the mean of the CTP and cloud fraction (CFR) are calculated for each AOD subset and pre-sented in Fig. 5 for all clouds, and Fig. 6 for the high-only subset. Note that the CFR presented here is a stan-dard MODIS cloud product, produced independently from the aerosol algorithm using a separate set of MODIS chan-nels (Platnick et al., 2003). This means that the filtering of potentially cloud-contaminated aerosol products using a di-agnostic of the aerosol algorithm (Remer et al., 2005), does not affect the cloud fraction calculation.
Fig. 4. Distribution of cloud top heights over the study area con-structed from 5-km retrievals.
The all-data have higher cloud tops (lower CTP) and higher CFR than the data set subjected to the 20% cloud fraction filter. However, the relationships between cloud pa-rameters and AOD are robust. Higher aerosol loading tends to push the distributions and means toward higher clouds and larger cloud fractions, regardless of whether the AOD is calculated from all-data, or the stringently less cloudy data sets. This positive correlation between aerosol and convec-tive strength means that wet scavenging of aerosol, which would introduce a negative correlation is not playing a sig-nificant role.
When focusing on the high-cloud data sets, the data are noisier due to the significant reduction in the sample size. Nevertheless, there is a clear increase in cloud top height associated with increased aerosol loadings, regardless of whether the data set includes all-data or only the data after the 20% cloud fraction filter is applied. There are subtle dif-ferences between the data sets; the less-cloudy filtered data show a stronger relationship between CTP for high clouds and increasing AOD than do the all-data, but a weaker rela-tionship between cloud fraction and AOD.
3.2 Correlations between GOCART AOD and MODIS
cloud properties
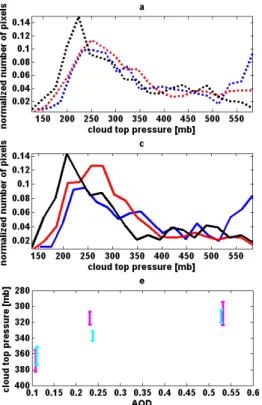
Fig. 5.Cloud properties vs. AOD for 3 AOD ranges: blue 0<AOD<0.15, red 0.15<AOD<0.35 and black 0.35<AOD<1.
Normalized-by-area histograms of(a)cloud top pressure for “all data”,(b)cloud fraction for “all data”,(c)as in (a) but for the data subjected to the 20%
cloud fraction filter (“all data filtered” and(d)as in (b) but for the data subjected to the 20% cloud fraction filter only (“all data filtered”);(e)
the average cloud top pressure vs. the average AOD for all-data (cyan) and “all data filtered” (magenta).(f)average cloud fraction vs. the
average AOD for all-data (cyan) and “all data filtered” (magenta). The vertical extent of the lines in (e) and (f) represents +/- one standard error.
aerosols (Chin et al., 2002). The model has a horizontal res-olution of 2◦latitude by 2.5◦ longitude and 20–30 vertical sigma layers, and uses the assimilated meteorological fields generated from the Goddard Earth Observing System Data Assimilation System (GEOS DAS, Schubert et al., 1993).
The use of simulated instead of measured AOD depends heavily on the accuracy of the assimilated dynamical data and the aerosol processes. The model and measurements have shown good agreement on seasonal and annual scales (Chin et al., 2002, 2009). However the big advantage of model output, in our case, is that it is completely free of any cloud contamination. Moreover GOCART is a completely independent estimate of the aerosol loading.
In order to increase the sampling statistics both GOCART and MODIS data were included and the study area was in-creased from the Atlantic ITCZ only, to a box encompassing (0◦N to 14◦N; 18◦W to 45◦W) for August 2007. The GO-CART AOD model output was interpolated from 2◦by 2.5◦ to 1◦ spatial resolution to match the MODIS level-3 data, which corresponds to the “all-data” data set of the previous analysis.
While significant differences in the magnitudes of the pa-rameters are expected, the trends between cloud properties and AOD are similar regardless of whether the AOD is
re-trieved from MODIS measurements (Figs. 5 and 6) or GO-CART simulations (Fig. 7). The similarity of the trends af-ter using two independent sources of AOD supports the ar-gument that the trends are not solely due to retrieval arti-fact. Quantitatively, the associations differ. The MODIS AOD product on a day-to-day basis is more accurate than GOCART, and would be the preferred source of AOD to de-rive quantitative relationships between cloud parameters and aerosol.
Fig. 6.As in Fig. 5 but for high clouds.
associations between aerosols and clouds in this particular situation will not lead to false conclusions due to cloud con-tamination in the AOD retrieval.
3.3 Causality
When performing analysis from observations one can de-tect correlations but an understanding of the causal relation-ships is much more elusive. Often numerical cloud mod-els are used to isolate aerosol effects, while controlling all other variables, and to resolve the physical explanation for the observed relationships. Another way to try to separate variables that may control cloud properties is to narrow the variability in individual components of the system. This pro-cess is analogous to running a model for the same conditions of one variable set (say meteorology) and comparing the re-sults to those obtained when changing the other one (aerosol loading). Here we have used the NOAA-NCEP Global Data Assimilation System (GDAS) at 1◦resolution to provide the meteorological context in the region of interest. The GDAS data set is assimilated 4 times a day, for 13 pressure levels from the surface to 20 hPa using surface and satellite obser-vations with model data (Kanamitsu, 1989; Parrish and Der-ber, 1992). The GDAS is the final run in the series of NCEP operational model runs. We have used the 12:00 UTC set which, on average, covers a period of time less than 2 h from the satellite observation time.
Fig. 7. MODIS cloud data vs. GOCART AOD analysis for 3
AOD ranges: blue 0<AOD<0.1, red 0.1<AOD<0.2 and black
0.2<AOD<1. Normalized-by-area histograms of (a) cloud top
pressure,(b)cloud fraction,(c)the average MODIS cloud top
pres-sure vs. the average GOCART AOD)(d) average MODIS cloud
Reanalysis data have been used previously to define the meteorology in aerosol-cloud studies from satellite and to estimate the meteorological contribution to cloud proper-ties (e.g., Kaufman et al., 2005a; Brioude et al., 2009; Savtchenko 2009) or to precipitation (Huang et al., 2009). Here we use an alternative approach to find the variables that best describe the ITCZ convective cloud properties (vertical development and cloud fraction) as measured by MODIS. After finding the meteorological variables that have the most statistically significant correlations with the measured cloud properties, the meteorological variance will be restricted by limiting the allowed range of the selected variables. Since convective systems are expected to have a well-defined set of meteorological properties (Jakob and Tselioudis, 2003), such a direct approach is preferred to a multi-variate regres-sion analysis (Kaufman et al., 2005a) where many meteoro-logical variables are mixed together to completely span the meteorological variance space. The multi-variate regression approach may yield better overall correlations with the free (convective cloud) variables but when mixing many differ-ent variables with differdiffer-ent units one may lose the physical reasoning and the likelihood of statistically insignificant cor-relations appearing is higher.
Since we seek meteorological variables that represent cloud properties at several scales, ranging from the high-est resolution that is limited by the assimilation resolution (1◦) to a synoptic scale, the same study area as for the GO-CART analysis is used (Atlantic ITCZ; 0◦N to 14◦N; 18◦W to 45◦W; August 2007), along with the MODIS level-3 data which is also given at 1◦ spatial resolution. By using this coarser resolution data we lose the ability to separate the three cloud modes seen in the Fig. 4 histogram that was con-structed from much finer resolution retrievals (5 km). Thus, the focus on the highest cloud top category applied in the analysis concerning cloud contamination cannot be repeated in this study of causality. Still the Atlantic ITCZ region of-fers a situation with deep convection comprising a prevalent component of the “all cloud” situation. Identifying robust re-lationships between aerosol and cloud properties here, will provide indirect support that aerosol is affecting the deep convective elements in the system.
The GDAS output has 286 meteorological variables. The key ones such as geopotential heights, temperature, winds (horizontal and vertical), relative humidity, vorticity and wa-ter mixing ratio are all given at 13 pressure levels. Other ables are specified at specific pressure levels (such as vari-ables that pertain to the boundary layer) or as an average of a few levels (the complete list of GDAS variables is given in Appendix A).
First we perform a correlation test over our study area be-tween MODIS-derived CTP, CFR and AOD against all of the GDAS output variables. In order to check sensitivity to spa-tial and temporal scales this is done for the finest assimilation resolution (1◦) and also for coarser resolutions of (2◦, 4◦and 8◦), and for data measured at the same time as the GDAS
output and at time lags of 1 day and 5 days. The signifi-cance of each correlation test was tested using the p-value test (Schervish, 1996). The p-value test is the probability of getting a correlation as large as the observed values by random chance, when the true correlation is zero (the null hypothesis). Lower p-values correspond to more significant results . Often, p-value thresholds of<0.05 are used to de-fine correlations as truly significant (Wilks, 2005). In our study a p-value threshold of 0.01 is used to be even more conservative.
Figure 8 shows the correlations between MODIS CTP and all of the GDAS output variables at 4 different spatial resolu-tions (1◦, 2◦, 4◦, 8◦). The plot area is divided by background color to signify the key variable regimes. The left part of each regime refers to the lower part of the atmosphere, grad-ually increasing in height (decreasing in pressure). Note how two regimes present remarkably high correlations, namely the pressure vertical velocity (ω)variables (53–73) and rela-tive humidity (RH) variables (74–94). Two of the other vari-ables that show high correlations are related (var. 228 precip-itable water and var. 245–248 relative humidity at different pressure level ranges). Decreasing the spatial resolution from 1◦to 4◦to 8◦sometimes has an effect on the correlations, but not enough to change the basic finding: MODIS-observed cloud top pressure is most robustly linked to broad scale ver-tical velocity and humidity variables, especially towards the upper troposphere.
Similarly to Fig. 8, Fig. 9 shows the correlations between MODIS-derived CTP, CFR and AOD and all of the GDAS output variables at 1◦spatial resolution. Indeed AOD does correlate well with some of the meteorological parameters but the parameters are different than those that correlate with the clouds. Moreover the correlation between cloud param-eters andωand RH and between aerosol parameters andω and RH are of opposite sign, suggesting that the same meteo-rology that favors higher aerosol loading (say midlevel conti-nental transport) will oppose development of deep convective clouds. For example, the analysis suggests that the correla-tion between AOD and RH is negative in this region because aerosol transport to the tropical Atlantic is often accompa-nied by dry continental air masses. This appears to dominate the otherwise expected positive correlation between AOD and RH due to water vapor uptake by the aerosol.
Becauseω(550 hPa) and RH (350 hPa) yielded the highest correlations with the satellite-derived cloud properties, these parameters will be used to represent the primary meteoro-logical controls on the cloud system. The broad-scale verti-cal velocity at 550 hPa is a good measure of the instability at this level and therefore represents the potential of clouds to develop up to and above this level. Similarly, as the average RH of the higher atmosphere (350 hPa) increases, so does the likelihood of convective clouds developing at and above this level.
Fig. 8.Correlations between MODIS cloud top pressure and the GDAS assimilation outputs for 4 model spatial resolutions: blue 1◦, red 2◦,
black 4◦and magenta 8◦. The zero correlation data points are the variables that did not pass the p-value<0.01 test.
Fig. 9. Correlations between MODIS cloud top pressure (upper), cloud fraction (middle) and aerosol optical depth (lower) and the GDAS
Fig. 10.MODIS cloud properties plotted as a function of AOD restricted byω(550 hPa) and RH (350 hPa). Theωsubsets are all in [Pa/s]
and divided as following: blue – all data, redω <−0.1, black−0.1< ω <0 and magenta 0< ω. The RH subsets are: blue – all data, red
0%<RH<25%, black 25%<RH<55% and magenta RH>55%.(a)CTP vs. AOD forωsubsets,(b)CFR vs. AOD forωsubsets,(c)CTP
vs. AOD for RH subsets and(d)CFR vs. AOD for RH subsets. Note how close to parallel the relationships are (more so for the CTP than
for the CFR) suggesting that the meteorology can be separated from aerosol effects. The offset of the lines (along the Y axis) represents the meteorology effect while the slope is attributed to aerosols.
ω <0 Pa/s for the weak convective regime andω >0 for the subsidence regime. Similarly the data were divided into 3 RH bins: 0%<RH<25%, 25%<RH<55% and 55%<RH. Di-viding into three broad bins ofωand RH of approximately equal number of samples in each bin allows sufficient statis-tics in each bin to beat down the noise and see the relation-ships between aerosol and cloud variables in different en-vironments, some conducive to convective development and some not. The parametersωat 550 hPa and RH at 350 hPa are indicators of general broad-scale meteorological condi-tions. Within each grid square, subgrid variability of vertical motion and relative humidity will influence aerosol and cloud properties and the interaction between aerosol and clouds at smaller scales. The focus here is the large regional scale. There is no inconsistency in finding clouds in grid squares with RH <25%. Because of the wide range in cloud top heights, and the paucity of clouds with high tops, the average cloud in our scene is associated with a pressure level much below 350 hPa. Thus, this level can be dry but still include clouds that form lower down in the atmosphere. In addition, the average cloud top height depends on the RH bin. For example, the average cloud-top-height in the high RH bin is
∼600 hPa whereas in the dry cases, the average cloud top height is∼720 hPa.
The correlations with AOD are presented for CTP and CFR restricted by ωand RH in Fig. 10. Note how indeed stronger uplifting and RH correlates with taller clouds that have larger cloud fraction suggesting that these variables do reflect correctly their expected effect on the convective cloud properties. Note also how the general relationships be-tween increasing AOD and cloud properties are not signif-icantly different between the different meteorological sub-sets and the original full data set (dotted blue lines). These curves suggest that the aerosol and meteorology exert a near-orthogonal forcing on the convective cloud properties with the y-intercept indicating the meteorology effect that is rep-resented by these GDAS variables and the slopes represent-ing the aerosol effect.
4 Discussion and conclusions
properties? The objective has been to present two method-ologies that can help confront these important questions. The results strengthen the case that the observed increase in cloud top height and cloud fraction associated with higher aerosol loadings in convective clouds over the Atlantic ITCZ in the data set studied is due to aerosol processes and not to re-trieval artifacts or meteorology. The observed response to aerosol perturbations is hypothesized to be a result of “invig-oration” – a concept that encompasses complementary parts: a suppression of the stabilizing effects of surface rain gen-erated by warm processes; a delay in the freezing process that results in latent heat release at higher levels in the cloud (destabilization); and stronger secondary convection associ-ated with more vigorous cold pool outflow.
The first problem addressed is that of the potential bias in aerosol measurements as a result of cloud contamination. Analyses have been performed with the standard MODIS trieval products as well as eliminating all 10 km aerosol re-trievals with internal CFR>20%, representing an inordinate effort to remove contaminated aerosol retrievals. When re-moving these retrievals more than 40% of the AOD retrievals are removed and information on complete aerosol regimes that are not necessarily affected by clouds is lost (see exam-ple in Fig. 2).
For the “all-data set”, i.e., the standard MODIS products, the cloud top pressure for the highest AOD category (AOD = 0.5) is 110±30 hPa lower (∼1000 m higher) than for the lowest AOD category (AOD = 0.1). After removing the aerosol data set with CFR >20%, height differences still exist, but are reduced to 60+/−30 hPa (∼550 m). Both all-data and the minimally-cloudy filtered all-data sets show similar magnitudes of increasing CFR with increasing AOD; CFR is 0.35±0.05 higher for the highest AOD category as com-pared with the lowest AOD category for the all-data set and 0.30±0.08 for the<20% cloud fraction filtered subset. In the high-only cloud-top case the results suggest enhancement of the high AOD/low AOD differences for the filtered sub-set, as compared with the all-data case. Here the average cloud tops rise 55±15 hPa higher (∼1000 m) when the AOD changes from 0.10 to 0.24 in the minimally-cloudy filtered subset and only 25±10 hPa (∼500 m) in the all-data set. The saturation of the microphysical effect after AOD >∼0.25 is also visible in the high-only data sets. The high-only CFR relationships with AOD are reduced from 0.35±0.05 to 0.23±0.08, from the “filtered” to “all-data” analyses. In-deed the data for all clouds and high-only clouds show clear and significant positive correlations between cloud top height and CFR and aerosol loading, whether all-data or minimally-cloudy filtered aerosol data sets are used.
Use of the GOCART-modeled AOD output has the advan-tage of removing any concerns of cloud contamination in the reported AOD. In this case, correlations of CFR and CTP with AOD show similar trends with larger magnitude, rein-forcing the results using MODIS-derived AOD. When the AOD changes from 0.05 to 0.28 the cloud tops are higher
by 330±30 hPa and the cloud fraction is significantly larger (0.4±0.1). GOCART model output is less accurate than the MODIS retrievals and subject to many uncertainties, but these uncertainties differ from those affecting the satellite re-trieval. Given that two independent measures of aerosol load-ing are associated qualitatively in the same way with invig-orated convection lends validity to the assertion that the cor-relations between MODIS-derived aerosol and cloud prod-ucts in this region and season of interest are not due to ar-tifacts of the MODIS aerosol retrievals. One disadvantage of the comparison to GOCART is that the transport-model data may still show humidification effects even after “clas-sical” cloud contamination is eliminated. GOCART realisti-cally allows aerosol particles to swell with humidity and thus there is some ambiguity as to whether AOD changes are due to changes in aerosol loading, or rather to differences in hu-midification. The relative humidity in the model is calculated from all-sky conditions, not clear-sky, and may be higher on average than the cloud-free portions of the grid square.
The second problem addressed is that of causality. To this end GDAS assimilation data are used to provide the context for the observed aerosol-cloud correlations. The GDAS as-similation data are used as an approximation for the mete-orological conditions at the same time and location of the satellite observations. The assimilation data include surface, radiosondes and space measurements in conjunction with an atmospheric general circulation model to represent a wide variety of meteorological data on a three-dimensional grid. The GDAS data may contain some information on aerosol radiative effects (if these affected the measurements used by the assimilation) but it should be minor and does not contain direct information on the aerosol microphysical effects that are the focus of this paper. Therefore it is argued to be a suitable tool to represent the dynamical component.
The differences in the correlation patterns between the cloud properties and AOD (Fig. 9) already suggest that, at least over this area, the positive correlations between AOD and deep convective vertical and horizontal development oc-cur in spite of the meteorology. The aerosol does correlate with some of the assimilation variables but mostly with ones different than those that correlate with convective clouds, and in many cases if there is a joint correlation it is with opposite sign, suggesting that AOD will be high in conditions that are not favorable for deep convective cloud.
clouds and so the fact that their correlations are the highest serves as a sanity check.
Restriction of the data toω and RH regimes has shown that, as expected, stronger broad-scale rising motion (low level convergence) and RH correlate with taller clouds and higher cloud fraction. Relationships between the satellite-derived cloud properties and AOD have been shown here to be almost invariant to the meteorological binning. For any of the meteorological scenarios spanned by theω and RH ranges, the ITCZ convective clouds are taller and larger when the aerosol loading increases, in accord with the invigoration hypothesis. Moreover, the slopes (as a function of the AOD) are similar for all subsets (CTP more-so than CFR) suggest-ing that the aerosol and meteorology exert a near- orthogonal forcing on convective invigoration. In such variable space, the aerosol effect defines a family of lines with a given slope and their intercept depends on the meteorology.
The analysis does include a number of imperfections. First, the AOD, the basic metric used for aerosol loading cannot always be monotonically linked to aerosol concen-tration, and suffers from ambiguity associated with water vapor uptake. In spite of the positive correlation between AOD and surface CCN measurements, errors can be sub-stantial (Kapustin et al., 2006; Andreae 2009). The quality of the AOD as a measure of CCN concentration depends on the aerosol type, uniformity and vertical distribution of the aerosol, and the merits of this approach may vary greatly. Second, it is not possible to completely separate meteorolog-ical influences from aerosol influences on clouds. This work can therefore only provide further evidence of the aerosol playing a significant role in increasing cloud top height and cloud fraction, but cannot quantify the relative contributions with confidence.
The analysis performed here provides further evidence that aerosol invigoration of clouds is not a result of data contami-nation or false correlations, but rather that it is consistent with a chain of physically-based constructs. Nevertheless, the mi-crophysical and dynamical complexity of convective clouds cautions us to continue to subject the vast global data-bases to further scrutiny and interrogation using new and innova-tive approaches.
Appendix A
GDAS model parameters associated with the abscissae of Figs. 8 and 9
The model includes 26 pressure levels (P)
(i=1, 26): P(1000, 975, 950, 925, 900, 850, 800, 750, 700, 650, 600, 550, 500, 450, 400, 350, 300, 250, 200, 150, 100, 70, 50, 30, 20, 10) (hPa) (i=27, 52): Temperature (at P levelsi=1,26)
(i=53, 73): Pressure vertical velocity (at P levelsi=1, 20) (i=74, 94): Relative Humidity (at P levelsi=1, 20) (i=95, 120): Absolute Vorticity (at P levelsi=1, 26) (i=121, 126): Ozone mixing ratio (at P levelsi=21, 26) (i=127, 147): Cloud water mixing ratio (at P levelsi=1, 20) (i=148): 5-wave geopotential height ati=13
(P = 500 mb)
(i=149, 200): (U; V) horizontal velocity pairs (at P levelsi=1, 26)
(i=201): Temperature at 30 hPa above ground (i=202): Relative Humidity at 30 hPa above ground (i=203): Specific Humidity at 30 hPa above ground (i=204): U-wind at 30 hPa above ground
(i=205): V-wind at 30 hPa above ground (i=206): Temperature at 1829 m a.m.s.l. (i=207): Temperature at 2743 m a.m.s.l. (i=208): Temperature at 3658 m a.m.s.l. (i=209): U-wind at 1829 m a.m.s.l. (i=210): V-wind at 1829 m a.m.s.l. (i=211): U-wind at 2743 m a.m.s.l. (i=212): V-wind at 2743 m a.m.s.l. (i=213): U-wind at 3658 m a.m.s.l. (i=214): V-wind at 3658 m a.m.s.l.
(i=215, 216): geopotential height, unknown height (i=217, 218): Temperature, unknown
(i=219, 220): Pressure, unknown
(i=221, 222): Vertical speed shear, unknown (i=223, 226): (U; V) wind pairs, unknown (i=227): Surface Pressure
(i=228): Precipitable Water
(i=229): Relative Humidity, unknown (i=230): Geopotential height, tropopause (i=231): Temperature, tropopause (i=232): Pressure, tropopause
(i=233): Vertical speed shear, tropopause (i=234): Surface Lifted Index, surface
(i=235): Convective Available Potential Energy (CAPE), surface
(i=236): Convective Inhibition (CIN), surface (i=237): Best (4-layer) lifted index, surface (i=238): Convective Available Potential Energy
(CAPE), 180 hPa above ground (i=239): Convective Inhibition (CIN), 180 hPa
above ground
(i=241): Temperature at max wind level (i=242): Pressure at max wind level (i=243): Geopotential height at surface (i=244): Pressure reduced to MSL
(i=245): Relative humidity at sigma 0.44–1.00 (i=246): Relative humidity at sigma 0.72–0.94 (i=247): Relative humidity at sigma 0.44–0.72 (i=248): Relative humidity at sigma 0.33–1.00 (i=249): Potential temperature at sigma = 0.995 (i=250): Temperature at sigma = 0.995
(i=251): Pressure vertical velocity at sigma = 0.995 (i=252): Relative Humidity at sigma = 0.995 (i=253): Total Ozone
(i=254): Cloud water mixing ratio (unknown) (i=255): Geopotential height at 0C isotherm (i=256): Relative Humidity at 0C isotherm (i=257): Geopotential height (unknown) (i=258): Relative Humidity (unknown) (i=259): U-wind (tropopause)
(i=260): V-wind (tropopause) (i=261): U-wind maximum (i=262): V-wind maximum (i=263): U-wind at sigma = 0.995 (i=264): V-wind at sigma = 0.995 (i=265): Temperature at surface
(i=266): Volumetric soil moisture (0–10 cm down) (i=267): Volumetric soil moisture (10–40 cm down) (i=268): Volumetric soil moisture (40–100 cm down) (i=269): Volumetric soil moisture (100–200 cm down) (i=270): Temperature (0–10 cm down)
(i=271): Temperature (10–40 cm down) (i=272): Temperature (40–100 cm down) (i=273): Temperature (100–200 cm down) (i=274): Accumulated snow at surface
(i=275): Land cover fraction (land = 1; sea = 0) (i=276): Surface Ice fraction (ice = 1; no ice = 0) (i=277): Temperature at 2 m above ground (i=278): Specific Humidity at 2 m above ground (i=279): Planetary Boundary Layer Height (i=280): Total Cloud Cover
(i=281): Relative Humidity at 2 m above ground (i=282): U-wind at 10 m above ground
(i=283): V-wind at 10 m above ground
(i=284): Geopotential height anomaly at 1000 hPa (i=285): Geopotential height anomaly at 500 hPa (i=286): 5-wave Geopotential height anomaly at
500 hPa
Acknowledgements. IK acknowledges a visiting fellowship from the Cooperative Institute for research in the Environmental Sci-ences (CIRES) for supporting this work. GF and IK acknowledge support from NOAA’s Climate Goal. LR and IK acknowledge support from NASA’s Interdisciplinary Science program.
Edited by: J. Quaas
References
Albrecht, B. A.: Aerosols, cloud microphysics, and fractional cloudiness, Science, 245(4923), 1227–1230, 1989.
Altaratz, O., Koren, I., and Reisin, T.: Humidity impact on the aerosol effect in warm cumulus clouds, Geophys. Res. Lett., 35, L17804, doi:10.1029/2008GL034178, 2008.
Andreae, M. O., Rosenfeld, D., Artaxo, P., Costa, A. A., Frank, G. P., Longo, K. M., and Silva- Dias, M. A. F.: Smoking rain clouds over the Amazon, Science, 303, 1337–1342, 2004.
Andreae, M. O., Jones, C. D., and Cox, P. M.: Strong present-day aerosol cooling implies a hot future, Nature, 435(3671), 1187– 1190, 2005.
Andreae, M. O.: Correlation between cloud condensation nu-clei concentration and aerosol optical thickness in remote and polluted regions, Atmos. Chem. Phys., 9, 543–556, doi:10.5194/acp-9-543-2009, 2009.
Andreae, M. O.: A new look at aging aerosols, Science, 326(5959), 1493, doi:10.1126/science.1183158, 2009b.
Berg, W., L’Ecuyer, T., and van den Heever, S. C.: Evidence for the impact of aerosols on the onset and microphysical properties of rainfall from a combination of active and passive satellite sen-sors, J. Geophy. Res., 113, D14S23, doi:10.1029/2007JD009649, 2008.
Br´eon, F.-M., Tanr´e, D., and Generoso, S.: Aerosol effect on cloud droplet size monitored from satellite, Science, 295, 834–838, 2002.
Brioude, J., Cooper, O. R., Feingold, G., Trainer, M., Freitas, S. R., Kowal, D., Ayers, J. K., Prins, E., Minnis, P., McKeen, S. A., Frost, G. J., and Hsie, E.-Y.: Effect of biomass burning on ma-rine stratocumulus clouds off the California coast, Atmos. Chem. Phys., 9, 8841–8856, doi:10.5194/acp-9-8841-2009, 2009. Burpee, R. W.: Some features of synoptic-scale waves based on
a compositing analysis of GATE data. Mon Weather Rev., 103, 921–925, 1975.
Chameides, W. L., Luo, C., Saylor, R., Streets, D., Huang, Y., Bergin, M., and Giorgi, F.: Correlation between model-calculated anthropogenic aerosols and satellite-derived cloud op-tical depths: indication of indirect effect?, J. Geophys. Res., 107(D10), 4085, doi:10.1029/2000JD000208, 2002.
Charlson, R. J., Ackerman, A. S., Bender, F. A.-M., Anderson, T. L., and Liu, Z: On the climate forcing consequences of the albedo continuum between cloudy and clear air, Tellus B, 59, 715–727, doi:10.1111/j.1600-0889.2007.00297.x, 2007.
Chin, M., Rood, R. B., Lin, S.-J., Muller, J. F., and Thompson, A. M.: Atmospheric sulfur cycle in the global model GOCART: model description and global properties, J. Geophys. Res., 105(D20), 24671–24687, doi:10.1029/2000JD900384, [AGU], 2000a.
Chin, M., Savoie, D. L., Huebert, B. J., Bandy, A. R., Thorn-ton, D. C., Bates, T. S., Quinn, P. K., Saltzman, E. S., and De Bruyn,W. J.: Atmospheric sulfur cycle in the global model GOCART: comparison with field observations and re-gional budgets, J. Geophys. Res., 105(D20), 24689–24712, doi:10.1029/2000JD900385, [AGU], 2000b.
2002.
Chin, M., Diehl, T., Dubovik, O., Eck, T. F., Holben, B. N., Sinyuk, A., and Streets, D. G.: Light absorption by pollution, dust, and biomass burning aerosols: a global model study and evaluation with AERONET measurements, Ann. Geophys., 27, 3439–3464, 2009,
http://www.ann-geophys.net/27/3439/2009/.
Coakley Jr., J. A., Bernstein, R. L., and Durkee, P. A.: Effect of ship-stack effluents on cloud reflectivity, Science, 237, 1020– 1022, 1987.
Cook, K. H.: Generation of the African Easterly Jet and its role in determining West African precipitation. J. Climate, 12, 1165– 1184, 1999.
Devasthale, A., Kr¨uger, O., and Grassl, H.: Change in cloud-top temperatures over Europe, IEEE Geosci. Remote S., 2, 333–336, doi:10.1109/LGRS.2005.851736, 2005.
Diedhou, A., Janicot, S., Viltard, A., de Felice, P., and Laurent, H.: Easterly wave regimes and associated convection over West Africa and tropical Atlantic: results from the NCEP/NCAR and ECMWF reanalyses, Clim. Dyn., 15, 795–822, 1999.
Fan, J., Yuan, T., Comstock, J. M., Ghan, S., Khain, A., Le-ung, L. R., Li, Z., Martins, J. V., and Ovchinnikov, M.: Dom-inant role by vertical wind shear in regulating aerosol effects on deep convective clouds, J. Geophys. Res., 114, D22206, doi:10.1029/2009JD012352, 2009.
Feingold, G., Remer, L. A., Ramaprasad, J., and Kaufman, Y. J.: Analysis of smoke impact on clouds in Brazilian biomass burn-ing regions: an extension of Twomey’s approach, J. Geophys. Res., 106(D19), 22907–22922, 2001.
Fisher, L. B.: Climatological validation of TRMM TMI and PR monthly rain products over Oklahoma. J. Appl. Meteor., 43, 519– 535, 2004.
Gao, B.-C., Kaufman, Y. J., Tan´e, D., and Li, R.-R.: Distinguishing tropospheric aerosol from thin cirrus clouds for improved aerosol retrievals using the ratio of 1.38 µm and 1.24 µm channels, Geo-phys. Res. Lett., 29(18), doi:10.1029/2002GL015475, 2002. Gun, R. and Phillips, B. B.: An experimental investigation of the
effect of air pollution on the initiation of rain, J. Meteorol., 14, 272–280, 1957.
Huang, J., Zhang , C., and Prospero, J. M.: Aerosol-induced large-scale variability in precipitation over the Tropical Atlantic. J. Cli-mate, 22, 4970–4988, 2009.
Huffman, G. J., Adler, R. F., Arkin, P., Chang, A., Ferraro, R., Gru-ber, A., Janowiak, J., McNab, A., Rudolf, B., and Schneider, U.: The Global Precipitation Climatology Project (GPCP) Combined Precipitation Data Set, Bull. Amer. Meteor. Soc., 78, 5–20, 1997. IPCC, 2007: Summary for Policymakers, in: Climate Change 2007: The Physical Science Basis, Contribution of Working Group I to the Fourth Assessment Report of the Intergovernmental Panel on Climate Change, edited by: Solomon, S., Qin, D., Manning, M., Chen, Z., Marquis, M., Averyt, K. B., Tignor, M., and Miller, H. L., Cambridge University Press, Cambridge, UK and New York, NY, USA.
Jakob, C. and Tselioudis, G.: Objective identification of cloud regimes in the tropical Western Pacific, Geophys. Res. Lett., 30, 2082, doi:2010.1029/2003GL018367, 2003.
Jenkins, G. S., Pratt, A. S., and Heymsfield, A. J.: Possible linkages between Saharan dust and tropical cyclone rain band invigoration in the Eastern Atlantic during NAMMA-06, Geophys. Res. Lett.,
35, L08815, doi:10.1029/2008GL034072, 2008.
Jiang, H. and Feingold, G.: Effect of aerosol on warm con-vective clouds: aerosol-cloud surface flux feedbacks in a new coupled large eddy model, J. Geophys. Res., 111, D01202, doi:10.1029/2005JD006138, 2006.
Kahn, R. A., Li, W.-H., Martonchik, J., Bruegge, C., Diner, D., Gaitley, B., Abdou, W., Dubovik, O., Holben, B., Smirnov, S., Jin, Z., and Clark, D.: MISR low-light-level calibration, and im-plications for aerosol retrieval over dark water, J. Atmos. Sci., 62, 1032–1062, 2005.
Kanamitsu, M.: Description of the NMC global data assimilation and forecast system, Weather Forecast., 4, 334–342, 1989. Kapustin, V. N., Clarke, A. D., Shinozuka, Y., Howell, S.,
Brekhovskikh, V., Nakajima, T., and Higurashi, A.: On the determination of a cloud condensation nuclei from satellite: challenges and possibilities, J. Geophys. Res., 111, D04202, doi:10.1029/2004JD005527, 2006.
Kaufman, Y. J. and Nakajima, T.: Effect of Amazon smoke on cloud microphysics and albedo – analysis from satellite imagery, J. Appl. Meteorol., 32, 729–744, 1993.
Kaufman, Y. J. and Fraser, R. S.: The effect of smoke particles on clouds and climate forcing, Science, 277, 1636–1639, 1997. Kaufman, Y. J., Tanr´e, D., and Boucher, O.: A satellite view of
aerosols in the climate system, Rev. Nat., 419, 215–223, 2002. Kaufman, Y. J., Koren, I., Remer, L., Rosenfeld, D., and Rudich,
Y.: The effect of smoke, dust, and pollution aerosol on shallow cloud development over the Atlantic Ocean, P. Natl. Acad. Sci. USA, 102, 11207–11212, 2005a.
Kaufman, Y. J., Koren, I., Remer, L. A., Tanr´e, D., Ginoux,
P., and Fan, S.: Dust transport and deposition observed
from the Terra-Moderate Resolution Imaging Spectroradiometer (MODIS) spacecraft over the Atlantic Ocean. J. Geophys. Res., 110, D10S12, doi:10.1029/2003JDO04436, 2005b.
Kaufman, Y. J., Boucher, O., Tanr´e, D., Chin, M., Remer, L. A., and Takemura, T.: Aerosol anthropogenic component es-timated from satellite data, Geophys. Res. Lett., 32, L17804, doi:10/1029/2005GL023125, 2005c.
Kaufman, Y. J., Remer, L. A., Tanr´e, D., Li, R. R., Kleidman, R., Mattoo, S., Levy, R., Eck, T., Holben, B. N., Ichoku, C., Martins, J., and Koren, I.: A critical examination of the residual cloud contamination and diurnal sampling effects on MODIS estimates of aerosol over ocean, IEEE T. Geosci. Remote, 43(12), 2886– 2897, 2005d.
Kaufman, Y. J. and Koren, I.: Smoke and pollution
aerosol effect on cloud cover, Science, 313, 655–658,
doi:10.1126/science.1126232, 2006.
Khain, A. P., Rosenfeld, D., and Pokrovsky, A.: Simulating con-vective clouds with sustained supercooled liquid water down to
−37.5◦C using a spectral microphysics model, Geophys. Res.
Lett., 28, 3887–3890, 2001.
Khain, A. P., Pokrovsky, A., BenMoshe, N., and Rosenfeld, D.: Simulating green-ocean-smoky and pyro-clouds observed in the Amazon region during the LBA-SMOCC campaign, J. Atmos. Sci., 61, 2963–2982, 2005.
Hubanks, P. A.: Cloud and aerosol properties, precipitable water, and profiles of temperature and humidity from MODIS, IEEE T. Geosci. Remote, 41, 442–458, 2003.
Koren, I., Kaufman, Y. J., Remer, L. A., and Martins, J. V.: Mea-surement of the effect of Amazon smoke on inhibition of cloud formation, Science, 303, 1342–1345, 2004.
Koren, I., Kaufman, Y. J., Rosenfeld, D., Remer, L. A., and
Rudich, Y.: Aerosol invigoration and restructuring of
At-lantic convective clouds, Geophys. Res. Lett., 32, LI4828, doi:10.1029/2005GL023187, 2005.
Koren, I., Remer, L. A., Kaufman, Y. J., Rudich, Y., and Martins, J. V.: On the twilight zone between clouds and aerosols, Geophys. Res. Lett., 34, L08805, doi:10.1029/2007GL029253, 2007. Koren, I., Martins, J. V., Remer, L. A., and Afargan, H.: Smoke
in-vigoration versus inhibition of clouds over the Amazon, Science, 321, 946, doi:10.1126/science.1159185, 2008a.
Koren, I., Oreopoulos, L., Feingold, G., Remer, L. A., and Altaratz, O.: How small is a small cloud?, Atmos. Chem. Phys., 8, 3855– 3864, doi:10.5194/acp-8-3855-2008, 2008.
Koren, I., Remer, L. A., Altaratz, O., Martins, J. V., and Davidi, A.: Aerosol-induced changes of convective cloud anvils produce strong climate warming, Atmos. Chem. Phys., 10, 5001–5010, doi:10.5194/acp-10-5001-2010, 2010.
L’Ecuyer, T. S., Berg, W., Haynes, J., Lebsock, M., and Takemura, T.: Global observations of aerosol impacts on precipitation oc-currence in warm maritime clouds, J. Geophys. Res., 114(D9), D09211, doi:10.1029/2008JD011273, 2009.
Lee, S. S., Donner, L. J., Phillips, V. T. J., and Ming, Y.: The de-pendence of aerosol effects on clouds and precipitation on cloud-system organization, shear and stability, J. Geophys. Res., 113, D16202, doi:10.1029/2007JD009224, 2008.
Levy, R. C., Remer, L., Mattoo, S., Vermote, E., and Kaufman, Y. J.: Second-generation algorithm for retrieving aerosol properties over land from MODIS spectral reflectance, J. Geophys. Res., 112, D13211, doi:10.1029/2006JD007811, 2007.
Lindsey, D. T. and Fromm, M.: Evidence of the cloud lifetime effect from wildfire-induced thunderstorms, Geophys. Res. Lett., 35, L22809, doi:10.1029/2008GL035680, 2008.
Loeb, N. G. and Manalo-Smith, N.: Top-of-atmosphere direct radiative effect of aerosols over global oceans from merged CERES and MODIS observations, J. Climate, 18, 3506, doi:10.1175%2FJCLI3504.1, 2005.
Loeb, N. G. and Schuster, G. L.: An observational study of the relationship between cloud, aerosol and meteorology in bro-ken low-level cloud conditions, J. Geophys. Res., 113, D14214, doi:10.1029/2007JD009763, 2008.
Marshak, A., Platnick, S., Varnai, T., Wen, G., and Caha-lan, R. F.: Impact of 3-D radiative effects on satellite re-trievals of cloud droplet sizes, J. Geophys. Res., 111, DO9207, doi:10.1029/2005JD006686, 2006.
Martins, J. V., Tanr´e, D., Remer, L. A., Kaufman, Y. J., Mattoo, S., and Levy, R.: MODIS cloud screening for remote sensing of aerosol over oceans using spatial variability, Geophys. Res. Lett., 29(12), 8009, doi:10.1029/2001GL01352, 2002.
Matsui, T., Masunaga, H., Kreidenweis, S. M., Pielke Sr., R. A., Tao, W.-K., Chin, M., and Kaufman, Y. J.: Satellite-based assess-ment of marine low cloud variability associated with aerosol, at-mospheric stability, and the diurnal cycle, J. Geophys. Res., 111, D17204, doi:10.1029/2005JD006097, 2006.
Mauger, G. S. and Norris, J. R.: Meteorological bias in satellite estimates of aerosol-cloud relationships, Geophys. Res. Lett., 34, L16824, doi:10.1029/2007GL029952, 2007.
Meskhidze, N., Remer, L. A., Platnick, S., Negr´on Ju´arez, R., Licht-enberger, A. M., and Aiyyer, A. R.: Exploring the differences in cloud properties observed by the Terra and Aqua MODIS Sen-sors, Atmos. Chem. Phys., 9, 3461–3475, doi:10.5194/acp-9-3461-2009, 2009.
Nakajima, T., Higurashi, A., Kawamoto, K., and Penner, J. E.: A possible correlation between satellite-derived cloud and aerosol microphysical parameters, Geophys. Res. Lett., 28, 1171–1174, 2001.
Norquist D. C., Recker E. E., and Reed R. J.: The energetics of African wave disturbances as observed during phase III of GATE, Mon. Weather Rev., 105, 334–342, 1977.
Parrish, D. and Derber, J.: The national meteorological center’s spectral statistical interpolation analysis system, Mon. Weather Rev., 120, 1747–1763, 1992.
Platnick, S., King, M. D., Ackerman, S. A., Menzel, W. P., Baum, B. A., Riedi, J. C., and Frey, R. A.: The MODIS cloud products: algorithms and examples from Terra, IEEE T. Geosci. Remote, 41(2), 459–473, 2003.
Prospero, J. M.: Saharan dust transport over the North Atlantic Ocean and Mediterranean: An overview. The Impact of Desert Dust Across the Mediterranean, edited by: Guerzoni, S. and Chester, R., Kluwer, 133–152, 1996.
Prospero, J. M. and Lamb, J. P.: African droughts and dust trans-port to the Caribbean: Climate change and implications, Science, 302, 1024–1027, 2003.
Quaas, J., Ming, Y., Menon, S., Takemura, T., Wang, M., Penner, J. E., Gettelman, A., Lohmann, U., Bellouin, N., Boucher, O., Sayer, A. M., Thomas, G. E., McComiskey, A., Feingold, G., Hoose, C., Kristj´ansson, J. E., Liu, X., Balkanski, Y., Donner, L. J., Ginoux, P. A., Stier, P., Grandey, B., Feichter, J., Sednev, I., Bauer, S. E., Koch, D., Grainger, R. G., Kirkev˚og, A., Iversen, T., Seland, Ø., Easter, R., Ghan, S. J., Rasch, P. J., Morrison, H., Lamarque, J.-F., Iacono, M. J., Kinne, S., and Schulz, M.: Aerosol indirect effects - general circulation model intercompar-ison and evaluation with satellite data, Atmos. Chem. Phys., 9, 8697–8717, doi:10.5194/acp-9-8697-2009, 2009.
Ramanathan, V., Crutzen, P. J., Kiehl, J. T., and Rosenfeld, D.: Aerosols, climate, and the hydrological cycle, Science, 294, 2119–2123, 2001.
Remer, L. A., Kaufman, Y. J., Tanr´e, D., Mattoo, S., Chu, D. A., Martins, J. V., Li, R.-R., Ichoku, C., Levy, R. C., Kleidman, R. G., Eck, T. F., Vermote, E., and Holben, B. N.: The MODIS aerosol algorithm, products and validation, J. Atmos. Sci., 62, 947–973, 2005.
Remer, L. A., Kleidman, R. G., Levy, R. C., Kaufman, Y. J., Tanr´e, D., Mattoo, S., Martins, J. V., Ichoku, C., Koren, I., Yu, H., and Holben, B. N.: Global aerosol climatology from the MODIS satellite sensors. J. Geophys. Res., 113, D14S07, doi:10.1029/2007JD009661, 2008.
Rosenfeld, D.: TRMM observed first direct evidence of smoke from forest fires inhibiting rainfall, Geophys. Res. Lett., 26, 3105– 3108, 1999.
Rosenfeld, D. and Woodley, W. L.: Deep convective clouds withs
sustaine highly supercooled liquid water until−37.5◦C, Nature,