Available online at www.ijpsdr.com
International Journal of Pharmaceutical Sciences and Drug Research 2013; 5(4): 179-183
179
Research Article
ISSN 0975-248X
Bioequivalence Study of Tramadol + Paracetamol (37.5 + 325 mg) In
Healthy Human Volunteers in Fasting Condition
S. Dhanure, A. Savalia, S. K. Nayak
*, A. K. Das, S. K. Kotha, A. K. Patra
Clinical Research and Pharmacovigilance, Micro Labs Limited, 58/3, Kudulu, Bangalore-560068, Karnataka, India
ABSTRACT
The bioequivalence between test and reference Tramadol and Paracetamol (37.5 + 325 mg) tablets was determined in 36 healthy subjects after a single dose in a randomized crossover study under fasting condition. Plasma concentrations were monitored over a period of 24 hour after the drug administration by validated LC/MS/MS analytical method. The pharmacokinetic parameters Cmax, AUC0-t, AUC0-∞, AUC0-t / AUC0-∞, Tmax, Kel and t½ were determined from plasma
concentration time profile of both formulations and found to be acceptable. The calculated pharmacokinetic parameters were compared statistically to evaluate bioequivalence between the test and reference products. The analysis of variance did not show any significant difference between the two formulations and 90 % confidence intervals for the ratio of Cmax(92.29
-104.18 %), AUC0-t (99.52 - 104.11 %) and AUC0-∞ (99.05 - 104.22 %) for tramadol and Cmax(93.56 - 110.27 %), AUC0-t
(96.37 - 102.70 %) and AUC0-∞ (97.22-103.28 %) for paracetamol test and reference products were within the 80 – 125 %
interval, satisfying the bioequivalence criteria the US Food and Drug Administration Guidelines. These results indicate that the test and the reference products of Tramadol and Paracetamol are bioequivalent.
Keywords:Bio-equivalence, Body Mass Index, Confidence interval, LC/MS/MS.
INTRODUCTION
Tramadol and Paracetamol fixed-dose combination is indicated for the symptomatic treatment of pain. [1] This combination is marketed in several countries worldwide. In Europe, the combination tablet is indicated in the treatment of moderate to severe pain in adolescents (>12 years) and adults and in USA, it is recommended for the short-term (≤ 5 days) management of acute pain in adults (>16 years). The combination provided effective analgesia in patients with various types of pain, such as osteoarthritis flare pain, chronic lower back pain, postsurgical orthopedic pain, and diabetic peripheral neuropathy pain. The recommended dosage of tramadol 37.5 mg and paracetamol 325 mg is two tablets 4 - 6 times per day as needed for pain relief and up to a maximum of 8 tablets per day. Due to the relatively short duration of action this is taken 4 - 6 times per day.[2]
Tramadol is well tolerated and effective analgesic used to treat moderate, severe and chronic pain. [3] This drug is a synthetic, centrally acting analgesic which possesses opioid agonist properties and activates monoaminergic spinal inhibition of pain. [4]Tramadol binds weakly to μ-and δ
-*Corresponding author: Mr. Santosh Kumar Nayak,
Clinical Research and Pharmacovigilance, Micro Labs Limited, 58/3, Kudulu, Bangalore-560068, Karnataka, India;
Tel.: +91-9035965902;Fax:+91-80-25744565;
E-mail:[email protected]
opioid receptors and also interferes with neuronal release and reuptake of serotonin (5-HT) and nor-epinephrine in the descending inhibitory pathway of the central nervous system. Tramadol is a racemic mixture of 2 enantiomers, (–)-tramadol and (+)-(–)-tramadol; the latter being more pharmacologically potent than the former. [2]
Paracetamol is classified in the group of aspirin like or NSAID like drugs. [5]It is commonly used for the pain relief. The analgesic and antihyperalgesic effects rely on cyclooxygenase inhibition, nitric oxide synthesis blockade or reinforcement of the serotonergic system. [6-7]
significant difference when administered at the same molar dose of the therapeutic moiety under similar experimental conditions.[3]
The overall cost of health care is rising due to increased cost of medicines. Introduction of the generic drugs has tremendously reduces the price of medicines without compromising the quality. [11]The genegic market has saved about $8.8 billion of drug expenditure for adults in US. [12] The FDA’s definition of “therapeutic equivalence” says that the generic formulation is (among other things) bioequivalent to the innovator formulation and indicates the FDA’s expectation that the formulations are likely “to have equivalent clinical effect and no difference in their potential for adverse effects”. [13] “In vivo equivalence” or “bioequivalence” studies are carried out to assess the “interchangeability” between the innovator and generic products. [11]
The aim of the present study is to evaluate the bioequivalence between two fixed dose combination tablets of Tramadol and Paracetamol (37.5 + 325 mg) tablets in normal, healthy, adult, human subjects under fasting condition.
MATERIALS AND METHODS
Independent Ethics Committee approval was obtained before conducting the study. The study was conducted in accordance with the ethical principles that have their origin in the World Medical Association Declaration of Helsinki and in compliance with ICH E6 GCP and the local ethical guidelines of Indian Council of Medical Research. Subjects were enrolled in the study after obtaining written informed consent. The subjects were under medical supervision throughout their stay in the clinical facility to ensure safety and well being of the subjects in GVK Biosciences Pvt. Ltd.
Test product: Tramadol Hydrochloride 37.5 mg and Acetaminophen 325 mg Tablets, Batch No: TAAG001, Manufactured by MICRO LABS LIMITED, INDIA.
Reference product: ULTRACET® (37.5 mg tramadol HCl/325 mg acetaminophen tablets), Batch No: 8HG824-X, Manufactured by Janssen Ortho, NJ 08869.
The study was a randomized, open label, balanced, two-treatment, two-sequence, two-period, single-dose, crossover oral bioequivalence study in normal, healthy, adult, human subjects under fasting condition. A total of 36 normal, healthy, adult, human subjects were enrolled in the study. 35 subjects completed both the periods of the study and the data from 35 subjects were included in the pharmacokinetic and statistical analysis.
All subjects were examined for inclusion and exclusion criteria based on clinical examinations, recording of 12-lead electrocardiogram and laboratory investigations of blood and urine within the 21 days prior to first dosing. Radiological investigations (Chest X-ray) were performed not more than 6 months prior to first dosing. The subjects were healthy male human subjects aged between 18 to 55 years, BMI between 18.5 to 24.9 Kg/m2but the body weight not less than 45 kg. The total duration of the study was 10 days including the 07 days of washout period. In both the study periods, subjects were housed at the clinical facility from not less than 10.5 hours pre-dose till at least 24 hours post-dose in each period. Subjects fasted overnight for at least 10 hours prior to scheduled time for dosing. As per the randomization schedule generated by statistical software SAS® Version 9.1.3, one tablet of test or reference product was administered
to each subject in sitting posture with 240 mL of water at ambient temperature by trained study personnel in each period. Subjects were instructed not to chew or crush the tablet but to consume it as a whole. Compliance for dosing was assessed by a thorough check of the oral cavity immediately after dosing. Subjects remained seated for two hours after dosing in each period except when clinically indicated to change the posture or in case of any natural exigency. Thereafter, the subjects were allowed to engage in normal activities while avoiding severe physical exertion. Equal allocation of treatments or balanced randomization was ensured.
Blood sampling and processing
Twenty nine venous blood samples (each 5ml) were collected from each subject during each period at pre-dose (within 1 hour before dosing) and at 0.167, 0.33, 0.50, 0.67, 0.83, 1.00, 1.167, 1.33, 1.50, 1.75, 2.00, 2.25, 2.50, 2.75, 3.00, 3.25, 3.50, 4.00, 4.50, 5.00, 6.00, 7.00, 8.00, 10.00, 12.00, 16.00, 20.00 and 24.00 hours after dosing within an window period of ±2 minutes. Post-dose samples collected beyond ± 2 minutes from the scheduled sampling time were reported as protocol deviations.
Heparin-lock technique (about 1 mL of 5 IU/mL heparin in normal saline solution was injected into the cannula after each sample collection) was used to prevent clotting of the blood in the indwelling cannula. Blood samples were collected after discarding the first 0.5 mL of heparinised blood from the tubing of the cannula. Collected blood samples were transferred to properly labeled vacuettes®/ vacutainers®containing K
2EDTA as anticoagulant.
Blood samples were centrifuged under refrigeration with machine set at 3000 rpm for 10 minutes at 4°C. After centrifugation, the plasma were separated and transferred to prelabeled polypropylene tubes in two aliquots. These polypropylene tubes were stored below -20°C for a maximum period of 12 hours and then they were stored at -70°C ± 20°C until analysis.
Statistical and pharmacokinetic evaluation
Plasma samples were analysed to quantify the concentrations of Tramadol and Paracetamol using LC/MS/MS bioanalytical method. The bioanalytical method was validated at the analytical facility for sensitivity, specificity, linearity, accuracy and precision (repeatability and reproducibility), ruggedness, recovery, dilution integrity, stability of samples (freeze-thaw stability, bench-top stability, auto sampler stability, dry extract stability, post extract stability, intermediate term stability, short-term and long-term stock solution stability of drug and internal standard) and matrix effect.
For Tramadol
The linearity range of Tramadol during method validation was 0.996 ng/mL to 402.351 ng/mL and the limit of quantification was 0.996 ng/mL. The subject samples were analysed with the linearity range of 1.011 ng/mL to 400.930 ng/mL and the limit of quantification was 1.011 ng/mL
For Paracetamol
et al.
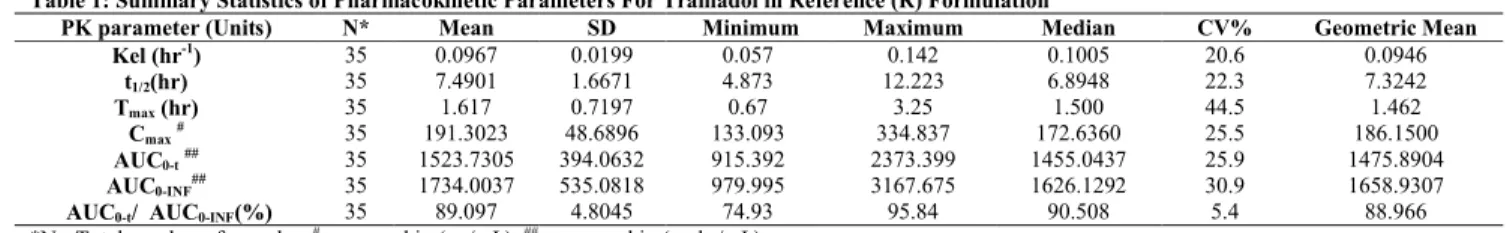
Table 1: Summary Statistics of Pharmacokinetic Parameters For Tramadol in Reference (R) Formulation
PK parameter (Units) N* Mean SD Minimum Maximum Median CV% Geometric Mean Kel (hr-1
) 35 0.0967 0.0199 0.057 0.142 0.1005 20.6 0.0946
t1/2(hr) 35 7.4901 1.6671 4.873 12.223 6.8948 22.3 7.3242
Tmax(hr) 35 1.617 0.7197 0.67 3.25 1.500 44.5 1.462
Cmax# 35 191.3023 48.6896 133.093 334.837 172.6360 25.5 186.1500
AUC0-t## 35 1523.7305 394.0632 915.392 2373.399 1455.0437 25.9 1475.8904
AUC0-INF## 35 1734.0037 535.0818 979.995 3167.675 1626.1292 30.9 1658.9307
AUC0-t/ AUC0-INF(%) 35 89.097 4.8045 74.93 95.84 90.508 5.4 88.966 *N= Total number of samples, #expressed in (ng/mL), ##expressed in (ng.hr/mL)
Table 2: Summary Statistics of Pharmacokinetic Parameters For Tramadol in Test (T) Formulation
PK parameter (Units) N* Mean SD Minimum Maximum Median CV% Geometric Mean Kel (hr-1) 35 0.0978 0.0201 0.052 0.137 0.0940 20.6 0.0956
t1/2(hr) 35 7.4319 1.7949 5.043 13.452 7.3732 24.2 7.2483
Tmax(hr) 35 1.733 0.7403 0.50 3.50 1.750 42.7 1.574
Cmax #
35 188.1868 48.4363 101.012 317.059 177.6450 25.7 182.2394
AUC0-t ##
35 1552.2417 420.4755 906.447 2453.933 1436.6880 27.1 1499.8658
AUC0-INF ##
35 1763.4758 569.0672 988.726 3288.820 1563.5003 32.3 1682.9453
AUC0-t/ AUC0-INF (%) 35 89.268 5.0369 72.63 95.28 91.133 5.6 89.121 *N= Total number of samples, #expressed in (ng/mL), ##expressed in (ng.hr/mL)
Table 3: Summary Statistics of Pharmacokinetic Parameters For Paracetamol In Reference (R) Formulation
PK parameter (Units) N* Mean SD Minimum Maximum Median CV% Geometric Mean Kel (hr-1
) 35 0.2928 0.0833 0.129 0.502 0.2706 28.5 0.2820
t1/2(hr) 35 2.5535 0.7424 1.380 5.353 2.5611 29.1 2.4581
Tmax(hr) 35 1.026 0.5883 0.33 2.25 0.830 57.4 0.871
Cmax# 35 4103.0050 1151.2171 2544.901 6963.543 3630.3310 28.1 3958.8520
AUC0-t## 35 13033.4669 3446.6678 6708.489 20638.414 13864.2188 26.4 12569.3593
AUC0-INF ## 35 14023.3538 3697.4393 7334.080 22431.113 15077.7486 26.4 13528.6210
AUC0-t/ AUC0-INF (%) 35 92.926 1.7759 89.49 96.47 93.324 1.9 92.909 *N= Total number of samples, #expressed in (ng/mL), ##expressed in (ng.hr/mL)
Table 4: Summary Statistics of Pharmacokinetic Parameters For Paracetamol in Test (T) Formulation
PK parameter (Units) N* Mean SD Minimum Maximum Median CV% Geometric Mean Kel (hr-1
) 35 0.2878 0.0681 0.167 0.450 0.2911 23.7 0.2801
t1/2(hr) 35 2.5448 0.6219 1.541 4.151 2.3815 24.4 2.4748
Tmax(hr) 35 1.076 0.5585 0.33 2.75 1.000 51.9 0.946
Cmax# 35 4181.1049 1204.3891 2017.367 6528.856 3971.7950 28.8 4011.8101
AUC0-t## 35 12938.3732 3354.0484 7504.984 19508.024 13464.8636 25.9 12503.4514
AUC0-INF## 35 14015.9442 3611.6087 8440.917 21995.913 14439.7168 25.8 13554.1302
AUC0-t/ AUC0-INF (%) 35 92.273 2.1565 88.69 96.05 92.123 2.3 92.248 *N= Total number of samples, #expressed in (ng/mL), ##expressed in (ng.hr/mL)
Table 5: Statistical Results of Log Transformed PK Parameters For Tramadol PK
Parameters
Geometric Least Square Mean Ratio T/R (%)
90% Confidence Interval
Power (%)
ISCV (%)
T R
Cmax 182.7000 186.3234 98.06 92.29 - 104.18 100.0 15.0
AUC0-t 1502.3094 1475.8395 101.79 99.52 - 104.11 100.0 5.6
AUC0-INF 1685.1902 1658.6371 101.60 99.05 - 104.22 100.0 6.3
Table 6: Statistical Results of Log Transformed Pk Parameters For Paracetamol PK
Parameters
Geometric Least Square Mean Ratio T/R (%)
90% Confidence Interval
Power (%)
ISCV (%)
T R
Cmax 4016.4602 3954.2061 101.57 93.56 - 110.27 99.7 20.5
AUC0-t 12515.0567 12579.5725 99.49 96.37 - 102.70 100.0 7.9
AUC0-INF 13566.5882 13538.9321 100.20 97.22 - 103.28 100.0 7.5
Pharmacokinetic Analyses
Non-compartmental model was used for the estimation of pharmacokinetic parameters Cmax, AUC0-t, AUC0-INF, tmax, Kel
and t1/2from plasma concentration time profiles of Tramadol
and Paracetamol using WinNonlin®Version 4.1.
The area under the curve from time '0' to the last time point with measurable plasma concentrations was computed using linear trapezoidal rule.
RESULTS
The maximum concentration of tramadol was achieved at 1.733 ± 0.7403 hours, 1.617 ± 0.7197 hours and of paracetamol at 1.076 ± 0.5585, 1.026 ± 0.5883 hours for test and reference product respectively. The t1/2 of tramadol was
observed to be 7.43 hours for test and 7.49 hours for
reference where as the t1/2 for paracetamol was 2.544 hours
for test and 2.553 hours for reference.
Summary statistics of pharmacokinetic parameters (Kel, t1/2,
Tmax, Cmax, AUC0-t, AUC0-INF, AUC0-t/ AUC0-INF) for reference
(R) and test (T) formulation of tramadol and paracetamol are presented in Table-1, Table-2, Table-3 and Table-4.
A total of 35 subjects completed both the periods of the study. The mean pharmacokinetic parameters (Cmax, AUC0-t
and AUC0-INF) estimated for Tramadol and Paracetamol for
both the test and reference products are represented in Table-5 and Table-6 respectively.
The mean of Cmax, AUC0-t and AUC0-INF of tramadol were
4016.4602, 12515.0567, 13566.5882 for test and 3954.2061, 12579.5725, 13538.9321 for reference respectively.
The 90% confidence interval of Cmax(92.29 - 104.18), AUC 0-t(99.52 - 104.11) and AUC0-INF (99.05 - 104.22) for tramadol
and the 90% confidence interval of Cmax (93.56 - 110.27),
AUC0-t (96.37 - 102.70) and AUC0-INF (97.22 - 103.28) for
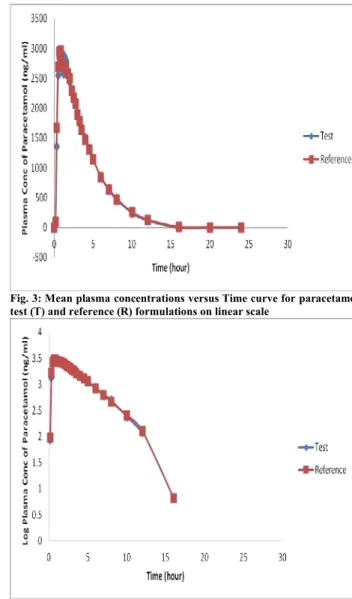
paracetamol were within the range of 80.00 – 125.00%. The mean and logarithmic Plasma concentrations versus Time curve for tramadol test (T) and reference (R) formulations on linear scale and logarithmic scale are presented in Figure-1 and Figure-2 respectively and for paracetamol in Figure-3 and Figure-4 respectively.
Fig. 1: Mean plasma concentrations versus Time curve for tramadol Test (T) and Reference (R) formulations on linear scale
Fig. 2: Log Mean plasma concentrations versus Time curve for Tramadol Test (T) and Reference (R) formulations on logarithmic scale
DISCUSSION
This bioequivalence study conducted on healthy subjects shows that there is no significant difference for Cmax, AUC0-t
and AUC0-INF between the two formulations. The 90%
confidence interval for the geometric least square mean ratio for above parameters indicates that the reported values are entirely within the bioequivalence acceptance range of 80 -125% (Log transformed data). [14,15] Based on the pharmacokinetic and statistical results of this study, we can conclude that Tramadol Hydrochloride 37.5 mg and Paracetamol 325 mg Tablets (MICRO LABS LIMITED,
INDIA) is bioequivalent to ULTRACET®(37.5 mg tramadol
HCl/325 mg acetaminophen tablets, Janssen Ortho, NJ 08869) and the two products can be interchangeable in the medical use.
Fig. 3: Mean plasma concentrations versus Time curve for paracetamol test (T) and reference (R) formulations on linear scale
Fig. 4: Log Mean plasma concentrations versus Time curve for paracetamol test (T) and reference (R) formulations on logarithmic scale.
Since the test product was found to be bioequivalent to the reference product, both the products can be considered to have similar efficacy and safety. US FDA, EMEA, TGA and some other countries regulatory bodies recommended that the generic product should be bioequivalent to the innovator product/ marketed product to exclude any difference in clinical efficacy and pharmacokinetic profile and implementing different guidelines to ensure quality of the product. This study was conducted in fasting condition. So the bioequivalence need to be established in fed condition. Multiple dose studies may be conducted to explore any difference in pharmacokinetic profile and may be done in patient population to access pharmacodynamic similarities.
ACKNOWLEDGMENTS
et al.
REFERENCES
1. Dhillon S. Tramadol/paracetamol fixed-dose combination: a review of its use in the management of moderate to severe pain. Clin Drug Investig. 2010; 30(10):711-738.
2. Yi S, Chung Y, Kim T, Shin H, Yoon SH, Cho J, Jang I, Shin S, Yu K. Pharmacokinetics of Extended-Release Versus Conventional Tramadol/ Acetaminophen Fixed-Dose Combination Tablets: An Open-Label, 2-Treatment, Multiple-Dose, Randomized-Sequence Crossover Study in Healthy Korean Male Volunteers. Clinical Therapeutics. 2011; 33(6):728-737.
3. Silva MF, Schramm SG, Kano EK, Koono EEM, Porta V, Serra CHR. Bioequivalence Evaluation of Single Doses of Two Tramadol Formulations: A Randomized, Open-Label, Two-Period Crossover Study in Healthy Brazilian Volunteers. Clinical Therapeutics. 2010; 32(4):758-765.
4. Lee CR, McTavish D, Sorkin EM. Tramadol. A preliminary review of its pharmacodynamic and pharmacokinetic properties, and therapeutic potential in acute and chronic pain states. Drugs. 1993; 46(2):313-340.
5. Alloui A, Chassaing C, Schmidt J, Ardid D, Dubray C, Cloarec A, Eschalier A. Paracetamol exerts a spinal, tropisetron-reversible, antinociceptive effect in an inflammatory pain model in rats. European Journal of Pharmacology. 2002; 443:71-77.
6. Dogrul A, Seyrek M, Akgul EO, Cayci T, Kahraman S, Bolay H. Systemic paracetamol-induced analgesic and antihyperalgesic effects through activation of descending serotonergic pathways involving spinal 5-HT7 receptors. European Journal of
Pharmacology. 2012; 677:93-101.
7. Mallet C, Daulhac L, Bonnefont J, Ledent C, Etienne M, Chapuy E, Libert F, Eschalier A. Endocannabinoid and serotonergic systems
are needed for acetaminophen-induced analgesia. Pain. 2008; 139:190–200.
8. Perrot S, Krause D, Crozes P, Naim C. Efficacy and Tolerability of Paracetamol/Tramadol (325 mg/ 37.5 mg) Combination Treatment Compared with Tramadol (50 mg) Monotherapy in Patients with Subacute Low Back Pain: A Multicenter, Randomized, Double-Blind, Parallel-Group, 10-Day Treatment Study. Clinical Therapeutics. 2006; 28:1592-1606.
9. Filitz J, Ihmsen H, Gunther W, Troster A, Schwilden H, Schuttler J, Koppert W. Supra-additive effects of tramadol and acetaminophen in a human pain model. Pain. 2008; 136:262–270.
10. Pergolizzi Jr JV, Laar M, Langford R, Mellinghoff H, Merchante IM, Nalamachu S, O’Brien J, Perrot S, Raffa RB. Tramadol/paracetamol fixed-dose combination in the treatment of moderate to severe pain. Journal of Pain Research. 2012; 5:327– 346.
11. Midha KK, McKay G. Bioequivalence; Its History, Practice, and Future. The AAPS Journal. 2009; 11(4):664-670.
12. Haas JS, Phillips KA, Gerstenberger EP, Seger AC. Potential Savings from Substituting Generic Drugs for Brand-Name Drugs: Medical Expenditure Panel Survey, 1997–2000. Ann Intern Med. 2005; 142:891-897.
13. Drugs@FDA Glossary of Terms. Available at: http://www.fda.gov/Drugs/InformationOnDrugs/ucm079436.htm#T E. Accessed April 19, 2013
14. US Food and Drug Administration, Guidance for Industry Bioavailability and Bioequivalence Studies for Orally Administered Drug Products - General Considerations. 2003; 1:1-23.