ACPD
14, 6803–6820, 2014Downward coupling in the TTL
N. Eguchi et al.
Title Page
Abstract Introduction
Conclusions References
Tables Figures
◭ ◮
◭ ◮
Back Close
Full Screen / Esc
Printer-friendly Version Interactive Discussion
Discussion
P
a
per
|
D
iscussion
P
a
per
|
Discussion
P
a
per
|
Discuss
ion
P
a
per
|
Atmos. Chem. Phys. Discuss., 14, 6803–6820, 2014 www.atmos-chem-phys-discuss.net/14/6803/2014/ doi:10.5194/acpd-14-6803-2014
© Author(s) 2014. CC Attribution 3.0 License.
Atmospheric Chemistry and Physics
Open Access
Discussions
This discussion paper is/has been under review for the journal Atmospheric Chemistry and Physics (ACP). Please refer to the corresponding final paper in ACP if available.
A global non-hydrostatic model study of
a downward coupling through the tropical
tropopause layer during a stratospheric
sudden warming
N. Eguchi1, K. Kodera2, and T. Nasuno3
1
Research Institute for Applied Mechanics, Kyushu University, Kasuga, Japan 2
Solar-Terrestrial Environment Laboratory, Nagoya University, Nagoya, Japan 3
Research Institute for Global Change, Japan Agency for Marine-Earth Science and Technology, Yokohama, Japan
Received: 21 February 2014 – Accepted: 27 February 2014 – Published: 13 March 2014
Correspondence to: N. Eguchi ([email protected])
ACPD
14, 6803–6820, 2014Downward coupling in the TTL
N. Eguchi et al.
Title Page
Abstract Introduction
Conclusions References
Tables Figures
◭ ◮
◭ ◮
Back Close
Full Screen / Esc
Printer-friendly Version Interactive Discussion
Discussion
P
a
per
|
D
iscussion
P
a
per
|
Discussion
P
a
per
|
Discuss
ion
P
a
per
|
Abstract
The dynamical coupling process between the stratosphere and troposphere in the tropical tropopause layer (TTL) during a stratospheric sudden warming (SSW) in bo-real winter was investigated using simulation data from a global non-hydrostatic model (NICAM) that does not use cumulus parameterization. The model reproduced well the 5
observed tropical tropospheric changes during the SSW including the enhancement of convective activity following the amplification of planetary waves. Deep convective activity was enhanced in the latitude zone 20–10◦S, in particular over the southwest
Pacific and southwest Indian Ocean. Although the upwelling in the TTL was correlated with that in the stratosphere, the temperature tendency in the TTL was mainly con-10
trolled by diabatic heating originating from cloud formation. This result suggests that the stratospheric meridional circulation affects cloud formation in the TTL.
1 Introduction
There have been many studies on the interaction between the stratosphere and tropo-sphere in the tropical tropopause layer (hereafter, TTL), which is typically located at 14– 15
19 km altitude or 150–90 hPa (Highwood and Hoskins, 1998; Fueglistaler et al., 2009), with stratospheric water vapor variation on interannual and seasonal time scales (cf., Randel and Jensen, 2013) an important topic. Possible impacts of the recent strato-spheric cooling trend on the troposphere, such as an increase in tropical cyclones, are currently the subject of discussion (Emanuel et al., 2013; Ramsay, 2013). However, it 20
is difficult to separate the stratospheric effect on the troposphere from other factors for long-term variations such as a warming of the ocean.
Here, we focus on changes in the troposphere during a stratospheric sudden warm-ing (hereafter, SSW) event, which drastically modifies the stratospheric circulation in the space of a week. It is, therefore, relatively easy to identify the causal relationship 25
ACPD
14, 6803–6820, 2014Downward coupling in the TTL
N. Eguchi et al.
Title Page
Abstract Introduction
Conclusions References
Tables Figures
◭ ◮
◭ ◮
Back Close
Full Screen / Esc
Printer-friendly Version Interactive Discussion
Discussion
P
a
per
|
D
iscussion
P
a
per
|
Discussion
P
a
per
|
Discuss
ion
P
a
per
|
long-term variability such as the Madden–Julian Oscillation (MJO), El Nino–Southern Oscillation (ENSO), or the Quasi-Biennial Oscillation (QBO). Previous observational studies showed that strong SSW events modulated tropical convective activity and the general circulation in the troposphere (the Hadley and Walker cells) (Eguchi and Kodera, 2007, 2010 (EK10)). However, it is still not clear how the connection between 5
the stratosphere and troposphere occurs and how it modulates the convective activity during SSW events.
This is largely due to a lack of global observations of vertical velocity in the TTL. Ueyama et al. (2013) showed that the temperature tendency in the stratosphere can be used as a proxy for the vertical motion (i.e., the strength of the Brewer–Dobson 10
(BD) circulation). However, this relationship does not hold below the tropopause, where diabatic heating due to cloud formation cancels adiabatic cooling, as will be shown later.
Data from numerical simulation are useful for examining vertical velocity in the TTL. Thuburn and Craig (2000) used momentum forcing in a simplified global general cir-15
culation model (GCM) to show that a change in the stratospheric meridional circu-lation modified cumulus heating in the TTL as well as the tropopause height. Kodera et al. (2011) constructed a more realistic forecast experiment by incorporating an atmo-spheric blocking-type circulation anomaly in the North Atlantic in the initial conditions to amplify planetary waves and produce strong BD circulation later in the stratosphere. 20
The results showed similar effects in the tropics to those seen in observational studies, that is, the tropical convective activity was enhanced zonally, especially in the South-ern Hemisphere (SH), and cooling at the tropopause region associated with the SSW event was capable of modulating tropical convective activity.
These results suggest that convection plays an important role in the stratosphere– 25
ACPD
14, 6803–6820, 2014Downward coupling in the TTL
N. Eguchi et al.
Title Page
Abstract Introduction
Conclusions References
Tables Figures
◭ ◮
◭ ◮
Back Close
Full Screen / Esc
Printer-friendly Version Interactive Discussion
Discussion
P
a
per
|
D
iscussion
P
a
per
|
Discussion
P
a
per
|
Discuss
ion
P
a
per
|
(non-hydrostatic icosahedral atmospheric model) (Satoh et al., 2008), which does not use cumulus parameterization. A case study using such high-resolution simulation data has the advantage of capturing the fine vertical and temporal structures of the TTL during the SSW event, which might be smoothed away in a statistical analysis of a huge number of events occurring under a range of conditions.
5
The remainder of the paper is organized as follows. The next section deals with the NICAM simulation data (Sect. 2), Sect. 3 shows the SSW event simulated in NICAM and the dynamical variability in the stratosphere and troposphere during the SSW. A summary and discussion of the results are given in Sect. 4.
2 Analysis data
10
The numerical simulation was conducted using NICAM, the global non-hydrostatic model with a horizontal mesh size of 14 km and 40 vertical levels. The model top was at 38 km with nine layers between 10 km and 20 km altitude. Moist convection was explicitly calculated using a cloud microphysical scheme with six prognostic vari-ables (Tomita, 2008). Atmospheric radiation, turbulence, and ocean processes were 15
calculated using the MSTRN-X (Nakajima et al., 2000; Sekiguchi and Nakajima, 2008), Mellor–Yamada–Nakanishi–Niino level 2 (Mellor and Yamada, 1982; Nakanishi and Ni-ino, 2006; Noda et al., 2010), and slab ocean models, respectively. The sea surface temperature (SST) was initialized using the National Centers for Environmental Predic-tion (NCEP) final (FNL) operaPredic-tional global analysis data (1◦
×1◦), and nudged to the
20
NOAA weekly Optimum Interpolation SST analysis (Reynolds and Smith, 1994) with a relaxation time of seven days.
The atmospheric initial data were interpolated from the ECMWF YOTC (Year of trop-ical Convection) analysis (Waliser et al., 2012). The simulation period was the 30 days starting from 20 December 2009. During this period, a significant MJO event took 25
ACPD
14, 6803–6820, 2014Downward coupling in the TTL
N. Eguchi et al.
Title Page
Abstract Introduction
Conclusions References
Tables Figures
◭ ◮
◭ ◮
Back Close
Full Screen / Esc
Printer-friendly Version Interactive Discussion
Discussion
P
a
per
|
D
iscussion
P
a
per
|
Discussion
P
a
per
|
Discuss
ion
P
a
per
|
The cloud properties in the upper troposphere (UT) have been evaluated in comparison with satellite observations (e.g., Inoue et al., 2010; Kodama et al., 2012).
In the present study, winds (zonal, meridional and vertical), temperature, specific humidity, diabatic heating rates (by cloud microphysics and solar radiation), snow, ice and graupel contents, and cloud fraction were analyzed. The cloud fraction data are 5
two-dimensional (longitude–latitude), and the others are three-dimensional. Snapshot data were archived at 3 h intervals except for cloud fraction (hourly mean) and diabatic heating rate (daily mean). All the output variables were daily averaged and converted into 1◦datasets.
3 Results
10
3.1 Stratospheric sudden warming simulated by NICAM
In the real atmosphere, the SSW in the boreal hemisphere occurred during Jan-uary 2010 (cf., Dörnbrack et al., 2012). The temperature increased by +35 K in the northern polar region and decreased by−2.5 K in the tropical lower stratosphere (LS)
with increasing wave activity at middle latitudes (Fig. 1a and b). In the NICAM simula-15
tion, minor stratospheric warming spontaneously occurred in January 2010, although the date on which the tropical lower stratospheric (approximately 50–80 hPa) tempera-ture started decreasing was approximately five days earlier than in the real atmosphere. The temperature rose in the polar region, but decreased in the tropics (Fig. 2a) because enhanced wave activity at middle latitudes (Fig. 4c) induced downwelling in the polar 20
region and upwelling in the tropics in the stratosphere. The magnitude of temperature variation was almost comparable to that in the real atmosphere: the temperature rose by approximately+25 K in the northern polar region and fell−1.5 K in the tropics after
7 January.
The tropical averaged temperature in the LS decreased gradually from 14 January; 25
ACPD
14, 6803–6820, 2014Downward coupling in the TTL
N. Eguchi et al.
Title Page
Abstract Introduction
Conclusions References
Tables Figures
◭ ◮
◭ ◮
Back Close
Full Screen / Esc
Printer-friendly Version Interactive Discussion
Discussion
P
a
per
|
D
iscussion
P
a
per
|
Discussion
P
a
per
|
Discuss
ion
P
a
per
|
south side of the equator starts around 14 January before that on the north side. In the tropical troposphere, the center of the region of active convection shifted south-ward from 5◦S to 15◦S after 14 January, when the LS started cooling. The latitude of
minimum temperature was located to the south of the convective region (around 25◦S;
Fig. 2c), here the LS upwelling was enhanced. 5
After 21 January, cooling occurred over the wide tropics (30◦S–30◦N) with an
equa-torially symmetric structure (Fig. 2b). The largest cloud fraction occurred in associa-tion with the cooling in the tropical LS around 24 January. Note that the cloud frac-tion includes both convective and upper level thin clouds. The convective clouds are measured by outgoing longwave radiation (OLR). The region of minimum OLR shifted 10
southward from 5◦S to 12.5◦S after 14 January, and the upper level clouds (ice clouds)
extended farther southward (15◦S) than convective clouds (not shown). In the real
atmosphere, the convective region was shifted southward around 20 January and en-hanced around 2 February (Fig. 1c). The convective initiation of the MJO event took place over the western Indian Ocean at the end of December 2009, and the MJO prop-15
agated eastward during January 2010. The SSW occurred when the MJO passed over the maritime continent. In the simulation, the MJO was weaker than in the observa-tions. Thus, the effects of the MJO are expected to be insignificant for the simulated convective variations during the target two weeks.
We divided the period into three consecutive seven-day periods according to the LS 20
tropical temperature (Fig. 2): period (i) (7–13 January) is prior to the start of the cooling event. Period (ii) (14–20 January) is characterized by a cooling trend, while period (iii) (21–27 January) is the period of peak cooling. These periods could be regarded as the initiation, transition, and mature phases of the SSW impact on the tropics, respectively.
3.2 Connection between stratospheric and tropospheric meridional circulation
25
ACPD
14, 6803–6820, 2014Downward coupling in the TTL
N. Eguchi et al.
Title Page
Abstract Introduction
Conclusions References
Tables Figures
◭ ◮
◭ ◮
Back Close
Full Screen / Esc
Printer-friendly Version Interactive Discussion
Discussion
P
a
per
|
D
iscussion
P
a
per
|
Discussion
P
a
per
|
Discuss
ion
P
a
per
|
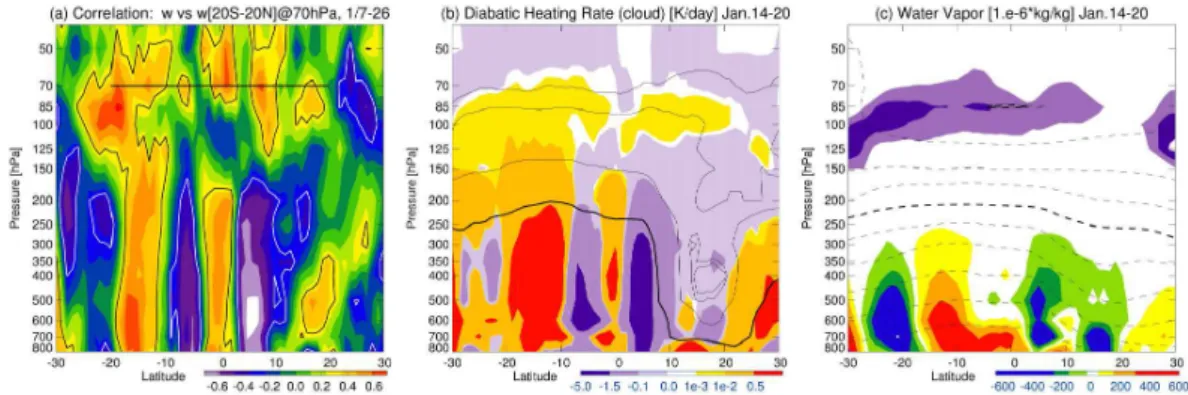
tropospheric circulation, the temporal correlation coefficient between the tropical mean vertical velocity at 70 hPa and the zonal mean vertical velocity at each level was cal-culated (Fig. 3a). The vertical velocity at 100 hPa (TTL) was not correlated with that at 70 hPa, except near 20◦S. However, better correlation is found in the deep troposphere
and the LS in a latitudinal zone of 20◦S–10◦S where the convection is enhanced in
5
period (ii) as shown in Fig. 2c.
Variation of the vertical velocity in the troposphere usually accompanies a change in cloud formation. The difference in diabatic heating due to cloud microphysics between periods (ii) and (i) is displayed in Fig. 3b. A large change in the diabatic heating is found between 20–10◦S corresponding to the zone of enhanced upwelling from the surface to
10
the TTL. In the TTL (at 100 hPa), an increase of the diabatic heating extended all over the tropics including the Northern Hemisphere (NH). This zone of increased diabatic heating just below 70 hPa corresponds to a zone of decreased water vapor (Fig. 3c), as upwelling induces adiabatic cooling leading to sublimation of water vapor. The cooling trend in the TTL was evident over the wide tropics (not shown).
15
Cirrus cloud forms over the TTL (around 100 hPa) after the onset of the SSW, al-though higher correlations of vertical wind with that over the tropical LS are limited to within the convective region (20–10◦S). In other words, the low correlation between the
vertical motion in the LS and that in the TTL (around 100 hPa) implies that the mecha-nisms of the formation of ice clouds in the TTL were different from those of convective 20
clouds in the tropical deep troposphere. The next subsection will describe the detailed mechanism of ice cloud formation in the TTL.
Figure 3b and c also shows that the increased diabatic heating in the deep tropo-sphere occurs in association with an increase of water vapor in the lower tropotropo-sphere. This is indicative of positive feedback between convective activity and low-level mois-25
ACPD
14, 6803–6820, 2014Downward coupling in the TTL
N. Eguchi et al.
Title Page
Abstract Introduction
Conclusions References
Tables Figures
◭ ◮
◭ ◮
Back Close
Full Screen / Esc
Printer-friendly Version Interactive Discussion
Discussion
P
a
per
|
D
iscussion
P
a
per
|
Discussion
P
a
per
|
Discuss
ion
P
a
per
|
3.3 Downward propagation of dynamical signal through the TTL
Time–altitude sections of the temperature tendency, static stability and anomalous ver-tical velocity are displayed in Fig. 4. The static stability is defined bygθ∂θ∂z, wheregis the acceleration due to gravity (9.81 m s−2) andθis potential temperature [K]. Variables are
averaged over the tropical band between 20◦S and 5◦N, where the convective activity
5
and the upwelling in the TTL showed clear changes during the SSW event (Fig. 3). Temperatures started to decrease in the LS and the upper TTL (above 17.5 km) around 15 January, but increased in the troposphere. The region of weak cooling trend then propagated downward in the TTL during period (ii) and reached the UT (approxi-mately 10 km) in period (iii). The zone of weaker static stability also descended through 10
the TTL following the cooling trend. The anomalous vertical velocity (Fig. 4b) showed a strengthening of the upwelling propagating from the LS to the UT in period (ii), simi-lar to the temperature tendency, but with enhancement in the deep troposphere during period (iii), when total cloud fraction was the largest (Fig. 2c).
To understand the different characteristics of the variations in temperature tendency 15
and vertical velocity, we investigated the major terms (the term on the LHS and first two terms on the RHS of the following equation) of the thermodynamic equation in the Transformed Eulerian Mean (TEM) framework (Andrews et al., 1987);
∂T ∂t =−N
2w∗
P
0 P
−κ
+DH−v ∗
a ∂T ∂φ−
1 ρ0
∂ ∂z
"
ρ0 v′T′
a∂T∂z ∂T ∂φ+w
∗T′
!#
.
HereT is temperature,N is Brunt–Väisälä frequency,w∗(v∗) is the vertical (meridional)
20
component of residual vertical velocity, DH is diabatic heating rate (cloud microphysics and radiation),P(P0) is (reference) pressure and κ is R/Cp (0.286), (where R is the
gas constant andCp is the specific heat at constant pressure). The third and fourth
terms of the RHS of the equation are meridional advection and diffusion by waves and eddies, respectively.
ACPD
14, 6803–6820, 2014Downward coupling in the TTL
N. Eguchi et al.
Title Page
Abstract Introduction
Conclusions References
Tables Figures
◭ ◮
◭ ◮
Back Close
Full Screen / Esc
Printer-friendly Version Interactive Discussion
Discussion
P
a
per
|
D
iscussion
P
a
per
|
Discussion
P
a
per
|
Discuss
ion
P
a
per
|
The temperature tendency agrees quite well with the adiabatic cooling rate at 20 km (LS) (Fig. 4d). The evolution of these curves matches that of the eddy heat flux (v′T′)
at 100 hPa averaged over the extratropical NH (Fig. 4c). Note also that the radiative di-abatic heating rate remains almost constant at+0.5∼0.6 K day−1, which may balance
the third and fourth terms on the RHS of the above thermodynamic equation. 5
At the bottom part of the TTL (14.3 km in Fig. 4e), the adiabatic and diabatic heating were almost in balance, while the adiabatic cooling associated with the stratospheric upwelling drove the temperature tendency at greater heights. Meanwhile, the heat bal-ance in the TTL was also related to the longitudinal distributions of diabatic heating due to cloud microphysics and solar (shortwave) radiation.
10
Figure 5a and b shows the horizontal variation of the latent heating rate due to cloud microphysics as an indicator of cloud formation at the bottom of the TTL (14.3 km). Figure 5c and d shows the longitude–height section of vertical velocity averaged over 20–10◦S. Left and right panels display the averages during periods (i) and (ii),
re-spectively. In period (i), before the SSW event started, clouds formed mainly along the 15
intertropical convergence zone (ITCZ) and over the southwestern Pacific region in the UT, which extended up to the TTL. In the TTL, clouds were also found over equatorial Africa and South America.
When the LS in the southern tropics started to cool in period (ii), convective activity in the TTL shifted southward and increased along the latitudes 20–10◦S (Fig. 3b),
20
particularly over the southwestern Pacific, southwestern Indian Ocean, and coastal regions. The development of convective intensity and depth from the period (i) to (ii) is apparent in the pressure–longitude section of vertical velocity, especially over the western Pacific and the western Indian Ocean (Fig. 5c and d). The upward motion above the TTL, especially at 85 hPa, became dominant in period (ii).
25
ACPD
14, 6803–6820, 2014Downward coupling in the TTL
N. Eguchi et al.
Title Page
Abstract Introduction
Conclusions References
Tables Figures
◭ ◮
◭ ◮
Back Close
Full Screen / Esc
Printer-friendly Version Interactive Discussion
Discussion
P
a
per
|
D
iscussion
P
a
per
|
Discussion
P
a
per
|
Discuss
ion
P
a
per
|
4 Summary and discussion
The present study investigates stratospheric dynamical impacts on the tropical tro-pospheric convection during a SSW event using simulation data from a global non-hydrostatic model (NICAM). The model reproduced the observed processes: convec-tive activity in the tropical SH was enhanced following an amplification of extratropical 5
planetary wave activity in the winter NH.
The stratosphere–troposphere connection was detected in the correlation coefficient between the tropical stratospheric upwelling and the vertical velocity in the tropical troposphere. The highest correlation was found in the SH 20–10◦S latitudinal band
(Fig. 3a). Particularly large variations were found over the southwestern Indian Ocean, 10
southwestern Pacific, and coastal regions (Fig. 5).
Although upwelling in the stratosphere was correlated with that in the troposphere, they were not produced by the same process (Fig. 4). Vertical velocity in the LS is mainly driven by extratropical planetary waves, reflected in the location of the strongest LS upward motion between 20◦S and 30◦S, but that in the UT was controlled mainly
15
by deep convection (between 10◦S and 20◦S), while the vertical velocity in the TTL
was affected by both upwelling in the LS (a branch of the stratospheric meridional circulation) and convection, which is able to reach to the TTL. The enhanced upwelling in the LS during the SSW event can intrude deeper into the TTL and cause adiabatic cooling of the TTL.
20
The correlation between the vertical velocities at these two levels implies that the stratospheric meridional circulation affects cloud formation in the TTL. It can be shown that the enhanced adiabatic cooling in the LS destabilizes the underlying TTL, promot-ing ice cloud formation over the TTL (Fig. 3b and c) and stronger convective activity. Li and Thompson (2013) showed that month-to-month variation of the clouds around the 25
ACPD
14, 6803–6820, 2014Downward coupling in the TTL
N. Eguchi et al.
Title Page
Abstract Introduction
Conclusions References
Tables Figures
◭ ◮
◭ ◮
Back Close
Full Screen / Esc
Printer-friendly Version Interactive Discussion
Discussion
P
a
per
|
D
iscussion
P
a
per
|
Discussion
P
a
per
|
Discuss
ion
P
a
per
|
However, the convective clouds around 20–10◦S latitude in period (ii) extended over
the whole troposphere, and appeared as longitudinally localized (mesoscale) convec-tive activities. Similarly to Fig. 3a, the correlation coefficient between the tropical mean vertical velocity at 70 hPa and the vertical velocity at each level and longitude averaged over the latitudinal band of active convection (20–10◦S) was examined. High
correla-5
tions were found over the western Indian Ocean, Central Pacific and South America in the TTL, and over Africa and the western Pacific from the surface to the UT (not shown). In particular, the strong upwelling near Madagascar and south western Pa-cific in Fig. 5b and d was associated with a tropical cyclone. These results suggest that more detailed analysis in time and space is needed to understand the interaction 10
between the global scale stratospheric circulation and the mesoscale organization of cloud in the troposphere.
Acknowledgements. The NICAM simulation was performed on the Earth Simulator. The
au-thors would like to thank Chihiro Kodama at the Japan Agency for Marine-Earth Science and Technology (JAMSTEC) for his useful comments. This study was supported by JSPS KAKENHI
15
Grant-in-Aid for Young Scientists (B), number 23710025 and JSPS KAKENHI Grant-in-Aid for Scientific Research (C), number 25340010.
References
Andrews, D. G., Holton, J. R., and Leovy, C. B.: Middle Atmosphere Dynamics, Academic Press, Orlando, Florida, 489 pp., 1987.
20
Dörnbrack, A., Pitts, M. C., Poole, L. R., Orsolini, Y. J., Nishii, K., and Nakamura, H.: The 2009– 2010 Arctic stratospheric winter – general evolution, mountain waves and predictability of an operational weather forecast model, Atmos. Chem. Phys., 12, 3659–3675, doi:10.5194/acp-12-3659-2012, 2012.
Eguchi, N. and Kodera, K.: Impact of the 2002, Southern Hemisphere, stratospheric
warm-25
ACPD
14, 6803–6820, 2014Downward coupling in the TTL
N. Eguchi et al.
Title Page
Abstract Introduction
Conclusions References
Tables Figures
◭ ◮
◭ ◮
Back Close
Full Screen / Esc
Printer-friendly Version Interactive Discussion
Discussion
P
a
per
|
D
iscussion
P
a
per
|
Discussion
P
a
per
|
Discuss
ion
P
a
per
|
Eguchi, N. and Kodera, K.: Impacts of stratospheric sudden warming event on tropical clouds and moisture fields in the TTL: a case study, SOLA, 6, 137–140, doi:10.2151/sola.2010-035, 2010.
Emanuel, K., Solomon, S., Folini, D., Davis, S., and Cagnazzo, C.: Influence of tropical tropopause layer cooling on Atlantic hurricane activity, J. Climate, 26, 2288–2301, 2013.
5
Fueglistaler, S., Dessler, A. E., Dunkerton, T. J., Folkins, I., Fu, Q., and Mote, P. W.: Tropical tropopause layer, Rev. Geophys., RG1004, doi:10.1029/2008RG000267, 2009.
Highwood, E. J. and Hoskins, B. J.: The tropical tropopause, Q. J. Roy. Meteor. Soc., 124, 1579–1604, 1998.
Inoue, T., Satoh, M., Hagihara, Y., Miura, H., and Shmetz, J.: Comparison of high-level
10
clouds represented in a global cloud system-resolving model with CALIPSO/CloudSat and geostationary satellite observations, J. Geophys. Res.-Atmos., 115, D00H22, doi:10.1029/2009JD012371, 2010.
Kodama, C., Noda, A. T., and Satoh, M.: An assessment of the cloud signals simulated by NICAM using ISCCP, CALIPSO, and CloudSat satellite simulators, J. Geophys. Res.-Atmos.,
15
117, D12210, doi:10.1029/2011JD017317, 2012.
Kodera, K., Mukougawa, H., and Kuroda, Y.: A general circulation model study of the im-pact of a stratospheric sudden warming event on tropical convection, SOLA, 7, 197–200, doi:10.2151/sola.2011-050, 2011.
Li, Y. and Thompson, D. W. J.: The signature of the stratospheric Brewer–Dobson circulation
20
in tropospheric clouds, J. Geophys. Res.-Atmos., 118, 3486–3494, doi:10.1002/jgrd.50339, 2013.
Mellor, G. L. and Yamada, T.: Development of a turbulent closure model for geophysical fluid problems, Rev. Geophys., 20, 851–875, 1982.
Nakajima, T., Tsukamoto, M., Tsushima, Y., Numaguti, A., and Kimura, T.: Modeling of the
25
radiative process in an atmospheric general circulation model, Appl. Optics, 39, 4869–4878, doi:10.1364/AO.39.004869, 2000.
Nakanishi, M. and Niino, H.: An improved Mellor–Yamada level-3 model: its numerical stability and application to a regional prediction of advection fog, Bound.-Lay. Meteorol., 119, 397– 407, 2006.
30
ACPD
14, 6803–6820, 2014Downward coupling in the TTL
N. Eguchi et al.
Title Page
Abstract Introduction
Conclusions References
Tables Figures
◭ ◮
◭ ◮
Back Close
Full Screen / Esc
Printer-friendly Version Interactive Discussion
Discussion
P
a
per
|
D
iscussion
P
a
per
|
Discussion
P
a
per
|
Discuss
ion
P
a
per
|
Ramsay, H. A.: The effects of imposed stratospheric cooling on the maximum intensity of trop-ical cyclones in axisymmetric radiative–convective equilibrium, J. Climate, 26, 9977–9985, doi:10.1175/JCLI-D-13-00195.1, 2013.
Randel, W. J. and Jensen, E. J.: Physical processes in the tropical tropopause layer and their role in a changing climate. Nat. Geosci., 6, 169–176, doi:10.1038/ngeo1733, 2013.
5
Reynolds, R. W. and Smith, T. M.: Improved global sea surface temperature analyses using optimum interpolation, J. Climate, 7, 929–948, 1994.
Satoh, M., Matsuno, T., Tomita, H., Miura, H., Nasuno, T., and Iga, S.: Nonhydrostatic icosa-hedral atmospheric model (NICAM) for global cloud resolving simulations, J. Comput. Phys., 227, 3486–3514 doi:10.1016/j.jcp.2007.02.006, 2008.
10
Sekiguchi, M. and Nakajima, T.: A k-distribution-based radiation code and its computational optimization for an atmospheric general circulation model, J. Quant. Spectrosc. Ra., 109, 2779–2793, 2008.
Thuburn, J. and Craig, G. C.: Stratospheric influence on tropopause height: the radiative constraint, J. Atmos. Sci., 57, 17–28, doi:10.1175/1520-0469(2000)057<0017:SIOTHT>2.0
15
.CO;2, 2000.
Tomita, H.: New micorphysical schemes with five and six categories by diagnostic generation of cloud ice, J. Meteorol. Soc. Jpn., 86A, 121–142, 2008.
Ueyama, R., Gerber, E. P., Wallace, J. M., and Frierson, D. M. W.: The role of high-latitude waves in the intraseasonal to seasonal variability of tropical upwelling in the Brewer–Dobson
20
circulation, J. Atmos. Sci., 70, 1631–1648, doi:10.1175/JAS-D-12-0174.1, 2013.
Waliser, D. E., Moncrieff, M., Burridge, D., Fink, A. H., Gochis, D., Goswami, B. N., Guan, B., Harr, P., Heming, J., Hsu, H.-H., Jakob, C., Janiga, M., Johnson, R., Jones, S., Knippertz, P., Marengo, L., Nguyen, H., Pope, M., Serra, Y., Thorncroft, C., Wheeler, M., Wood. R., and Yuter, S.: The “Year” of tropical convection (May 2008–April 2010): climate variability and
25
ACPD
14, 6803–6820, 2014Downward coupling in the TTL
N. Eguchi et al.
Title Page
Abstract Introduction
Conclusions References
Tables Figures
◭ ◮
◭ ◮
Back Close
Full Screen / Esc
Printer-friendly Version Interactive Discussion
Discussion
P
a
per
|
D
iscussion
P
a
per
|
Discussion
P
a
per
|
Discuss
ion
P
a
per
|
Fig. 1. (a)Time series of observed zonal mean temperature [K] in the northern high latitude at 10 hPa (black line) and tropical at 50 hPa (red line) from 5 January to 5 February, 2010. Note the different temperature scales for the polar (left) and tropical (right) regions.(b)Time series of observed zonal mean eddy heat flux [K m s−1] at 100 hPa averaged between 45◦N and 75◦N.(c)Time–latitude (25◦S–10◦N) section of NOAA observed zonal mean OLR [W m−2
ACPD
14, 6803–6820, 2014Downward coupling in the TTL
N. Eguchi et al.
Title Page
Abstract Introduction
Conclusions References
Tables Figures
◭ ◮
◭ ◮
Back Close
Full Screen / Esc
Printer-friendly Version Interactive Discussion
Discussion
P
a
per
|
D
iscussion
P
a
per
|
Discussion
P
a
per
|
Discuss
ion
P
a
per
|
Fig. 3. (a)Latitude–pressure sections of correlation between the vertical wind averaged over 20◦S–20◦N at 70 hPa (thick line) and vertical wind at each level and latitude for the period of 7–26 January. The black (white) contour indicates the value of 0.3 (−0.3) which is the 95% confidence level of thettest. Latitude–pressure sections of(b)latent heating rate due to cloud formation [K day−1] (contours) and (c) the water vapor concentration [10−6kg kg−1] (dashed contours) averaged between 14 and 20 January. The thin contours in(b)are values of 10−3
ACPD
14, 6803–6820, 2014Downward coupling in the TTL
N. Eguchi et al.
Title Page
Abstract Introduction
Conclusions References
Tables Figures
◭ ◮
◭ ◮
Back Close
Full Screen / Esc
Printer-friendly Version Interactive Discussion
Discussion
P
a
per
|
D
iscussion
P
a
per
|
Discussion
P
a
per
|
Discuss
ion
P
a
per
|
![Fig. 1. (a) Time series of observed zonal mean temperature [K] in the northern high latitude at 10 hPa (black line) and tropical at 50 hPa (red line) from 5 January to 5 February, 2010.](https://thumb-eu.123doks.com/thumbv2/123dok_br/18290197.346524/14.918.176.523.46.484/series-observed-temperature-northern-latitude-tropical-january-february.webp)

![Fig. 4. Time–altitude section of (a) temperature tendency [K day −1 ] (color shading) and ten- ten-dency of static stability with value of −0.02 [10 − 4 s − 2 day − 1 ] shown by black contours, and (b) anomalous normalized vertical velocity averaged betwee](https://thumb-eu.123doks.com/thumbv2/123dok_br/18290197.346524/17.918.57.655.96.379/altitude-temperature-tendency-stability-anomalous-normalized-velocity-averaged.webp)
![Fig. 5. Maps of diabatic heating rate from cloud microphysics [K day −1 ] at 14.3 km (a, b) av- av-eraged over 7–13 January (left, a) and 14–20 January (right, b)](https://thumb-eu.123doks.com/thumbv2/123dok_br/18290197.346524/18.918.57.651.153.381/maps-diabatic-heating-cloud-microphysics-eraged-january-january.webp)
