Cooperative Spatial Decision Support System
for Controlling Animal Diseases Outbreaks in
Egypt
Mahmoud BakrDepartment of Expert System Tools, Central Lab. For Agricultural Expert Systems,ARC, Egypt Email: [email protected]
Mona Nasr
Department of Information Systems, Faculty of Computers & Info.,Helwan University, Egypt Email: [email protected]
Maryam Hazman
Department of Testing and Training, Central Lab. For Agricultural Expert Systems,ARC, Egypt Email: [email protected]
---ABSTRACT--- Decision Support System (DSS) aims to help decision maker in the process of making decision, a Spatial Decision Support System (SDSS) is a DSS deals with spatial problem or use spatial data in solving a problem. Animal Diseases Spatial Decision Support System (ADSDSS) utilizes the capabilities of Data warehouse, Online Analytical Processing (OLAP), Geographic Information System (GIS), data mining techniques and knowledge base systems to provide decision makers with their needed information about the infected animals, infected places and diseases outbreaks. This information is displayed as reports or charts or allocated on a map which illustrates the most and the least affected places in an easy and fast way. So decision makers can take the right decision to control the spread of diseases outbreaks. For building ADSDSS the following steps are done (a) Animal diagnosis data from different data bases with climate database collected into a repository data warehouse for generating diagnosis data mart, (b) OLAP capabilities integrated with the diagnosis data mart for analysis and aggregation of data, (c) One of data mining techniques was applied and integrated into the system (association rules) to discover the relationships between different data items, (d) GIS spatial analysis and visualization capabilities integrated with the system to analyze diagnosis data and generate maps of diseases and outbreaks, (e) decisions suggestion capability integrated into the system to provide decision makers with suggestions and solutions to deal with diseases outbreaks. The experimental results show that the proposed system can provide the decision makers with their needed information in a fast and easy way.
Keywords - Animal Diseases, Data mining, Data warehouse, Decision suggestion, Geographic Information System (GIS), Online Analytical Processing (OLAP), Spatial Analysis, Spatial Decision Support System (SDSS).
--- --- Date of Submission: January 4, 2015 Date of Acceptance: February 15, 2015
---
---1. INTRODUCTION
A
nimal and plant are two of the most important resources in developing countries. Governments try to maximize its resources usages to face the problem of food gap and insufficient food which caused by many reasons, like high population growth and lack of resources and production. So, governments pay special caring of plant and animals production as they have impact on their economies and the gross national product. They entered in all industries, which aim to achieve food security for the community and its members.There are large number of endemic diseases appeared in Egypt in the recent period, such as Foot and Mouth Disease (FMD) and avian flu. These diseases caused losses in a large number of animals, medications and immunizations. And hence, these losses lead to lack of production of meat and milk [1, 2]. These diseases often appeared as outbreaks. The lack of information about outbreaks may lead to late or wrong decisions and actions to face these diseases outbreak.
In Egypt the agency which responsible for animal Veterinary Services is the General Organization for Veterinary Services (GOVS).
GOVS has many transactional information systems like BOVIS and TADINFO which record animal identity numbers, vaccination, diagnosis, slaughtering and so on. These systems have many static designed reports which are poor reports to help decision makers. They have no reports about places of disease outbreak and geographical representation and visualization of the spread of specific disease.
and C1 OLAP tool was used to browse the cube data and generate charts and reports for the selected dimensions data. In data mining component association rule Apriori algorithm implemented to discover the relationship between different data items. In GIS spatial analysis and visualization component, specific analysis methods were applied to selected diagnosis data to generate and visualize output map. The decisions suggestion component uses the knowledge of diseases outbreak and the diagnosis data to suggest decisions to decision makers to help them facing outbreaks.
The rest of this paper is organized as follows. A brief overview of related work is presented in section 2. In section 3 we explain the proposed (ADSDSS) architecture. A case study is presented in section 4. Finally, section 5 presents the conclusion and future work.
2.
P
REVIOUSW
ORKDSS is a rich discipline research area; many researchers try to enhance the capabilities of DSS by integrating it with other technologies like, GIS capabilities, Data warehouse, Data mining techniques and web technologies. Some researches focus on helping decision making process by monitoring a specific disease, like Jens Havskov Sorenson 2010 and their collages introduced the VetMet DSS for airborne animal diseases. A veterinary meteorological decision support system, VetMet, is developed in collaboration between Danish meteorological and veterinary research institutes and authorities. The system, which is implemented at the Danish Meteorological Institute, is used by the Danish Veterinary and Food Administration, which has the responsibility for prevention and control of animal diseases in Denmark. By estimating the risk of atmospheric spread of airborne animal diseases, including first of all foot-and-mouth disease, VetMet improves the preparedness and the disease eradication. The Internet-based system will be used for decision support regarding establishment of surveillance and eradication zones [3]. VetMet can describe both local spread of infectious airborne diseases between neighboring farms and long-range dispersion, including disease spread to or from other European countries.
The VetMet involves a long-range dispersion model, DERMA, and a short range model system, RIMPUFF, describing the airborne transmission of virus. The VetMet make use of high-resolution DMI-HIRLAM numerical weather prediction model data. The source of airborne virus is described by a virus production model, which uses as input epidemiological data from infected premises. The
descriptive analyses of infectious disease outbreak, manage resources (e.g. scheduling of patrol visits). Also, users can evaluate the effect of alternative control measures using a simulation model. EpiMAN was originally developed to manage data that is generated during the course of FMD outbreak [4].
Elfangary and their colleges introduced integrate data mining with data warehouse techniques to develop a system that is used to analysis and measures the effect of climate on animal production. This system first combines the animal diseases database (BOVIS) with the weather database using the data warehouses techniques. Then, a set of interested variables are selected and prepared to be used in mining. After that, this variables set is mine to discover the relation between weather and bovine diseases. This work uses the predictive data mining modeling (classification and regression). By discovering the relation between weather and bovine diseases, the system can predict when the occurrence of disease [5].
RADAR is a recently developed animal health DSS which has been used in the United Kingdom (UK) since 2003 [6]. RADAR brings animal diseases data and demographic data together in a standardized format to support research and the reporting requirements of a wide group of stakeholders like decision makers, veterinary staff and farm or animals owners. RADAR also contains current, accurate information about the number and location of animals. This allows a better understanding of animal disease in the UK and the risks posed by them. RADAR collects and integrates data from various existing systems and transforms them into a common coding system (Data warehouse) called the extraction, transformation and loading process (ETL). The system uses a variety of calculations and algorithms with metadata fully adherent to the UK government’s e-Government Metadata Standards to generate additional information from raw source data automatically [7].
3.
THE
PROPOSED
ADSDSS
A
RCHITECTURE3.1 Data Warehouse Component
This component is responsible for integrating different data sources into a repository data warehouse to enable generating integrated reports from these different sources. Data warehouse is a subject-oriented, time-variant, combined, and nonvolatile collection of data in assist of management’s decision-making process. It differs from transactional database in that, it is a big store of nonvolatile data and can be un-normalized database structure. Date warehouse gathers data from different data sources likes, databases, spread sheets, text files … etc. Data warehouse structure composes of fact tables and dimensions with various schemas, e.g. star schema and snowflake scheme. The preferred structure to improve the response and efficiency time of the Data Warehouse is the Star Schema. In star schema, data is maintained in a single fact table which is located at the center of the schema with additional dimension data tables, with all hierarchies collapsed [8].
In order to integrate different data sources into a repository data warehouse, the following steps are achieved:
a) Data Selection (Extraction): TADinfo, BOVIS and Weather databases contain many attributes which do not related to diseases. So, these databases were analyzed to select appropriate parts from both databases to be integrated in data warehouse. The diagnosis data mart was built using the most significant predictive attributes. b) Data cleaning: In this step, the data is analyzed
to ensure its quality. It includes removal of null values, redundancy data; complete the missing values, identification and correction of data inconsistencies.
c) Data unified: This step responsibility is to unify the used names for TADinfo and BOVIS databases to facilitate matching the data. For example renaming places and disorders names to be matched in all data.
d) Data transformation: in this step the selected data is transformed from the three databases formats into the new data warehouse format. e) Data loading: loading the data and storing them
into data warehouse.
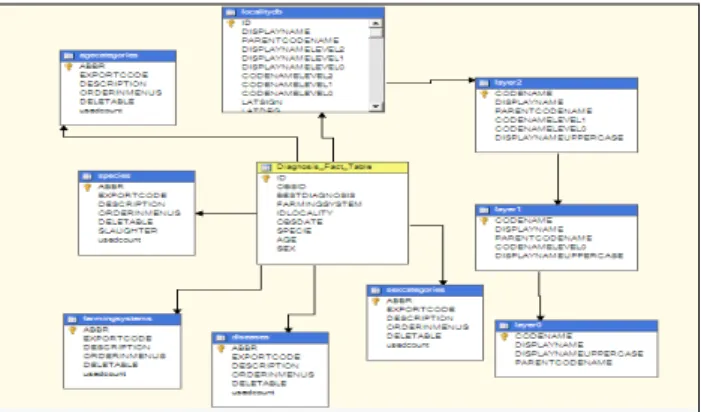
Figure 2 diagnosis data mart structure
The Diagnosis Data Mart is created with star schema structure which is diagnosis fact table and the related dimensions tables. Data Mart is a subset of data warehouse for specific department, group or business concern. Fig. 2 shows the diagnosis data mart structure.
3.2 OLAP Component
OLAP component built as a layer over the diagnosis data mart. OLAP component enables the decision maker to browse the data collected in the diagnosis data mart and view these data from different viewpoints. It has almost of OLAP capabilities such dicing, slicing, drill down and roll up. OLAP component not just create summaries about data and measures attributes, it also generates graphical charts and tabular data reports.
For building this component a diagnosis data cube was built from the diagnosis fact table and the other related dimensions tables. The interesting piece of information is the counts of sick animals or in other words the number of diagnosis cases, so “animal_count” attribute field was chosen to be the measure attribute in the diagnosis cube. Fig. 3 shows the structure of diagnosis cube and its dimensions and measures.
Figure 3 Diagnosis cube structure
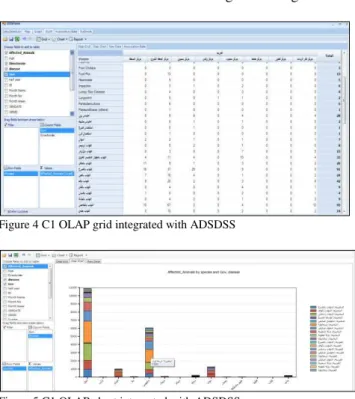
Recently, there are many third part tools and components for browsing OLAP cube data. Instead of building our one, we try to apply the software concept of reusability so we integrated a readymade and customizable component called Component One OLAP (C1 OLAP) with our ADSDSS. C1 OLAP enables decision maker to do the following [9]:
a) Browse the diagnosis cube data from different viewpoints as needed.
b) Drag and drop dimensions hierarchic (one or more) to calculate the measures related to these measures.
representing the selected data.
g) Print and export the generated data, reports and charts to (pdf) files and other file formats. Fig. 4 and 5 show examples of C1 OLAP Grid and Chart. As shown in Fig. 4, Decision maker can drag from the attributes that existing in the top left list to rows, columns and measures. The OLAP summarizes the relation between the selected fields as in the right OLAP grid.
Figure 4 C1 OLAP grid integrated with ADSDSS
Figure 5 C1 OLAP chart integrated with ADSDSS
3.3 Data Mining Component
Data mining component aims to discover knowledge from diagnosis data. The association data mining task is selected to be integrated with the ADSDSS. Since, association rules can help decision makers by finding the relationship between data items of some transaction. By applying association rules techniques to animal diagnosis data, association relationship between different data items can be found. The Apriori algorithm which is one of the most known association rules algorithms is implemented in the system. The following is the key concepts to apply Apriori algorithm:
• Frequent Itemsets: The sets of item which has minimum support (denoted by Li for ith-Itemset).
• Apriori Property: Any subset of frequent itemset must be frequent (i.e., if {AB} is a frequent itemset, both {A} and {B} should be a frequent itemset).
itself.
• Prune Step: Any (k-1)-itemset that is not frequent cannot be a subset of a frequent k-itemset. Pseudo-code:
Ck: Candidate itemset of size k Lk : frequent itemset of size k L1 = {frequent items};
For (k = 1; Lk !=∅; k++) do begin Ck+1 = candidates generated from Lk; For each transaction t in database do
Increment the count of all candidates in Ck+1 that are contained in t
Lk+1 = candidates in Ck+1 with min_support End
Return ∪kLk;
This algorithm finds the repeated patterns in the
transactions data and represents them as association rules. An association rules represented as:
X ⇒ Y [support = 2%, confidence = 70%]
Rule support and confidence are two measures of rule interestingness. They respectively reflect the usefulness and certainty of discovered rules. A support of 2% means that 2% of all the transactions under analysis show that X and Y come together. A confidence of 70% means that 70% of transactions which contain X also contain Y. Typically, association rules are considered interesting if they satisfy both a minimum support threshold and a minimum confidence threshold. These thresholds can be a set by users or domain experts [10]. In ADSDSS these thresholds and the data set can be defined by decision makers according to their needs.
In data mining component, Apriori algorithm implemented and integrated with C1 OLAP tool to enable decision maker to find association rules among various data items according to selected dimensions. Fig. 6 shows example of rules generated from the data mining component of ADSDSS.
3.4 GIS Spatial Analysis and Visualization Component
The main objective of this component is to analyze and visualize the diagnosis data according to geographical information on the map.
Geographic Information System (GIS) is a computer based information system. It is used to represent the geographic features present on the Earth' surface in a digitalized form which allows its analysis. GIS links database (tabular) information and locational (spatial) and enables a person to visualize relationships, patterns, and trends. This procedure gives a new viewpoint to data analysis which cannot be realized in a table or list format. GIS include of five components: Data, Hardware, Software, Methods and People. GIS provides spatial data entry, management, analysis, retrieval, and visualization functions [11-14].
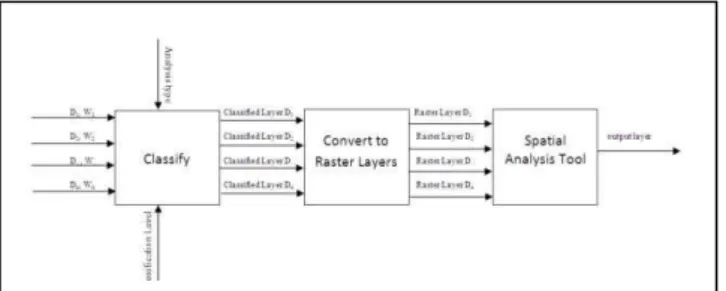
The spatial analysis phase uses a special map in (gdb) format. The geodatabase defines the generic model for geographic information. It is implemented as a group of files in a file system or a group of tables in a DBMS and consists of set of feature classes. These feature classes are homogeneous groups of common features, each has the same spatial representation, such as points, lines, or polygons, and a common set of attribute columns [14,15]. In Egypt, the feature classes are Governorate, Directorate and Village. The ArcObjects is used to represent these features, which is a set of platform-independent software components [18]. ArcObjects provides services to support GIS applications on the desktop – components to build our spatial analysis and visualization model used in ADSDSS. ADSDSS enables decision maker to analyze and visualize the spread of specific diseases on the map and highlight the maximum affected places. The spatial analysis and visualization model, which represented in Fig. 7 works as the following:
The model gets some input from the user. The input data for the model are: list of interesting diseases for analysis, list of weights – a weight is a numerical value represents the influence of each disease in the overall analysis of group of diseases - one weight for each disease, classification or analysis level which is the interesting location level (governorate, directorate and village), analysis type or the spatial analysis tool. User can also select just a subset of the diagnosis data not all the data according to some conditions as he/she wants. The model then works on the input parameters and the selected subset of diagnosis data. The model joins the diagnosis location data with the map location data according to the classification or analysis level parameter input from the
user. Data classified by simple data classifier using equal intervals approach. Equal intervals approach divides the range of possible values into equal-sized intervals. The entire range of data values (max - min) is divided equally into however many categories have been chosen. A vector based layer generated for each disease in which places classified according to the affected animals counts. These vector based layers converted to raster layers because most of spatial analysis tools works only on raster layers. The model then applies a spatial analysis tool on these raster layers according to the analysis type selected by the user. One raster layer generated as a result from the analysis tool and rendered to the user for visualization. The output layer indicates the regions of high affected animal counts with some colors and those of low affected animal counts with other colors. Decision maker can identify the most and the least affected places with one or group of diseases and hence can take right decision according to these observations. User then can save, print and export the map of diseases for other usage.
This process can be summarized as follow:
Decision maker selects one or more diseases, assigns weight for each one and define spatial analysis method.
The classifier in GIS component Generate classified layer for each disease.
GIS component convert each classified layer to raster layer.
GIS component Apply selected spatial analysis to the raster layers to generate one output layer.
GIS component Visualize the output layer to decision maker.
For each disease, a classified weighted layer is created according to analysis type, and then these layers converted to raster layers. After that a spatial analysis tool is applied to them to result one raster layer which influences the spread of all selected diseases as the following:
In weighted sum analysis: for each affected animals count with disease at classification level or place multiplied by the disease weight a disease layer created and classified according the new value. All diseases layers converted to raster then weighted sum spatial analysis tool applied to diseases raster layers. Fig. 8 shows an example for the generated layers.
Figure 8 Maps of 3 diseases and the weighted sum map of them
Figure 9 an Example of weighted sum calculations
The cell values are multiplied by their weight factor, and the results are added together to create the output raster. For example, consider the top left cell. The values for the two inputs become (2.2 * 0.75) = 1.65 and (3 * 0.25) = 0.75. The sum of 1.5 and 0.75 is 2.4.
Weighted Overlay analysis works the same way as weighted sum analysis. But in the classification step, the affected animals are classified into classes from 1 to 9 then weighted overlay spatial analysis tool applied. According to our meaning of classes places with large class numbers means large numbers of affected animals and vice versa. Fig. 10 shows that how weighted overlay be calculated. First, the cell values are multiplied by their percentage influence, and the results are added together to create the output raster. For example, consider the top left cell. The values for the two inputs become (2 * 0.75) = 1.5 and (3 * 0.25) = 0.75. The sum of 1.5 and 0.75 is 2.25. Because the output raster from Weighted Overlay is integer, the final value is rounded to 2 [16].
Figure 10 Raster weighted overlay calculation example
Table 1 shows the difference between the two types of overlay analysis.
Table 1 weighted sum vs weighted overlay
Weighted sum Weighted overlay
Function
Overlays several rasters, multiplying each by their given weight and summing them together.
Overlays several rasters using a common measurement scale and weights each according to its importance.
input rasters cell values
Integer or float Must be integer
The same value
Each value class in an input raster is assigned a new value based on an evaluation scale (1 to 9) weighted according
to its importance or its percent influence
weighted according to its importance or its percent influence
weights Any values
The sum of the percent influence weights must equal 100.
Output raster
maintains the attribute resolution of the values entered
Scaled values
direct knowledge-based component to discover the outbreak of selected diseases and show only the outbreak data place, time, affected animals count and the suggested treatments and decisions to manage that outbreak.
Decisions suggestion component find diseases outbreaks and suggest decisions and actions to deal with each outbreak for decision maker. Suggestions depend on disease and affected animal count. Knowledge of diseases outbreaks and how to deal with each situation (actions, treatments) acquired from domain experts. Knowledge represented as a group of rules. Rules take the format like that:
IF disease is “d1” AND affected animals count between “10” and “20” AND the Place level of “Village” AND specific time period from “1” to “7” days THEN “decisions 1, 2”.
These Decisions suggestion may be one or more of these suggestions:
Disease vaccination campaigns
Disease treatments and advices
Animals transfer management procedures.
Close animals markets.
Provide veterinary with treatments.
Get rid of the animals (Culling of infected animals).
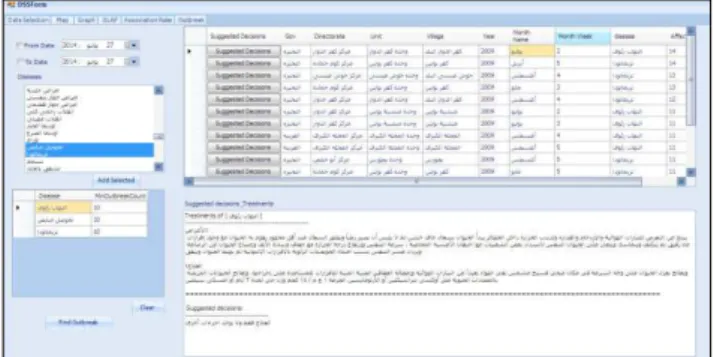
ADSDSS is a cooperative DSS as decision makers or domain experts can update the rules of decisions suggestion component and refine them from time to time according to their needs and the efficiency of the proposed decisions. Fig. 11 shows the main window of decisions suggestion component.
Figure 11 Decisions suggestion component main window
4
CASE STUDYDiagnosis data from two governorates namely: Algharbia and Elbehera were used to evaluate the developed ADSDSS. Data collected from different data sources like TADinfo, BOVIS and climate data. The following is a scenario for developing and using the ADSDSS:-
First, Decision Maker selects the specific criteria that meet his/her requirement. For example, Decision Maker can select TADinfo data source or BOVIS data source or both. From the selected data source, he/she selects the needed attributes like: diagnosis date, place, diseases. Also, the spatial analysis method is selected and visualization level. Decision Maker can assign weight for each selected disease according to its influence in the analysis process. After that, the data with some statistics Meta data can be shown. These statistics Meta data is about maximum and minimum numbers of affected animals in each place, standard deviation and median for each disease. Fig. 12 shows the selected criteria, data and the result statistics.
Figure 12 Data selection and statistical results
Decision maker can then view these results on the map according to the selected analysis type as in Fig. 13. Decision maker can save these maps as PDF format. ADSDSS generates classified map layer for each disease in which each place or the selected visualization level (governorate or district or village) assigned unique color. The most affected places with a disease to the least affected places assigned colors from red to green respectively.
ANSDSS provides decision maker with many types of charts that represent the selected data diseases. Decision maker can save, print and export these charts to many formats. Fig. 14 shows example of these charts.
ADSDSS has OLAP capabilities which enable decision maker to browse data from different views by dragging and dropping dimensions and measures, filtering specific data and highlighting specific values as in Fig. 3 and 4. ADSDSS include data mining component which enable decision maker to find the relationship between different data items. Data mining component uses a well-known association rules algorithm called Apriori algorithm which works on transactions data items which in our case the diagnosis transactions data. This algorithm requires from decision maker two parameter the item support and confidence rate. Data mining component works on data from diagnosis data mart selected directly from the data sources or through OLAP component. The rules resulted from this component depending on the data set, support rate and confidence rate. They all defined dynamically by decision maker.so that the relationships resulted from this component must be carefully checked and interpreted by decision maker. Fig. 15 shows an example of the resulted rules generated by Apriori algorithm. In this example we try to find the relations between diseases and animal sex for subset of data. We assign a value of 5.0 as a support rate and a value of 80.0 as a confidence rate, the algorithm gives us a result of 4 rules as shown in Fig. 15. Any changes of the data set or support value or confidence rate value will lead to different number of rules.so this all managed by decision maker himself.
Figure 15 an Example of Resulted Association Rules
A support of 14.18% for Rule number 1 in figure (5.10) (the first rule in the resulted rules) means that 14.18% of all the transactions under analysis show that (Idle ovaries) disease and (Female) sex are related together. A confidence of 99.15% means that 99.15% of the animals who affected with (Idle ovaries) disease are females. Decisions suggestion component enable decision maker to find diseases outbreaks places and time and provide him
Figure 13 map of affected animals’ counts/village for each disease
animals).
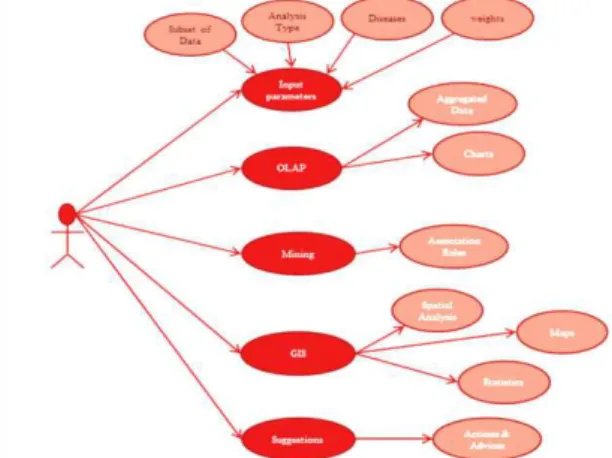
Fig. 11 shows the main window of suggestion component. User selects one or more disease to find its outbreak. This component allow decision maker to define the minimum affected animal count for each disease and for each location level which if exceeded that number then there is an outbreak there. For example at the level of village; user can set the minimum count of affected animals to be 10 with a time period of one week. It means that if the system find a village that contain 11 or more animals affected with the defined disease within a time period of one week then the system will declare the occurrence of outbreak. Fig. 16 shows the capabilities and outputs of each component of ADSDSS.
Figure 16 ADSDSS capabilities and outputs of each component
5
CONCLUSION
Many animal diseases outbreaks had appeared in Egypt in the last few years. Shortage of information about outbreaks like, the places of outbreak, and numbers of affected animals causes huge losses of animal livestock, meat and milk. Therefore, this paper has presented ADSDSS which utilizes the capability of GIS, data mining, data warehouse and OLAP to help decision makers in the process of making decision. ADSDSS helps decision makers to control the spread of animal diseases outbreaks. It enables decision makers to browse and view diagnosis data from different viewpoints and view different dimensions of data. The proposed ADSDSS provides the decision makers with the capability to represent and visualize the affected animals’ counts over different place levels (village, unit, directorate and governorate) and enables them to generate a map for disease(s) spread. Decision makers can use different types of spatial analysis to define the most and the least affected places with one or more diseases and the most and the least places appropriate for animal production and livestock activities or investment. ADSDSS provide
and be available for decision makers. More data mining techniques and algorithms can be applied. There are some simulation, risk and specific diseases infection models can be integrated with the system. Refinements and regular updates are needed for suggestion component knowledge base.
A
CKNOWLEDGEMENTSWe would like to thank General Organization for Veterinary Services (GOVS) that help us and provide us with the databases. Also many thanks to ESRI training team for training us on how to use their software.
REFERENCES
[1] FAO. 2011. Good Emergency Management Practices: The Essentials. Edited by Nick Honhold, Ian Douglas, William Geering, Arnon Shimshoni and Juan Lubroth. FAO Animal Production and Health Manual No. 11. Rome (available at www.fao.org/docrep/014/ba0137e/ba0137e00.pdf)
[2] FAO. 2012. Foot-and-Mouth disease caused by serotype SAT2 in Egypt and Libya: a regional concern for animal health in North Africa and the Middle East. EMPRES WATCH, Vol. 25, March
2012.Rome(available at
www.fao.org/docrep/015/an380e/an380e00.pdf).
[3] Jens Havskov, Søren Alexandersen, Poul Astrup, Knud Erik Christensen, Torben Mikkelsen, Sten Mortensen, Torben Strunge Pedersen, Søren Thykier-Nielsen, “Air Pollution Modeling and Its Application XIX-The VetMet Veterinary Decision Support System for Airborne Animal Diseases”, pp.199-207. 2008.
[4] L. Eisen and R. J. Eisen, "Using Geographic Information Systems and Decision Support Systems for the Prediction, Prevention, and Control of Vector-Borne Diseases", Annu. Rev. Entomol. 56:41–61, 2011.
[5] L. Elfangary, M. Hazman and A. Abdallah, “Mining the Impact of Climate Change on Animal Production”, International Journal of Computer Applications (0975 – 8887) Volume 59– No.18, December 2012.
and Rural Affairs (DEFRA), London, UK. Available as: http://archive.defra.gov.uk/foodfarm/farmanimal/
diseases/vetsurveillance/documents/vss-review-feb2011.pdf. 10/02/2014.
[7] Power, D. J. "A Brief History of Decision Support
Systems", World Wide Web,
http://dssresources.com/history/dsshistory.html, version 2.1, September 2002.
[8] A. Berson and S. J. Smith, “ Data Warehousing, Data Mining & OLAP”, Tata Mc Graw Hill Edition, Tenth Reprint 2007.
[9] Component One. Component One OLAP for winform - summary [Internet]. 2011. Available from: http://www.componentsource.com/
products/componentone-olap/summary.html.
[10] Jiawei Han, Micheline Kamber, Jian Pei , “Data Mining: Concepts and Techniques”, Morgan Kaufmann, 3rd edition, 2011.
[11] S. Gao, D. Mioc, F. Anton, X. Yi, D. Coleman, " Online GIS services for mapping and sharing disease information". Int. J. Health Geogr. 7:8., 2008.
[12] S. Hay, R. Snow," The Malaria Atlas Project: developing global maps of malaria risk", PLoS Med.3:e473, 2006.
[13] J. Jiang , P. Wang, W. Lung, L. Guo, and M. Li," A GIS based generic real-time risk assessment framework and decision tools for chemical spills in the river basin ", Elsevier B.V, 2012.
[14] UK Essays. Survey About Geographic Information Systems Tools Computer Science Essay [Internet].
November 2013. Available from:
http://www.ukessays.com/essays/computer- science/survey-about-geographic-information-systems-tools-computer-science-essay.php?cref=1.
[15] A. Abdoon. ESRI Geodatabase [Internet].2014.
available from:
https://www.academia.edu/6387099/ESRI_Geodatab ase.
[16] ESRI. Weighted overlay (spatial analyst) [Internet].
Available from: