Fruit Fly Optimization Algorithm for Network-Aware
Web Service Composition in the Cloud
Umar SHEHU
Department of Computer Science and Technology University of
Bedfordshire Luton, UK
Ghazanfar SAFDAR
Department of Computer Scienceand Technology University of Bedfordshire Luton, UK
Gregory EPIPHANIOU
Department of Computer Scienceand Technology University of Bedfordshire Luton, UK
Abstract—Service Oriented Computing (SOC) provides a framework for the realization of loosely coupled service oriented applications. Web services are central to the concept of SOC. Currently, research into how web services can be composed to yield QoS optimal composite service has gathered significant attention. However, the number and spread of web services across the cloud data centers has increased, thereby increasing the impact of the network on composite service performance experienced by the user. Recently, QoS-based web service composition techniques focus on optimizing web service QoS attributes such as cost, response time, execution time, etc. In doing so, existing approaches do not separate QoS of the network from web service QoS during service composition. In this paper, we propose a network-aware service composition approach which separates QoS of the network from QoS of web services in the Cloud. Consequently, our approach searches for composite services that are not only QoS-optimal but also have optimal QoS of the network. Our approach consists of a network model which estimates the QoS of the network in the form of network latency between services on the cloud. It also consists of a service composition technique based on fruit fly optimization algorithm which leverages the network model to search for low latency compositions without compromising service QoS levels. The approach is discussed and the results of evaluation are presented. The results indicate that the proposed approach is competitive in finding QoS optimal and low latency solutions when compared to recent techniques.
Keywords—Web Services; Service Composition; QoS; Network Latency; Cloud; Fruit Fly Algorithm
I. INTRODUCTION
Service Oriented Computing (SOC) is a paradigm for building loosely coupled distributed systems [14]. It encapsulates the functional units of a distributed system into web services which perform specific tasks and are easily reusable in other software systems. The true value of SOC lies in its ability to compose different services to complete more complex user requests. Web services are central to the realization of SOC. A web service is defined as a network-accessible object that provides some functionality [9]. Web services are characterized by functional and non-functional attributes [13]. The functional attribute dictates what kind of task a web service is meant to perform e.g. credit card validation. On the other hand, the non-functional attribute, also known as Quality of Service (QoS), indicates service’s level of quality. The QoS attribute is mainly used to differentiate services having similar functional attributes. Service providers normally advertise services together with
their QoS levels as part of a Service Level Agreement (SLA). Some service QoS attributes advertised includes cost, response time and reputation [15].
A. Qos-aware service composition
QoS-based web service composition has received a lot of attention from the research community. It allows organizations to share their business processes with other service providers to facilitate delivery of service functionalities which satisfy complex user requests.
In many situations, a single service may not be able to satisfy a user’s request. For instance, a web service is incapable of performing both credit card validation and hotel booking for a user attempting to plan a business trip. During such situations web services from different service providers are combined to meet the user’s requirements. This is where service composition comes into play. It is the process of aggregating web services having disparate functionalities into a composite service. The composition of services is performed via their functional and QoS attributes. The functional attributes define what a service is capable of doing while QoS attributes represent the non-functional or quality aspects of a service e.g. service availability, reputation, response time, etc. The QoS attributes are used for composition only when the services involved have comparable functionalities. The goal of service composition is to search for a combination of services that leads to optimal QoS levels. During the composition process, QoS attributes for services are aggregated according to a composition’s workflow pattern [2] into a composite service. Once a user request is issued, service composition breaks down the request into smaller tasks organized according to one of several workflow patterns [2]. Within each task, a number of functionally similar services offered by different service providers are made available for the aggregation process. In the next stage, a service is selected per task to form part of a composite service. As a result of the high number of services that currently exist on the Internet, there are large numbers of possible composition paths that can be formed. For example, suppose there exist eight tasks within a user request and each task can be executed by twenty possible web services. Then the total number of possible composition paths will be 208 (or 25.6 Billion. This constitutes a research problem of how to compose services in a short time such that the resulting composite service presented to the user has optimal QoS level and meets QoS constraints.
been defined as an NP-Hard problem [5]. The basis for our research was first presented in [6] where the authors propose an approach to tackling the service composition problem based on Linear Integer Programming (LIP). Their approach makes use of local search techniques in finding services for each function, and then combines these services into a composite service. Currently, Heuristic approaches have been developed to tackle the SCP. One such work is presented in [7] which introduces a heuristic approach based on genetic algorithm to solve the SCP. Their genetic algorithm (GA) encodes composite services as gene and then makes use of evolutionary selection, crossover and mutation operation to search for optimal compositions. Another work [8] employs a different heuristic approach based on particle swarm optimization algorithm (PSO) to solve the SCP. Their solution differs from [7] in the way the algorithm covers the search space in finding optimal compositions. Instead of utilizing genetic operators, PSO encodes compositions as particles which travel in the search space by updating their positions and velocities using the characteristics of the best particle. . In [19] a heuristic based on ant colony algorithm is presented to tackle the SCP where the authors consider multiple QoS attributes in finding composite services that meet user expectations. Many other heuristic approaches such as in [9] [10] [17] have been developed. While the service composition problem can be tackled optimally using meta-heuristics such as genetic, particle swarm and ant colony optimization algorithms, we adopt fruit fly optimization (FOA) algorithm to the SCP. To the best of our knowledge FOA has not been applied to the SCP before.
B. Service composition in the cloud
Cloud computing provides a platform for enterprises (Service providers) to deploy web services on cloud data centers so that internet users can access service functionalities. Generally, service composition in the cloud takes place across three layers: the infrastructure layer, platform layer and software layer. Once a user request is made, the request is sent to web services which are deployed on the software layer and offered by Software-as-a-Service (SaaS) providers. Underneath the software layer, service registries and composition engine are deployed on the platform layer. The service registry functions as a general repository for storing web services while the composition engine is responsible for aggregating web service into composite services. The infrastructure layer houses the datacenters necessary to support both platform and software layers. Several web services exist on the cloud. For example companies like Amazon and Microsoft provide cloud-based infrastructure and storage services via Amazon Web Services (AWS) and Windows Azure platforms respectively. Within the cloud, users can access different web services from literally any part of the world. Currently, there exist a large number of cloud-based data centers located across the globe. This has exponentially increased the number of possible network paths that can be formed in the search space. Another important issue in the cloud is the need for composite services to meet the QoS guarantees specified in the SLA between services providers and users. This will allow service providers to maximize their earnings while ensuring that user experiences of their services is optimized. Therefore QoS-aware web
service composition is critical to the delivery of quality cloud-based composite services on to customers.
When cloud-based web services from different locations are aggregated into a composite service, QoS of the network cannot be ignored. In situations where web services participating in a composition process are small in number, QoS of the network may not significantly affect the performance of a composite service. This is not the case when composition is taking place between large numbers of web services. QoS of the network usually defines the quality of network path between web service data centers. The quality of network paths can be measured using different network QoS metrics such as network latency or round-trip time (RTT) [3], network bandwidth [27], packet loss [25], jitter [26], etc. However, network latency is mainly used to represent QoS of the network because RTT measurements are easier to obtain than other metrics. In addition, occurrences of other metrics are relatively rare. In the cloud, the RTT of network path between web services is usually obtained using geographical location information already stored within each service’s data center. Also, the RTT between a web service’s data center and a user is obtained simply by measuring the RTT of the network path between the user and data center. RTT defines the time it takes for packets of data to move from a source to a destination and then back to the source.
Few studies have investigated impact QoS of the network on performance of service composition in the cloud. One such study is proposed in [11] where the authors develop a network-aware genetic algorithm that automatically optimizes compositions in the cloud. In their work they make use of a locality-sensitive hashing scheme coupled with a generic network coordinate system to find services that are close to certain network locations on the cloud. A similar study [18] employ an enhanced genetic algorithm which leverages KD-trees to search for services constituting low latency network paths within the cloud. Another approach in [23] presents a genetic algorithm that tackles service composition in a cloud-based geo-distributed network. In [24] an Ant colony optimization approach to service composition in cloud is proposed. Their approach makes use of greedy search coupled with ant colony algorithm to find minimum number of clouds that will partake in successful service composition. Our previous work in [1] introduces two network-aware composition algorithms for multi-objective QoS optimization in the cloud. One is based on a GA that utilizes k-means cluster to perform mutation of composite services by replacing them with other services in closer network locations. The second algorithm is based on multi-population PSO. PSO separates the particles into two populations. One population operates on web service QoS search space while the other population operates on network QoS search space. Particles from both populations then combine their best characteristics to form new particles.
Cloud A
Cloud B
Cloud C
Cloud D
Cloud location Task 1 Services
Task 2 Services Task 3 Services
Task 4 Services (a) Service deployments
QoS optimal pattern Latency optimal
pattern Task 1
Task 2
Task 3 Task 4
(b) QoS-optimal vs Latency-optimal patterns Fig. 1. Service deployments on the cloud
Both algorithms were fed by state-of-the-art network coordinate system to determine network distance estimation
between services in the cloud. Also, both approaches search for low latency compositions while adhering to strict user QoS constraints. However they make use of a similar network model which decomposes known latency measurements into coordinates prior to estimation process. The model then converts coordinates back to latency representation after estimation process and before they are fed to GA and PSO.
Despite the development of several meta-heuristic algorithms for solving SCP on the cloud, most of these techniques are not naturally compatible with network QoS metrics. For example previous algorithms [1, 11, 18] had to use special structures and computations which allow them to work with network models and perform latency-centric QoS optimization. This approach adds to the complexity and computation cost of the algorithms presented. It is therefore necessary to discover algorithms that are better suited to working with network latency while performing QoS optimization. To this end we present an enhanced fruit fly algorithm known as NFOA to search for low latency compositions with near optimal QoS. As a new meta-heuristic optimization algorithm, FOA is inspired by the behaviour of fruit flies in searching for food. FOA is easy to implement and consists of few adjustable parameters. Due to these merits, FOA has been successfully used in solving several NP-Hard optimization problems such as neural network optimization [21], financial distress [12] and more recently in scheduling problems [22]. A core characteristic of fruit fly optimization algorithm is its ability to encode solutions in form of two-dimensional network coordinates [12]. This property sets FOA apart from other meta-heuristic algorithms because it allows FOA to seamlessly work with network QoS metrics that are correlated to network coordinates such as network latency. The network coordinates employed by NFOA are obtained from our network model.
In summary, we propose an approach to network-aware service composition in the cloud. Our approach consists of the following contributions:
i. We adopt a network model that is supplemented by a state of the art network coordinate system. The model will be used to predict the network positions of web service data centers in the cloud.
ii. We present an enhanced fruit fly algorithm by adding capability to find services whose network positions are closer to each other and to the users while ensuring QoS is optimized. Consequently these services will result in low latency compositions. We compare our algorithm against current approaches. The results of our experiment demonstrate that our algorithm is competitive when compared to recent approaches in finding near optimal compositions.
II. PROBLEM FORMULATION
Service composition forms its basis from workflow management systems [2] where a complex user request is exposed as set of tasks that require one or more services to be completed. Hence the following definitions are used in this paper:
Definition 1 (Service). Service is a single unit meant for solving a particular functionality or task that is part of a user request. Services are published in the cloud by the service provider.
Definition 2 (Service class). Service class is a group of services having similar functionality but different QoS levels.
Definition 3 (Candidate service). Candidate service is a service that is part of a service class.
Definition 4 (QoS attribute). QoS attribute defines a given quality aspect of service. Some popular QoS attributes for services include cost, response time, reputation, reliability, etc.
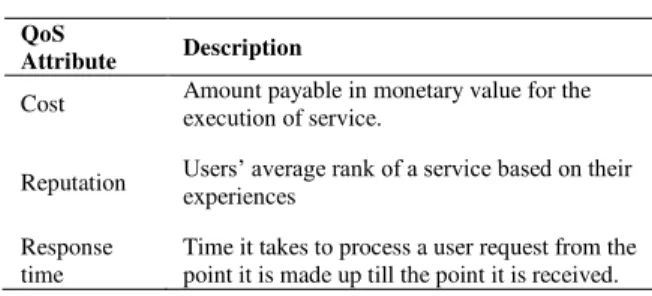
TABLE I. EXAMPLES OF SERVICE QOS ATTRIBUTES
QoS
Attribute Description
Cost Amount payable in monetary value for the execution of service.
Reputation Users’ average rank of a service based on their experiences
Response time
Time it takes to process a user request from the point it is made up till the point it is received.
Definition 5 (Network Latency). Defined as RTT from one source data center to another and then back to the source data center. In the case of a composite service, network latency is defined as end-to-end RTT from the first service’s data center in a given composite service to the last service’s data center then back to the first service.
Definition 6 (Workflow pattern). Workflow pattern dictates the direction in which data flows from one service to another within a composite service. Some major workflow patterns include sequence, parallel, exclusive choice and loop.
s
1s
2s
3s
4 (a) Sequence patterns
1s
4s
2s
3 (b) Parallel patterns
1s
4s
2s
3(c) Loop pattern Fig. 2. Workflow patterns for services s1, s2, s3, and s4
TABLE II. TYPES OF WORKFLOW PATTERNS
Workflow
pattern Synonym Description
Sequence Sequential
routing Executes a set of services sequentially Parallel AND-split Executes a set of services simultaneously
In Table 3, h represents total number of executions. Formulas presented in the table are used to obtain end-to-end values for QoS attributes. For instance, if our workflow pattern is the example show in Figure 3.
TABLE III. AGGREGATION FORMULAS FOR END-TO-END QOS OF COMPOSITE SERVICE
QoS attribute
Sequence
pattern Parallel pattern
Response
time
n
i
i
S
RT
1
)
(
( ),..,
1(
n)
Min RT S
RT S
OR
( ),..,
1(
n)
Max RT S
RT S
Reputation
1
(S )
n
i i
RP
n
1
( ),..,
(
n)
Max RP S
RP S
Cost
n
i i
S
C
1
)
(
n
i i
S
C
1
)
(
s
1s
2s
5s
3s
4s
6s
7Segment 1 Segment 2 Segment 3
QP
Fig. 3. Example workflow pattern
End-to-end cost (
Q
P) is computed by adding cost forservices in each segment of the workflow pattern. End-to-end response time on the other hand is computed by adding service response times in segments 1 and 3 to service with maximum response time in segment 2.
Definition 7 (Service composition problem). The Service composition problem is defined as follows:
Given a set of n interconnected tasks that are needed to satisfy a user requirement,
1, ,
2,
n
s
11s
12s
1k1s
21s
22s
2k2s
31s
32s
3k3s
n1s
n2s
nknt
2t
1t
3t
nS
1S
2S
3S
nFig. 4. Arrangement of candidate services into tasks
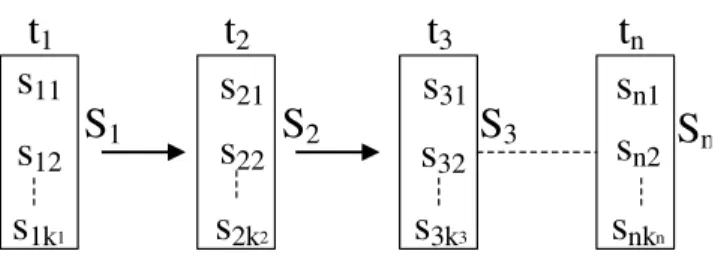
Each i-th task requires
k
i number of similar services (candidate services) that have the ability to complete the task (as seen in Figure 4),
1,
2,
,
i
i i i ik
S
s s
s
,
i
1
..
n
Where i identifies the service class in which similar services are grouped according to their task. Our service composition problem assumes that only one candidate service is selected per service class and bound to a task. We also assume that each service class has the same number of candidate services. Once all tasks have been bound a composite service C is formed,
1j,
2j,
,
3j
C
s s
s
,
j
1
..
k
Each service is advertised with its own QoS level in the SLA. In this study we consider the cost QoS attribute. As Table 3 shows, the end-to-end cost for a composite service is computed by aggregating individual cost for each service that forms part of the composite service. Thus,
1
( )
( )
n
P ij
i
Q C
P s
(1)
Where
Q
P represent end-to-end QoS value for composition cost. Also P represents candidate service QoS value for cost.Cost is normalized in the range [0 1] using (2). Where
f
pis normalized cost,
Max P
p( (S ))
i andMin P
p( (S ))
irepresent maximum and minimum QoS values for service class i respectively.
1
( (S )) -
( ( ))
( )
( (S ))
( (S ))
n
p i p ij
p
i p i p i
Max P
Q P s
f C
Max P
Min P
(2)
With respect to the QoS of the network, we assume that each web service is deployed on its own cloud data center for the sake of simplicity. Then end-to-end network latency for a composite service is defined as a vector of network coordinates
( )
E
.
1 1 2 2
( )
j,
j,
j,
j,
,
nj,
njE C
x
y
x
y
x
y
k
j
1
..
Where
x y
,
is the network coordinate of a service in the Cloud.The values of coordinates are obtained from the estimation of RTT by our network model.
Each service that is part of a composite service is represented by two dimensional network position as seen in Figure 5. Where
x
ijandy
ijare x-axis and y-axis coordinates of a services
ij.Y
-a
x
is
X-axis
s
12s
27s
33s
nj(X12,Y12)
(X27,Y27)
(X33,Y33)
(Xnj,Ynj)
Cloud 1 Cloud 2 Cloud 3
Cloud n
Workflow
Fig. 5. Services and their network positions
We model our optimization problem as a single objective optimization problem where the goal is to optimize fitness value (
F
);(3)
(
p, )
F
function f
E
Hence our service composition problem is to find a composite service that has optimal cost and near optimal network latency between constituent service network paths in terms of their network positions
( )
E
. Ideally this composite service will have selected a set of services deployed on Cloud locations that have the shortest end-to-end RTT without compromising cost QoS.III. NETWORK-AWARE SERVICE COMPOSITION ALGORITHM
A. Basic concept of fruit fly algorithm
The fruit fly optimization algorithm is a new type of evolutionary algorithm proposed in 2011. The algorithm mimics the behaviour of a fruit fly when it is searching for food as shown in Figure 6. A fruit fly is characterized by its acute sensing and perception abilities. This is said to be as a result of its osphresis organs [12]. Via the organs, a fruit fly is able to perceive food particles from several kilometres away. Once a fruit fly smells the presence of food, it closes in on the direction of the food in a hoping fashion. Each time the fly hops to a possible location, it tries to determine the next hoping direction that will take it to closer to the food source. Based on the behaviour exhibited by the fruit fly. We describe the steps required by the fruit fly optimization algorithm.
Y
-a
x
is
X-axis Origin (0,0)
Smell area
Hop direction (X1,Y1)
(X2,Y2) Fly position Fly distance
from origin Food Fruit Fly
Fig. 6. Food searching pattern of fruit fly
1) Initialize population
X and Y axes (
x
,y
) for a fruit fly swarm are first initialized;(
)
(4)
(
)
axis
axis
x
Init X
y
Init Y
Then individual positional coordinates of each fruit fly is initialized. For a fruit fly i,
()
(5)
()
i
i
x
x
rand
y
y
rand
2) Estimate Distance and Smell concentration judgment
value
Given that the exact position of the food is initially unknown, each fruit fly computes its distance (g) from origin (0,0) using (6), then the smell concentration judgment value (v) for every fruit fly is computed as the inverse of distance.
2 2
(6)
i i i
g
x
y
1
i i
v
g
(7)
3) Determine fitness value
The fitness value, also known as Smell concentration judgment function, is calculated as a function of smell concentration value (g).
( ) (8)
i i
F
function v
4) Determine best fruit fly
Compare fitness values of all fruit flies in swarm and determine fruit fly with the best fitness value.
[
best
Fbest
index]
max( ) (9)
F
5) Store attributes of best fruit fly
In order to compare fitness of best fruit fly against other fitness values subsequent iterations, the best fitness is stored in memory,
(10)
best F
Fit
best
Then the positions of the best fruit fly are stored as new X and Y axes for the fruit fly swarm,
(
)
(11)
(
)
index
index
x
X best
y
Y best
Best positions are used to update each fruit fly in the swarm according to equation (5). In the next iteration, steps 2 to 5 are repeated until either the maximum number of iterations is reached, or optimization is achieved.
B. Fruit fly algorithm for network-aware service composition
We proposed an enhanced network-aware fruit fly optimization algorithm called NFOA. Before we discuss our algorithm, we introduce the network model that feeds the algorithm with the network positions of web services that will take part in the composition process.
1) Network model
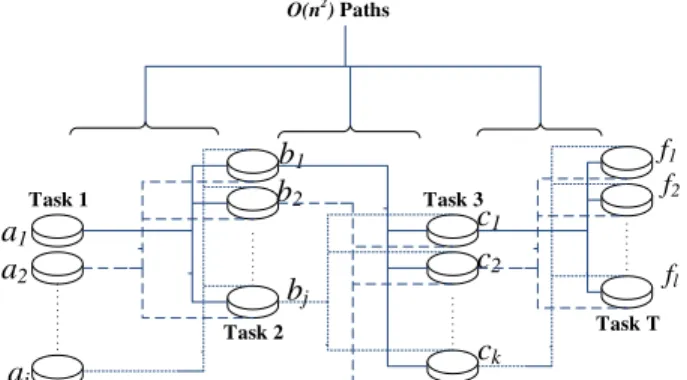
Traditionally, RTTs of network paths between a number of data centers are measured by physically sending ping packets between the data centers. This can be both time and resource intensive. For instance, given T number of interconnected tasks within a composite service (as seen in Figure 7), there exists O (n2) network paths that can be formed between them. Some research has been done to discover more efficient techniques for determining RTT between Internet nodes. Some of the techniques are based on Euclidean distance models (EDM) [29, 30] while others are based on matrix factorization models (MF) [31, 32].
a1
Task 1
Task 2
Task 3
Task T
a2
ai
b1
b2
bj
c1
c2
ck
f1
f2
fl O(n2) Paths
Fig. 7. Network of n web service nodes and O (n2) paths for a sequence of T sub-tasks in a workflow
We adopt a network model based on MF that efficiently estimates network latency between services in a cloud network. The model consists of a state of the art MF-based network coordinate system [31] that predicts RTT between web services on the cloud. The adopted network coordinate system works by only measuring RTT from each service location to a small subset of k neighbouring service locations on the cloud e.g. from S11’s data center (Cloud 1) to S21’s data center (Cloud 2) in Figure 8. The measurements are then used to estimate un-measured RTT to other locations in the form of network positions e.g. from S11’s data center (Cloud 1) to S23’s data center (Cloud 3). In mathematical terms, MF finds estimates of row matrix X and transposed column matrix Y
that minimizes estimation error (
) which is the difference between measured RTT values and predicted RTT values. TheX and Y matrices represent two dimensional network positions of services in the cloud.
i.
(
*
T) (12)
D
X Y
Where D defines an RTT matrix of both know and unknown measurements, while (X*YT) defines predicted RTT in the form of network positions. Once RTT between all service locations have been determined, X and Y network positions are fed to our fruit fly algorithm to find low latency and QoS optimal compositions. The MF algorithm for RTT estimation is outlined below.
Algorithm 1 MF Algorithm
Input: D, max_iter, k
Ouput: Dnew
1: [X, Y] = function MF(D) 2: { for(i =1: maxIter) 3: for(j =1: maxCS) 4: X rand(x) 5: Y rand(y)
6:
w [D – (X * YT)] 27: if (
is minimised) 8: Dnew X * YT9: return
10: endif 11: endfor 12: endfor 13: }
s11 s12 s13 s1k1
t1
t2
tn
Tasks
Candidate services per task
Fruit fly
s21 s22 s23 s2k2
sn1 sn2 sn3 snkn
Fruit fly representation of a composite service with n = 3
x11,y11 s11
s23
s31
x23,y23
x31,y31
Fruit fly CompositeService
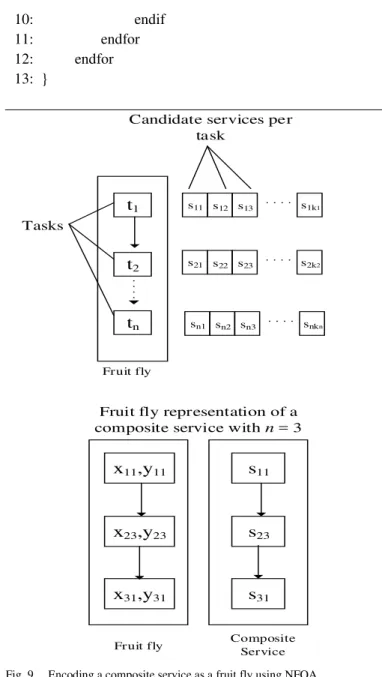
Fig. 9. Encoding a composite service as a fruit fly using NFOA
Cloud 1
Cloud 2
Cloud 3
Cloud 4
(x1,y1)
(x2,y2)
(x3,y3)
(x4,y4)
S11, S31
S21, S32,S12
S23, S33,S22
S13 d1-2 d’1-3 d1-4
RTT Matrix (D)
Cloud 1
Cloud 2
Cloud 3
Cloud 4
Cloud 1 Cloud 2 Cloud 3 Cloud 4
d2-1 d2-3 d2-4
d3-1 d3-2 d’3-4
d4-1 d4-2 d4-3
x1 ... x4
X =
y
……
1.
y4
Y T= *
Measured RTT( d )
Predicted RTT( d’ )
X-axis
R
T
T
P
re
di
ct
io
n
R
T
T
M
ea
su
re
m
en
t
Cloud network
Network coordinate system
Network positions
2) NFOA Algorithm
In this section we present network-aware fruit fly algorithm to tackle our service composition problem.
a)Initialize population
Firstly, each fruit fly in the swarm is initialized as a possible composite service. In this case, a fruit fly is encoded as a set of service coordinates where each service coordinate represents the network position of service within the cloud as seen in Figure 9.
b)Determine end-to-end Vector of network coordinates
and Cost QoS
Instead of randomly assigning coordinates to each service (as seen in step 1 of basic fruit fly algorithm), NFOA assigns network coordinates fed by our network model to each service. These coordinates will be a representation of the RTT between each service location in the cloud. Hence,
(13)
i
i
x
X
y
Y
Where X and Y represent network coordinates for a service obtained from MF algorithm.
Using this procedure, a vector of network positions
( )
E
is obtained for each fruit fly by aggregating the network positions of each service within the fruit fly. Then each fruit fly determines its end-to end smell concentration value (G) by combining individual smell concentration values (g) for all nservices in a fruity fly.
1
(14)
n
i i
G
g
The next step involves determination of end-to-end cost (
p
f
) by aggregating individual service QoS levels according to Equation (2).c)Estimation of end-to-end smell concentration
judgment function
Smell concentration judgment function is estimated for each service in a fruit fly (according to (7)) and then combined into end-to-end smell concentration judgment function for the composite service.
1
(15)
n
i i
V
v
d)Computation of fitness value
Both end-to-end smell concentration judgment function and end-to-end cost are used to compute the fitness value (F) for a fruit fly thus;
(16)
p
V
F
f
The last step involves storing the fruit fly with best fitness and then updating the coordinates of the each fly in the
population with that of the best fly. The process is repeated until maximum number of iteration is reached. Below outlines our NFOA algorithm.
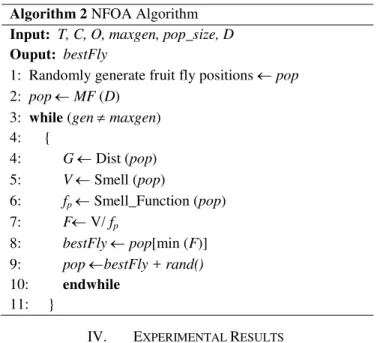
Algorithm 2 NFOA Algorithm
Input: T, C, O, maxgen, pop_size, D
Ouput: bestFly
1: Randomly generate fruit fly positions pop
2: pop MF (D) 3: while (genmaxgen) 4: {
4: G Dist (pop) 5: V Smell (pop)
6: fp Smell_Function (pop) 7: F V/ fp
8: bestFly pop[min (F)] 9: pop bestFly + rand()
10: endwhile
11: }
IV. EXPERIMENTAL RESULTS
Evaluations were run on a PC with Intel Core i7 processor with 2.8 GHZ CPU and 8GB RAM. Our algorithm and simulations were done on MATLAB 2014 environment. Meridian RTT dataset [20] was used to simulate a network of 650 unique data centers spread out in the cloud. Each location represents a web service position on the cloud. For the sake of simplicity, a sequence workflow pattern of 13 tasks and 20 candidate services per task is considered. This pattern considered is meant to simulate a realistically large service environment. Also, a single user location is considered in our cloud network. In our simulation, we consider the cost QoS attribute, although any other QoS attribute could be considered as this will not affect our experiments. Cost QoS values for every service is generated randomly with a Gaussian distribution within the range [1, 40].
NFOA algorithm is compared against state of the art service composition methods based on Genetic Algorithm (GA) [5] and Particle swarm optimization algorithm (PSO) [21]. Both GA and PSO are fed by our network model in order to estimate RTT of their solutions for the sake of comparing their optimality against NFOA. Table 4 presents the environment settings for our test algorithms.
TABLE IV. ALGORITHM SETTINGS
Parameters GA PSO NFOA MF
Population size 200 200 200 260
Number of generation 200 200 200 50
Crossover probability 0.9 - - -
Mutation probability 0.5 - - -
Tour size 2 - - -
Network model -MF MF MF -
Distribution index 20 - - -
Crossover operator Single
crossover - - -
Mutation operator Standard
Number of Tasks 13 13 13 13 Number of Candidate
services 20 20 20 20
Number of neighbours that measure RTT with each service
5
1) Fitness
We run our test algorithms over 200 generations. From Figure 10, we discover that the fitness value for NFOA converges after 100 generations. Also NFOA finds solution with the best fitness among the three test algorithms. This shows that NFOA’s natural ability to work with network coordinates makes it an ideal choice in searching for solutions with low latency and optimal QoS. The Figure also shows that NFOA has the ability to find a global solution and avoid being trapped in local optimum. This is attributed to the update strategy employed by NFOA which ensures that updates to x
and y network coordinates are widely distributed across the network coordinate search space. Table 5 shows the best fitness values obtained over five runs. The result demonstrates that NFOA obtained the best fitness in three of the five runs as highlighted by the bold values.
Fig. 10.Fitness versus Generation
TABLE V. EXPERIMENTAL RESULT FOR FITNESS
Runs NFOA. GA PSO
1 0.3467 0.4341 0.3273
2 0.4502 0.3520 0.2264
3 0.4458 0.3099 0.2065
4 0.4679 0.45207 0.2686
5 0.4336 0.3690 0.3966
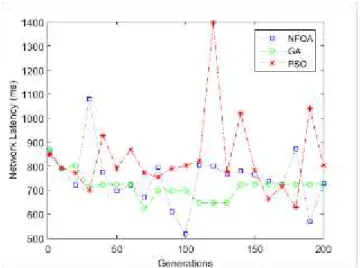
2) Network latency
In this experiment, we evaluate the network latency (RTT) solutions for each generation. Typically, the best algorithm will indicate the lowest RTT. From Figure 11, it is observed that the RTT converged at100-th iteration for NFOA which represents the best RTT while it converges at much higher values for GA and PSO. This further demonstrates NFOA’s superiority to other algorithms to in finding low latency solutions.
Fig. 11.Network latency versus Iterations
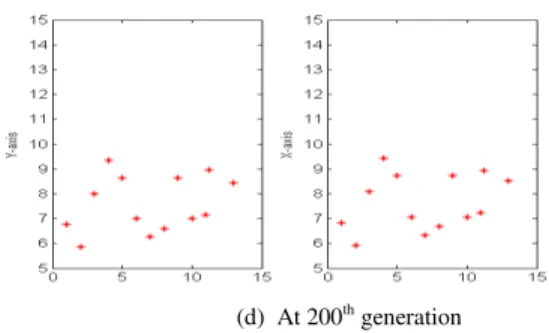
3) Best Fruit fly path
Figure 12 shows the best fruit fly’s path to optimization. Each point on the plot reflects the network positions of each web service that forms part of the best composite service. The graph demonstrates that, upon reaching the 200-th generation, QoS-optimal services that have shorter RTT from each other are constituted into the best fruit fly.
(a) At 5th generation
(b) At 50th generation
(d) At 200th generation
Fig. 12.Path of the best fruit fly
4) Computation time
As for computational efficiency, Table 6 shows that NFOA has the fastest average computation time when compared to GA and PSO. This is because since NFOA is already naturally built to handle optimization using network coordinates, it does not require additional structures and computations to work with our network model. This is not the case with PSO and GA which require additional computations that further worsen their execution times.
TABLE VI. AVERAGE COMPUTATION TIMES (IN SECONDS) OF THE FOUR ALGORITHMS
NFOA. PSO GA
48.42s 60.055s 109.24s
5) Number of RTT-measured neighbours
This experiment evaluates the impact of number of RTT-measured neighbours (k) on estimation error (
), computation time and quality of NFOA’s solutions. The estimation error will give us an idea of how accurate our compositions’ predicted RTTs are compared to their actual RTTs. In this experiment, we vary the value of k between 5 and 50 neighbours per service. In Figure 13(a), it is observed that as kis increased (i.e. the more neighbours each service measures its RTT to) the higher the latency value of the compositions. The reason for this effect can be seen from Figure 13 (b) which shows the variation of estimation error (
) with k. When the value of k is set to 5, it means that each service will measure RTT with small number (5) of its neighbours and then predict RTT with all the other services. This will ultimately reduce the prediction accuracy (i.e. increase the estimation error) for each composite service. On the other hand, setting k to 50 means increasing the number of the measured RTT paths to 50. This will lead to a higher prediction accuracy (i.e. lower estimation error) for each composite service. This result means that even if composite service latencies are lower when k is set at values below 20, they are the least accurate representations of true network latency of the compositions when compared to values above 20.(a) k vs Network latency
(b) k vs Estimation error
(c) k vs Computation time
Fig. 13. Effect of k on network latency, estimation error, and computation time
V. CONCLUSIoN
In this paper we propose an enhanced fruit fly optimization algorithm called NFOA that performs network-aware web service composition in the cloud. Fruit fly optimization a new approach for finding best solutions by mimicking the behaviour of the fruit fly. The number of services distributed on the Cloud has increased. Therefore the QoS of network has become important in determining performance of a composite service. We define a network model that estimates network latency in the form of service network positions with the aid of a network coordinate system based on matrix factorization called MF. MF measures RTT between a service and a small number of its neighbours then estimates the unknown RTT with other services in the cloud. MF feeds network positions of services to NFOA which uses them directly to find composite services with low latency and near-optimum web service QoS. Experimental simulations have shown that NFOA is superior to other meta-heuristic techniques in finding solutions with optimum fitness and latency.
REFERENCES
[1] U. Shehu; G. Ali Safdar; G. Epiphaniou; “Network-aware Composition for Internet of Thing Services” in Transactions on Networks and
Communications vol.3, no.1, pp 45-58 February 2015
[2] Jaeger, M.C.; Rojec-Goldmann, G.; Muhl, G., "QoS aggregation for Web service composition using workflow patterns," Enterprise Distributed Object Computing Conference, 2004. EDOC 2004. Proceedings. Eighth IEEE International , vol., no., pp.149,159, 20-24 Sept. 2004
[3] Rony Kay; “Pragmatic Network Latency Engineering Fundamental
Facts and Analysis,” cPacket Networks on vol., no., pp.1-13, 2009 [4] http://www.wired.com/2012/09/layers-of-latency/
[5] G. Canfora, M. D. Penta, R. Esposito, and M. L. Villani. An approach for QoS-aware service composition based on genetic algorithms. In GECCO ’05: Proceedings of the 2005 conference on Genetic and evolutionary computation, vol., no., pp 1069–1075, New York, NY, USA, 2005. ACM
[6] L. Zeng; B. Benatallah; M. Dumas; J. Kalagnanam; Q. Z. Sheng;,
”Quality Driven Web Services Composition,” In WWW '03: Proceedings of the 12th international conference on World Wide Web, vol., no., pp., 2003.
[7] Yilmaz, A.E.; Karagoz, P.; "Improved Genetic Algorithm Based Approach for QoS Aware Web Service Composition," Web Services (ICWS), 2014 IEEE International Conference on , vol., no., pp.463,470, 2014
[8] W. Yang; C. Zhang; ”A Hybrid Particle Swarm Optimization Algorithm for Service Selection Problem in the Cloud” International Journal of
Grid Distribution Computing, vol.7, no.4, pp.1-10, 2014
[9] A. Sawczuk da Silva; H. Ma; M. Zhang; “A GP Approach to
QoS-Aware Web Service Composition and Selection” in Springer Simulated Evolution and Learning vol.8886, no., pp.180-191 2014 [10] X. Wu; T. Wang; X. Qian; C. Zeng; “Multi-QoS aware automatic
service composition” in Springer Wuhan University Journal of Natural Sciences, vol.19, no.4, pp. 307-314, August 2014
[11] Adrian, K.; Fuyuki I.; Shinichi Honiden,"Towards network-aware service composition in the cloud," In Proceedings of the 21st international conference on World Wide Web (WWW '12). ACM, New York, NY, USA, on, vol., no., pp.959-968, 2012.
[12] Wen-Tsao Pan; “A new Fruit Fly Optimization Algorithm: Taking The
Financial Distress Model As An Example” In Elsevier Knowledge-Based Systems vol 26 no. pp.69-74 2012
[13] J. O’Sullivan; D. Edmond; A. T. Hofstede; “What’s in a service?” In Distrib. Parallel Databases, vol. 12, nos. 2–3, pp. 117–133, 2002
[14] L. Wengin; “Towards a Resilient Service-Oriented Computing based on Ad-hoc web Service Compositions in Dynamic Environments”, INSA Lyon, vol., no., pp.4-5, March 2014
[15] U.Shehu; G. Epiphaniou; G. Safdar;”A Survey of QoS-Aware Web
Service Composition Techniques”, In International Journal of Computer Applications vol.89, no.12, march 2014
[16] Landi, G.; Metsch, T.; Neves, P.M.; Mueller, J.; Edmonds, A.; Secondo Crosta, P., "SLA Management And Service Composition of Virtualized Applications In Mobile Networking Environments," Network In Operations and Management Symposium (NOMS) IEEE , vol., no., pp.1,8, 5-9 May 2014
[17] A. Younes; M. Essaaidi; A. Moussaoui;”SFL Algorithm for QoS-based
Cloud Service Composition”, In International Journal of Computer Applications, vol.97, no.17, pp.42-49, July 2014
[18]Klein, A.; Ishikawa, F.; Honiden, S., "SanGA: A Self-Adaptive Network-Aware Approach to Service Composition," in Services Computing, IEEE Transactions on , vol.7, no.3, pp.452-464, July-Sept. 2014
[19] Hui Liu; Dong Xu; Huaikou Miao, "Ant Colony Optimization Based Service Flow Scheduling with Various QoS Requirements in Cloud Computing," in Software and Network Engineering (SSNE), 2011 First ACIS International Symposium on , vol., no., pp.53-58, 19-20 Dec. 2011 [20] Wong, B.; Slivkins, A.; Sirer, E.; “Meridian: A lightweight network
location service without virtual coordinates,” In: Proc. the ACM SIGCOMM., vol., no., pp., 2005
[21] Ludwig, S.A., "Applying Particle Swarm Optimization to Quality-of-Service-Driven Web Service Composition," Advanced Information Networking and Applications (AINA), 2012 IEEE 26th International Conference on , vol., no., pp.613,620, 26-29 March 2012
[22] W.T. Pan; “Using Modified Fruit Fly Optimization Algorithm To
Perform The Function Test And Case Studies,” Connect. Sci., vol.25, no., pp. 151–160, 2013
[23] X. Zheng; L. Wang; S. Wang;”A Novel Fruit Fly Optimization Algorithm For The Semiconductor Final Testing Scheduling problem” Tsinghua National Laboratory for Information Science and Technology, vol.57, no., pp.95-103, 2014
[24] D. Wang; Y. Yang; Z. Mi;”A Genetic-based Approach to Web Service Composition in Geo-distributed Cloud Environment,” In Elsevier Journal of Computers and Electrical Engineering, vol., no.,pp.1-12, 2014 [25] Q. Yu; L. Chen; B. Li;”Ant Colony Optimization Applied to Web
Service Compositions in Cloud Computing,” In Elsevier Journal of
Computers and Electrical Engineering, vol.41, no.,pp.18-27, 2015 [26] Guohui Wang; Ng, T.S.E., "The Impact of Virtualization on Network
Performance of Amazon EC2 Data Center," INFOCOM, 2010 Proceedings IEEE , vol., no., pp.1,9, 14-19 March 2010.
[27] Kyoung Shin Park; Kenyon, R.V., "Effects of network characteristics on human performance in a collaborative virtual environment," Virtual Reality, 1999. Proceedings., IEEE , vol., no., pp.104,111, 13-17 Mar 1999
[28] Cong Ding; Yang Chen; Tianyin Xu; Xiaoming Fu, "CloudGPS: A scalable and ISP-friendly server selection scheme in cloud computing environments," Quality of Service (IWQoS), 2012 IEEE 20th International Workshop on , vol., no., pp.1,9, 4-5 June 2012.
[29] Hyuk Lim, Jennifer C. Hou, Chong-Ho Choi; “Constructing internet
coordinate system based on delay measurement,” IEEE/ACM Transactions on Networking, vol.13, no.3, pp.513-525, 2005
[30] Hyuk Lim, Jennifer C. Hou, Chong-Ho Choi; “Constructing internet
coordinate system based on delay measurement,” IEEE/ACM Transactions on Networking, vol.13, no.3, pp.513-525, 2005
[31] Liao, Yongjun. "Learning to predict end-to-end network performance.",
PhD Thesis University of Liege Belgium, vol, no., pp.38-43, 2013.