www.the-cryosphere.net/8/1031/2014/ doi:10.5194/tc-8-1031-2014
© Author(s) 2014. CC Attribution 3.0 License.
The sub-ice platelet layer and its influence on freeboard to thickness
conversion of Antarctic sea ice
D. Price1, W. Rack1, P. J. Langhorne2, C. Haas3, G. Leonard4, and K. Barnsdale5
1Gateway Antarctica, University of Canterbury, Christchurch, New Zealand 2Department of Physics, University of Otago, Dunedin, New Zealand
3Department of Earth and Space Science and Engineering, York University, Canada 4National School of Surveying, University of Otago, Dunedin, New Zealand
5Spatial Engineering Research Centre, University of Canterbury, Christchurch, New Zealand
Correspondence to:D. Price ([email protected])
Received: 17 January 2014 – Published in The Cryosphere Discuss.: 6 February 2014 Revised: 7 April 2014 – Accepted: 28 April 2014 – Published: 11 June 2014
Abstract.This is an investigation to quantify the influence of the sub-ice platelet layer on satellite measurements of total freeboard and their conversion to thickness of Antarctic sea ice. The sub-ice platelet layer forms as a result of the sea-ward advection of supercooled ice shelf water from beneath ice shelves. This ice shelf water provides an oceanic heat sink promoting the formation of platelet crystals which ac-cumulate at the sea ice–ocean interface. The build-up of this porous layer increases sea ice freeboard, and if not accounted for, leads to overestimates of sea ice thickness from surface elevation measurements. In order to quantify this buoyant ef-fect, the solid fraction of the sub-ice platelet layer must be estimated. An extensive in situ data set measured in 2011 in McMurdo Sound in the southwestern Ross Sea is used to achieve this. We use drill-hole measurements and the hydro-static equilibrium assumption to estimate a mean value for the solid fraction of this sub-ice platelet layer of 0.16. This is highly dependent upon the uncertainty in sea ice density. We test this value with independent Global Navigation Satel-lite System (GNSS) surface elevation data to estimate sea ice thickness. We find that sea ice thickness can be overestimated by up to 19 %, with a mean deviation of 12 % as a result of the influence of the sub-ice platelet layer. It is concluded that within 100 km of an ice shelf this influence might need to be considered when undertaking sea ice thickness investigations using remote sensing surface elevation measurements.
1 Introduction
1032 D. Price et al.: The sub-ice platelet layer and its influence on freeboard
density than consolidated ice, creates an additional source of buoyancy, resulting in an increase in sea ice freeboard. Currently the use of sea ice freeboard measurements from satellite altimetry is the only method to derive large-scale sea ice thickness estimates in the Antarctic (Kurtz and Markus, 2012). Using a freeboard measurement alone to estimate sea ice thickness under the hydrostatic equilibrium assumption could result in an overestimation of sea ice thickness – if the influence of the unknown sub-ice platelet layer thickness turns out to be significant. Further, spatial anomalies in sea ice thickness may be interpreted as indictors of the presence of a sub-ice platelet layer, which in turn may infer the pres-ence of supercooled ice shelf water (ISW) (Hughes et al., 2014). As it is very common for sea ice to abut ice shelves in the Antarctic (Bindschadler et al., 2011), and the extent and persistence of the sub-ice platelet layer is substantially unknown, we consider here the effects of this layer on esti-mates of sea ice thickness.
The estimation of remotely sensed sea ice thickness from freeboard information is based on altimetric methods. In the simplest sense the difference between altimetric measure-ments of the local sea surface height and the sea ice eleva-tion provides the freeboard, which can be used in conjunc-tion with snow depth and the densities of ice and snow to estimate sea ice thickness (Zwally et al., 2008; Kurtz and Markus, 2012; Price et al., 2013). The additional influence of the sub-ice platelet layer has not yet been considered. In order to assess this influence the solid fraction (sf) of the sub-ice platelet layer must be derived. Here sf defines the solid volume of ice per total volume and hence can be calculated from the buoyancy contribution of this layer to the sea ice cover above. The direct measurement of sf is complicated by the inaccessible environment beneath sea ice and the imme-diate alteration of its properties upon disturbance by drilling due to the unconsolidated nature of the layer. Previous inves-tigations have provided values from 0.2 to 0.5 for sf of the sub-ice platelet layer (Gough et al., 2012).
Here we firstly discuss deriving sf under the hydro-static equilibrium assumption and the influential components which must be considered. We then describe our in situ data set from McMurdo Sound in the southwestern Ross Sea (Fig. 1) and briefly describe the sea ice conditions (Figs. 2 and 3). Using this information we estimate a sf value (Fig. 4). We then focus on total freeboard (ice-plus-snow) measure-ments using Global Navigation Satellite System (GNSS) data to estimate sea ice thickness and, given our estimate of the sf, demonstrate how these GNSS-based estimates are influenced by the presence of a sub-ice platelet layer. Given that GNSS-based estimates of sea ice thickness follow the same princi-ples of surface elevation to thickness conversion as satellite altimeter measurements, we consider the observed effects to be applicable to both techniques. Equally, although we use a localised region to constrain our values, we expect the forma-tion of the sub-ice platelet layer to be similar in comparable areas of coastal Antarctic sea ice that abut an ice shelf.
There-Figure 1. (a) Location of the study area. (b) Envisat Wide Swath Advanced Synthetic Aperture Radar (ASAR) image (31 Au-gust 2011) of McMurdo Sound showing the first-year fast ice area. The McMurdo Sound Polynya (MSP) is driven by offshore winds from Ross Island (RI) in the east. Victoria Land (VL) and the Mc-Murdo Ice Shelf (MIS) are also identified.(c)Magnified view of red box in(b)with an ASAR image from 28 September 2011. Drill-hole measurement sites are indicated by white dots, those used for com-parison with the GNSS surveys by grey squares. The GNSS survey lines, Northern, Central, Southern and Eastern are indicated by the orange lines and tidal GNSS stations for tide correction by the green triangles. The 18 sites at which snow density was measured are in-dicated with blue circles; the 7 sites at which sea ice density was estimated using the hydrostatic equilibrium assumption are shown with “ρi” underneath the measurement site.
fore, conclusions about its influence may be considered at the larger scale.
2 Estimating solid fraction under the hydrostatic equilibrium assumption
To calculate the buoyant influence of the sub-ice platelet layer upon the sea ice cover above, sf must first be derived. Assuming hydrostatic equilibrium sf may be calculated as sf=−(ρw−ρi) Ti+(ρwSE)−(ρw−ρs)Ts
Figure 2. (a) Typical vertical profile through first-year sea ice in McMurdo Sound in austral spring, adapted from Gough et al. (2012). Surface elevation (SE) describes the combined protrusion of the ice freeboard (Fb) and snow cover (Ts) above sea level. Ice thickness (Ti) describes the sea ice formed from heat flux to the atmosphere along with the platelet ice which is the incorporated as the sea ice–ocean interface advances into accumulating platelets below. The sub-ice platelet layer accumulates beneath (Tp). Platelet crystals float freely in the water column below.(b)Graphical display of the drill-hole measurement site setup.
whereρw,ρi andρs are the densities of water, sea ice and snow respectively and Ti, Tp andTs are sea ice thickness, sub ice platelet layer thickness and snow depth respectively (see illustration Fig. 2). Surface elevation (SE) is the eleva-tion of the snow/air interface (or ice/air interface ifTs=0) relative to sea level. For our study all values were measured simultaneously at drill holes (see Sect. 3) for the derivation of sf apart fromρw,ρs andρi. We use a constant value of
1027 kg m−3forρwas there is little variability in observed
sea water density (0.1 %) in this area (Albrecht et al., 2006). Uncertainty inρwis therefore ignored. Forρswe use the
val-ues measured in the field at 18 sites in McMurdo Sound in November and December 2011 (Fig. 1) ranging between 281 and 461 kg m−3. At sites where no data are available we use the mean value of all the measurements of 385 kg m−3.
The selection of a value for ρi is complicated by the range in measurements from different techniques and the fact that sea ice density exhibits large natural variability. Timco and Frederking (1996) report mean ρi values for first-year (FY) sea ice in the range of 900 to 920 kg m−3.
Previous unpublished direct measurements of ρi in
Mc-Murdo Sound from one co-author (Langhorne) have been obtained via the displacement method in 1992, 1994 and 1996. The 160 measurements ofρiranged between 900 and
925 kg m−3, the mean of these previously unpublished data being 915 kg m−3. The ρi can also be estimated using the
hydrostatic equilibrium assumption. However, this must be carried out in areas where no sub-ice platelet layer is present.
Using this method in McMurdo Sound, Gough et al. (2012) reportρias 934 kg m−3. Using an amended method at seven of our measurement sites in 2011 (whereρiestimate for each site is the mean ofρi derived from five drill-hole measure-ments – see Fig. 2b) where no sub-ice platelet layer was measured we obtain a mean value of 927 kg m−3. The
lo-cations of these sites are indicated in Fig. 1. Given this in-formation, and considering the uncertainties, we use a value ofρi=925 kg m−3in our calculations which represents the
middle range of expectedρiin McMurdo Sound. We
evalu-ate and discuss the density-dependent sensitivity of sf in the following sections.
The total error for sf can be estimated by error propagation from Eq. (1) using (Drosg, 2009)
σsf=
ρwSE+ρsTs−ρwTs Tp(ρw−ρi)2 σρi
2
+−T1pσTi 2
+ ρw
(ρw−ρi)TpσSE 2
+ Ts
(ρw−ρi)Tpσρs 2
+
ρ s−ρw (ρw−ρi)TpσTs
2
+
−T12 p
ρwSE+ρsTs−ρwTs (ρw−ρi) −Ti
σTp 2
1/2
, (2)
where we expect random and independent measurement er-rors for σρi, σTi, σSE, σρs, σTs and σTp to be 10 kg m−
3,
1034 D. Price et al.: The sub-ice platelet layer and its influence on freeboard
by the spread of values recorded forρiin McMurdo Sound between 915 and 934 kg m−3. Theρsuncertainty is indicated
by the standard deviation of measurements carried out in 2011.
As we derive sf and σsf from SE,Ti,Tp,Ts andρs, the
collection of these measurements from a dedicated in situ fieldwork campaign in McMurdo Sound in November and December 2011 is described in the next section.
3 In situ investigation
An extensive drill-hole measurement campaign was carried out in November and December 2011 collecting information on freeboard, snow depth and snow density, sea ice thick-ness and sub-ice platelet layer thickthick-ness for FY sea ice in McMurdo Sound (Fig. 1).
3.1 Drill-hole measurements
Measurements were undertaken at 39 sites distributed across an area of approximately 1000 km2 in the southern Sound. Cross-profiles with 30 m transects were established at each site, and snow depths were measured at 0.5 m intervals with a ruler (Fig. 2). A mean snow depth for each site was derived from these 120 measurements. Freeboard, ice thickness and sub-ice platelet layer thickness were recorded at five loca-tions at each site, once at the central crossing point and at the end points of each transect (Fig. 2). The mean of these was then calculated and taken as representative of the site. Ice thicknesses were measured by using a tape measure with a brass T-anchor attached at the zero mark (Haas and Drucken-miller, 2009). This was deployed vertically through the drill-hole and allowed to rotate to a horizontal alignment when ex-iting the bottom of the drill-hole at the ice–ocean interface. From this position, and as described in Gough et al. (2012) the anchor is slowly pulled upward until some resistance is met and the first measurement is taken. This resistance is taken to mark the sub-ice platelet layer/ocean interface. The tape measure is then pulled harder, forcing the bar to pass through the sub-ice platelet layer until it sits flush against the sea ice/sub-ice platelet layer interface where a second mea-surement is taken. Snow density was measured at half of the drill-hole sites using a density tube and spring balance. Free-board, ice thickness and sub-ice platelet layer thickness and snow depth were interpolated between sites to produce thick-ness maps (Fig. 3) using a natural neighbour interpolation method with a maximum point separation of approximately 11 km.
3.2 Maps of sea ice and snow cover characteristics
Prior to our measurements in November and December 2011 the fast FY sea ice in McMurdo Sound experienced undis-turbed growth for a minimum of 5 months. There is a clear ice thickness gradient from east to west (Fig. 3). Thinner ice with a typical thickness of 1.5 m is commonplace in the east, particularly in the northeast, becoming gradually thicker to the west, where it reaches 2.5 m in thickness. This is sig-nificantly higher than the pack ice of the Ross Sea which typically has a thickness of 1 m or less (Worby et al., 2008; Kurtz and Markus, 2012). In comparison to other fast ice ar-eas, McMurdo Sound sea ice thickness is still greater than expected. Uto et al. (2006) report that land-fast FY ice in eastern Antarctica which had been growing for 4–5 months was typically up to 1.5 m in thickness. This is comparable to thicknesses in the northeast of McMurdo Sound. The mean sea ice thickness as derived from all 39 drill-hole measure-ment sites was 2.11 m. In the southwest, sea ice had been growing for approximately 7 months, two months longer than in the northeast. This is the first of three mechanisms likely responsible for the observed sea ice thickness distri-bution. The ISW plume is the second mechanism. The in-fluence of this plume on sea ice processes has been docu-mented in studies of sea ice structure and growth (Langhorne et al., 2006; Dempsey et al., 2010; Mahoney et al., 2011; Gough et al., 2012). Satellite altimeter observations have in-dicated that the locations of the largest increases in multiyear sea ice thickness from 2003–2009 during the NASA ICESat mission (Price et al., 2013) were coincident with the greatest abundance of platelet ice (Dempsey et al., 2010). This region has recently been identified as the location of an ISW plume (Robinson et al., 2014). The thickness and density distribu-tions revealed by a localised airborne freeboard and thickness investigation of the MIS margin in 2009 (Rack et al., 2013) are supportive of the emergence of such a plume into Mc-Murdo Sound. In 2011, sea ice in the west was comprised almost entirely of platelet ice (Hughes et al., 2014) as would also be expected from the presence of such a plume. The sub-ice platelet layer has an east–west distribution commensu-rate with the presence of this plume (Hughes et al., 2014). The layer is thickest where it protrudes from the MIS front between 165 and 165◦30′E, where it has been measured as 7.5 m in thickness (Figs. 3 and 5). As expected, the sub-ice platelet layer distribution closely follows the platelet distri-bution, as described by Dempsey et al. (2010). As it is not a solid structure and may be mobile, the sub-ice platelet layer thickness at a single location may be highly variable over short timescales of hours to days.
Figure 3.Interpolated maps of drill-hole measurements of(a)freeboard(b) ice thickness,(c)sub-ice platelet layer thickness (SIP) and
(d)snow thickness of first-year sea ice in McMurdo Sound in November and December 2011. These are overlaid upon an Envisat ASAR mosaic composed of two images from 25 and 28 November.
Figure 4.Solid fraction (sf) derived by Eq. (1) (black circles) and expected errors from Eq. (2) derived for 32 measurement sites. A linear fit is shown in black for this data set. The influence of varying sea ice density (ρi) is also displayed as linear fits for higher and lowerρivalues (no symbols plotted).
of McMurdo Sound. In 2011, the snow cover in the west and the central parts was patchy, with small-scale dune features with thicknesses in the order of decimetres and with exposed sea ice in many places. There is a clear east–west gradient in this pattern, contrary to the sea ice thickness pattern, with deeper snow in the east gradually becoming thinner to the west. In the east, where the snow is thicker, it acts as an insu-lating layer from the atmosphere, limiting sea ice growth. In the west where it is thinner or absent, greater heat flux to the atmosphere results, which in turn facilitates the formation of thicker sea ice.
4 The solid fraction in McMurdo Sound
Using our drill-hole measurements, the derived sf values us-ing Eq. (1) and the expected error (σsf) from Eq. (2) are shown in black in Fig. 4 withρi=925 kg m−3. The
deriva-tion of sf is especially sensitive if the sub-ice platelet layer is less than 2 m thick. Sites at which the sub-ice platelet layer is thin commonly produce negative sf values especially when
ρi<920 kg m−3. Using 32 of 39 sites in our investigation
1036 D. Price et al.: The sub-ice platelet layer and its influence on freeboard
andρi=935 kg m−3(orange line). This clearly demonstrates
firstly the dependence of sf estimates on ρi and secondly the high sensitivity of the sf calculation where the sub-ice platelet layer is thin.
5 Sea ice thickness from GNSS-derived surface elevation
GNSS elevation data were collected for positional and height information across the Sound. The GNSS-derived ellipsoidal heights, relative to WGS-84, were calibrated to produce total freeboard (ice-plus-snow) measurements, herein described as GNSS surface elevation (SEGNSS). This calibration was achieved by applying a correction value derived from com-parison of drill-hole measured surface elevation (SE) and all GNSS height measurements within 0.5 km of the drill-hole measurement. This altered the reference frame of the GNSS height data from the WGS-84 ellipsoid to elevation above local sea level and permitted surface elevation infor-mation to be recorded at increased spatial resolution along each of the four profiles: northern, central, southern and east-ern. Initially sampled at 1 Hz, the GNSS observations were averaged along-track resulting in a ground separation of ap-proximately 100 m. GNSS positions were established using the Precise Relative GNSS technique, referenced to the Scott Base base station located on Ross Island’s Hutt Point Penin-sula at 77.85◦S, 166.76◦E. After processing with Trimble Business Centre, mean horizontal and vertical precision were shown to be 0.04 and 0.09 m respectively. All data where the expected vertical precision was greater than 0.17 m were re-moved. This value was chosen as it removed erroneous data in the west where GNSS precision was lower due to the larger baseline distance (anything over approximately 40 km). In order to compensate for the tidal influence on the GNSS height and subsequently the SEGNSS retrieval, three
sepa-rate GNSS stations were deployed on the fast ice (see Fig. 1 for locations). These tidal stations logged height information at 30 s intervals, which was subsequently down-sampled to 10 min intervals. As the transit time of the mobile GNSS on the sea ice was hours, this information was used to correct the rover GNSS information for tidal height variation between drill-hole cross-over points. There was no discernible gradi-ent in the tidal signal between the three tidal GNSS stations. Changes in elevation due to tides were taken from the clos-est tidal GNSS station to the mobile observation to correct SEGNSSat the time of acquisition.
In order to derive sea ice thickness from SEGNSSwe need
to take into account the effect of the sub-ice platelet layer. Following Zwally et al. (2008) we estimate sea ice thickness without taking account of the sub-ice platelet layer (Tip)in
Eq. (3) and then taking account of it (Ti)in Eq. (4):
Tip= ρw
ρw−ρiSEGNSS−
ρw−ρs
ρw−ρiTs (3)
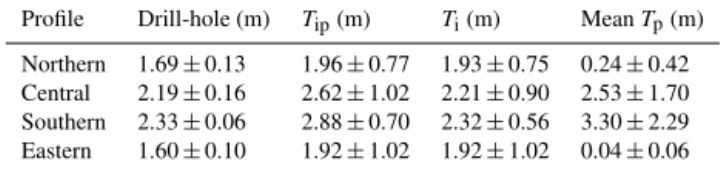
Table 1.The mean of all drill-hole measurements used along the profiles (n=20) of 2.00±0.31 corresponds better to a surface ele-vation derived sea ice thickness accounting for the sub-ice platelet layer (Ti) of 2.11±0.85 m, than one in which it is ignored (Tip) giving 2.39±0.99 m.
Profile Drill-hole (m) Tip(m) Ti(m) MeanTp(m) Northern 1.69±0.13 1.96±0.77 1.93±0.75 0.24±0.42 Central 2.19±0.16 2.62±1.02 2.21±0.90 2.53±1.70 Southern 2.33±0.06 2.88±0.70 2.32±0.56 3.30±2.29 Eastern 1.60±0.10 1.92±1.02 1.92±1.02 0.04±0.06
Ti= ρw
ρw−ρiSEGNSS−
ρw−ρs
ρw−ρiTs−Tpsf. (4)
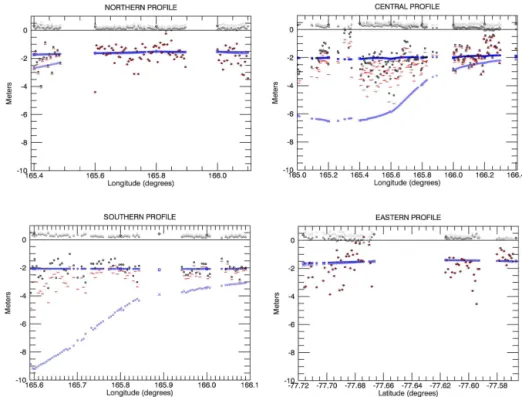
All density values described in Sect. 2 are used here with sf=0.16 as described in Sect. 4. Taking account of all the information described above, we calculated the sea ice thick-ness along four continuous GNSS surface elevation profiles using Eqs. (3) and (4) (Fig. 5), the mean estimates of which are shown in Table 1. These are compared to coincident mea-sured drill-hole thickness. Taking the mean for all of the pro-files the deviation from drill-hole measured sea ice thick-ness improves by 0.28 m when the sub-ice platelet layer is taken into consideration. The northern, central and south-ern profiles show a shift towards drill-hole sea ice thickness. The southern profile shows a drastic improvement from a mean deviation of+0.55 m in thickness neglecting the sub-ice platelet layer to−0.01 m when accounting for it. The cen-tral profile improves from a mean deviation of+0.43 m from the drill-hole measurements when estimatingTipto+0.02 m
when estimatingTi. The northern profile improves by 0.03 m
but still deviates from the drill-hole sea ice thickness mean by+0.24 m. This small change from Tip toTi is resultant of a negligible mean sub-ice platelet layer thickness of 0.24 m. The eastern profile shows no change as the platelet layer recorded there was very thin with a mean thickness of 0.04 m. The northern and eastern profiles both have a bias toward higher sea ice thickness estimates than measured at the drill-holes. This could be a result of the interpolations’ inability to capture the small-scale variability of the snow cover. This could result in underestimations of snow depth and subse-quently high sea ice thickness estimates.
Figure 5.The four profiles with GNSS-derived surface elevation (light grey), interpolated drill-hole derived sea ice freeboard (dark grey), sea ice draft (dark blue) and sub-ice platelet layer draft (light blue). Red dashes indicate sea ice draft as predicted by Eq. (3) taking no account of the sub-ice platelet layer, black circles indicate the estimated draft with consideration of the sub-ice platelet layer as estimated by Eq. (4). Drill-hole measurements of surface elevation (♦), sea ice draft () and sub-ice platelet layer draft (×) are also displayed for comparison with the interpolations.
σTi=
ρw
ρw−ρiσSEGNSS 2
+ρs−ρw ρw−ρiσTs
2
+Ts(ρs−ρw)+SEGNSSρw (ρw−ρi)2
σρi 2
+ Ts
ρw−ρiσρs 2
+ σTpsf 2
+ σsfTp 2
1/2
.
Here we estimate uncertainties in ρi and ρs to be 10 and
60 kg m−3 respectively as indicated by the standard devia-tions of field measurements. Ts andTp values used in the thickness calculation are from the interpolation of the mea-surement sites. Leave-one-out cross-validation was used with random selection to assess the accuracy of our interpola-tion method. Eight drill-hole sites were removed in turn and eight separate interpolations run. This procedure indicated a mean absolute deviation between the removed snow thick-ness measurement and subsequent interpolation of 0.05 m for Ts and 0.23 m forTp. These values are used for the
un-certainties in each thickness. The uncertainty in sf is 45 %. The main contributor to the error in sea ice thickness estima-tion from GNSS measurements is the accuracy of the GNSS surface elevation measurement itself. The mean GNSS verti-cal elevation uncertainty as indicated by the processing soft-ware is 0.09 m. At least 20 measurements are included in
our along-track averaging to 100 m spacing reducing the ran-dom error in surface elevation measurements to 0.02 m, i.e.
σSEGNSS= 0√.09
20. For a single GNSS measurement this
re-sults in an expected sea ice thickness error of 0.58 m once the sub-ice platelet layer has been taken into account.
6 Discussion
Using our drill-hole measurements we have indirectly esti-mated a mean solid fraction (sf) of the sub-ice platelet layer for McMurdo Sound of 0.16±0.07. This is lower than previ-ous estimates, but still within the uncertainty from Gough et al. (2012) of 0.25±0.06, who base their estimate on the mea-surement of heat fluxes. Our estimate is based on mean free-board and thickness measurements by applying the hydro-static equilibrium assumption. The primary systematic un-certainty in the sf estimation is sea ice density (ρi). Our result
uses a meanρivalue of 925 kg m−3. Under the same criteria
as described in Sect. 4 the mean sf varies from 0.03 to 0.36 givenρivalues ranging from 915 to 935 kg m−3respectively.
We used 925 kg m−3forρias it represents the middle range
of expectedρiin the study area. With this value an estimate
1038 D. Price et al.: The sub-ice platelet layer and its influence on freeboard
when undertaking the displacement technique. Assuming hy-drostatic equilibrium we derive 927 kg m−3for ρi, a higher
estimate in better agreement with the 934 kg m−3 reported
by Gough et al. (2012). We suggest 934 kg m−3 as an up-per bound toρi(Timco and Frederking, 1996) in McMurdo
Sound. Furthermore, under a simple measurement setup sur-face elevation could be slightly suppressed due to the loading of personnel and equipment near the drill-hole site. We found after testing this, that the sea ice surface may be suppressed by up to 0.01 m when such loading is present in close prox-imity to the drill-holes resulting in ρi overestimates of ap-proximately 5 kg m−3. We also suggest that a large number of measurements using our method are necessary as sea ice is not necessarily in hydrostatic equilibrium over very short spatial scales. We do not expect this to have significantly in-fluenced the mean of our freeboard values, and subsequently ourρiestimate, as most of our drill-holes were drilled at least 15 m away from such loading, and our estimate is based on an average of 35 separate drill-hole measurements (5 mea-surements at each site, 7 in total).
Though we have confidence that other sources of error play a smaller role, their influence cannot be entirely ignored. A 0.1 % uncertainty in water density (ρw)has been reported
by Albrecht et al. (2006). This results in a±1 kg m−3 varia-tion in reported meanρi. Any larger variations inρw would
result in a larger range in calculatedρi.
The estimate of sf for the sub-ice platelet layer has per-mitted the influence of the sub-ice platelet layer to be re-moved from sea ice thickness values derived from GNSS measurements of surface elevation. Without accounting for the sub-ice platelet layer, the mean deviation of estimated level ice thickness from drill-hole measured sea ice thick-ness is 0.39 m. Taking account of the sub-ice platelet layer the mean deviation is reduced to 0.11 m. Therefore, in areas of sea ice in close proximity to ice shelves it can be expected that thicknesses derived from freeboard or surface elevation may deviate from actual thickness by 12 %, with maximum deviations of the order of 19 % as a direct result of not ac-counting for a sub-ice platelet layer. In our study results may be improved along certain GNSS profiles with better snow depth information.
Platelet ice and sub-ice platelet layers have been docu-mented in many coastal Antarctic regions (Gough, 2012) making this link a key component of the Antarctic coastal sea ice regime. As the GNSS surface elevation sea ice thick-ness estimation operates under the same fundamental prin-ciples as satellite altimetry, this establishes an uncertainty in estimating sea ice thickness from satellite altimetry in prox-imity to ice shelves from the presence of a sub-ice platelet layer. Given that our estimate of sf is low in the range of re-ported values, the influence of the sub-ice platelet layer on sea ice thickness estimation from SE measurements could be even more significant. The variability of sf, both vertically through the sub-ice platelet layer and horizontally in a larger
spatial sense could not be quantified. This will also play a role in the error of the estimation of sea ice thickness.
7 Conclusions
We have used an extensive drill-hole measurement cam-paign to estimate a solid fraction value of 0.16 for the sub-ice platelet layer found under land-fast sea sub-ice in McMurdo Sound. Using this information we were able to quantify the error associated with using satellite surface elevation mea-surements to estimate sea ice thickness. Sea ice thickness was overestimated on average by 12 % in southern McMurdo Sound as a result of the buoyant influence of the sub-ice platelet layer on the sea ice cover above. The influence of the ice shelf is expected to extend beyond 200 km from the edge of the McMurdo Ice Shelf (Stevens et al., 2009). Platelet ice observations partly confirm this and have been recorded in sea ice cores 80 km north of the ice shelf edge (Dempsey et al., 2010). During fieldwork in 2013 the authors also mea-sured a sub-ice platelet layer of 0.20 m in thickness at ap-proximately the same distance. Though ice shelf water may still be influential on sea ice thickness out to and beyond 200 km, the sub-ice platelet layers thickness clearly dimin-ishes at such distances from the ice shelf margin. It is un-likely it still has a buoyant influence on the sea ice cover be-yond a distance of 100 km. We conclude that its influence may need to be considered in sea ice thickness investiga-tions using satellite altimetry within 100 km of ice shelves. It should be noted, however, that ice shelf thickness is likely influential on whether supercooled water and platelet crystals can reach the upper few metres of the ocean and interact with sea ice.
Sub-ice platelet layer formation results from the advection of supercooled ice shelf water from beneath the McMurdo and Ross Ice Shelf cavities providing an oceanic heat sink for sea ice formation. This heat sink contributes to sea ice thicknesses exceeding 2.5 m, at least double that of sea ice in pack ice areas of the Antarctic. Given the prevalence of ice shelves around the Antarctic and the fact that approximately 35 % of the Antarctic coastline is fringed by fast ice in aus-tral spring (Fraser et al., 2012), such interaction could be a primary driver of the sea ice thickness distribution near ice shelves. With adequate information on snow loading and us-ing these anomalies in recorded sea ice thicknesses it may be possible to map ice shelf water presence in coastal Antarctica using satellite altimetry measurements.
CryoSat cal/val project 4512. This work was carried out at Gateway Antarctica, University of Canterbury, Christchurch, New Zealand.
Edited by: J. Stroeve
References
Albrecht, N., Vennell, R., Williams, M., Stevens, C., Langhorne, P., Leonard, G., and Haskell, T.: Observation of sub-inertial internal tides in McMurdo Sound, Antarctica, Geophys. Res. Lett., 33, L24606, doi:10.1029/2006GL027377, 2006.
Bindschadler, R., Choi, H., Wichlacz, A., Bingham, R., Boh-lander, J., Brunt, K., Corr, H., Drews, R., Fricker, H., Hall, M., Hindmarsh, R., Kohler, J., Padman, L., Rack, W., Rotschky, G., Urbini, S., Vornberger, P., and Young, N.: Getting around Antarctica: new high-resolution mappings of the grounded and freely-floating boundaries of the Antarctic ice sheet created for the International Polar Year, The Cryosphere, 5, 569–588, doi:10.5194/tc-5-569-2011, 2011.
Bintanja, R., Van Oldenborgh, G. J., Drijfhout, S. S., Wouters, B., and Katsman, C. A.: Important role for ocean warming and in-creased ice-shelf melt in Antarctic sea-ice expansion, Nature Geoscience, 6, 376–379, doi:10.1038/ngeo1767, 2013.
Comiso, J. C., Kwok, R., Martin, S., and Gordon, A. L.: Variability and trends in sea ice extent and ice production in the Ross Sea, J. Geophys. Res., 116, C04021, doi:10.1029/2010JC006391, 2011. Dempsey, D. E., Langhorne, P. J., Robinson, N. J., Williams, M. J. M., Haskell, T. G., and Frew, R. D.: Observation and modeling of platelet ice fabric in McMurdo Sound, Antarctica, J. Geophys. Res., 115, C01007, doi:10.1029/2008JC005264, 2010.
Drosg, M.: Dealing with uncertainties: A guide to error analysis, Dordrecht, Netherlands, Springer, 2009.
Fraser, A. D., Massom, R. A., Michael, K. J., Galton-Fenzi, B. K., and Lieser, J. L.: East Antarctic landfast sea ice distri-bution and variability, 2000-08, J. Climate, 25, 1137–1156, doi:10.1175/JCLI-D-10-05032.1, 2012.
Gough, A. J.: Sea ice near and ice shelf, Doctor of Philosophy The-sis, University of Otago, Dunedin, New Zealand, 2012. Gough, A. J., Mahoney, A. R., Langhorne, P. J., Williams, M. J.
M., Robinson, N. J., and Haskell, T. G.: Signatures of super-cooling: McMurdo Sound platelet ice, J. Glaciol., 58, 38–50, doi:10.3189/2012JoG10J218, 2012.
Gow, A. J., Ackley, S. F., Govoni, J. W., and Weeks, W. F.: Physical and Structural Properties of Land-Fast Sea Ice in McMurdo Sound, Antarctica, in Antarctic Sea Ice: Phys-ical Processes, Interactions and Variability, edited by: Jef-fries, M. O., American Geophysical Union, Washington, D.C., doi:10.1029/AR074p0355, 1998.
Haas, C. and Druckenmiller, M.: Ice thickness and roughness mea-surements, in: Sea-ice handbook, edited by: Eicken, H., Univer-sity of Alaska Press, 2009.
Hellmer, H. H.: Impact of Antarctic ice shelf basal melting on sea ice and deep ocean properties, Geophys. Res. Lett., 31, l10307, doi:10.1029/2004GL019506, 2004.
Hughes, K. G., Langhorne, P. J., Leonard, G. H., and Stevens, C. L.: Extension of an ice shelf water plume model beneath sea ice with application in McMurdo Sound, Antarctica. J. Geophys. Res.-Oceans, submitted, 2014.
Kurtz, N. T. and Markus, T.: Satellite observations of Antarctic sea ice thickness and volume, J. Geophys. Res., 117, C08025, doi:10.1029/2012JC008141, 2012.
Langhorne, P. J., Purdie, C. R., Smith, I. J., Leonard, G. H., Kem-pema, E. W., Petrich, C., Gribble, M. A., Bond, P. E., and Haskell, T. G.: Antarctic landfast sea ice: the role of platelet ice, edited by: Saeki, H. (Ed.), in: IAHR International Symposium on Ice. Sapporo, Japan: Nakanishi Publishing Co. Ltd., 2006. Mahoney, A. R., Gough, A. J., Langhorne, P. J., Robinson, N. J.,
Stevens, C. L., Williams, M. J. M., and Haskell, T. G.: The sea-sonal appearance of ice shelf water in coastal Antarctica and its effect on sea ice growth, J. Geophys. Res., 116, C11032, doi:10.1029/2011JC007060, 2011.
Parkinson, C. L. and Cavalieri, D. J.: Antarctic sea ice vari-ability and trends, 1979–2010, The Cryosphere, 6, 871–880, doi:10.5194/tc-6-871-2012, 2012.
Price, D., Rack, W., Haas, C., Langhorne, P. J., and Marsh, O.: Sea ice freeboard in McMurdo Sound, Antarctica, derived by surface-validated icesat laser altimeter data, J. Geophys. Res.-Oceans., 118, 3636–3650, doi:10.1002/jgrc.20266, 2013.
Purdie, C. R., Langhorne, P. J., Leonard, G. H., and Haskell, T. G.: Growth of first-year landfast Antarctic sea ice determined from winter temperature measurements, Ann. Glaciol., 44, 170–176, doi:10.3189/172756406781811853, 2006.
Rack, W., Haas, C., and Langhorne, P. J.: Airborne thickness and freeboard measurements over the McMurdo Ice Shelf, Antarc-tica, and implications for ice density, J. Geophys. Res.-Oceans., 118, 5899–5907, doi:10.1002/2013JC009084, 2013.
Robinson, N. J., Williams, M. J. M., Stevens, C. L., Langhorne, P. J., and Haskell, T. G.: Evolution of a supercooled Ice Shelf Water plume with an actively growing subice platelet matrix, J. Geophys. Res. Oceans, 119, doi:10.1002/2013JC009399, 2014. Spreen, G., Kern, S., Stammer, D., Forsberg, R., and
Haarpaintner, J.: Satellite-based estimates of sea-ice vol-ume flux through fram strait, Ann. Glaciol., 44, 321–328, doi:10.3189/172756406781811385, 2006.
Stevens, C. L., Robinson, N. J., Williams, M. J. M., and Haskell, T. G.: Observations of turbulence beneath sea ice in south-ern McMurdo Sound, Antarctica, Ocean Sci., 5, 435–445, doi:10.5194/os-5-435-2009, 2009.
Timco, G. W. and Frederking, R. M. W.: A review of sea ice density, Cold Reg. Sci. Technol., 24, 1–6, 1996.
Trodahl, H. J., McGuinness, M. J., Langhorne, P. J., Collins, K., Pantoja, A. E., Smith, I. J., and Haskell, T. G.: Heat transport in McMurdo Sound first-year fast ice, J. Geophys. Res.-Oceans., 105, 11347–11358, doi:10.1029/1999JC000003, 2000.
Uto, S., Shimoda, H., and Ushio, S.: Characteristics of sea-ice thick-ness and snow-depth distributions of the summer landfast ice in Lützow-holm Bay, East Antarctica, Ann. Glaciol., 44, 281–287, doi:10.3189/172756406781811240, 2006.
Worby, A. P., Geiger, C. A., Paget, M. J., Van Woert, M. L., Ackley, S. F., and Deliberty, T. L.: Thickness distribution of Antarctic sea ice, J. Geophys. Res., 113, C05S92, doi:10.1029/2007JC004254, 2008.