THE INFLUENCE OF CORPORATE SPECIFIC FACTORS UPON FINANCING DECISIONS
LăcătuşViorel-Dorin, VăideanViorela-Ligia, CuceuIonuţ-Constantin
Department of Finance, Faculty of Economics and Business Administration, “Babeş -Bolyai” University Cluj-Napoca, Romania
[email protected] [email protected] [email protected]
Abstract: The purpose of this paper is to analyze the existing theories for the capital structure of a corporation and to determine the factors that influence the financing decisions of Romanian corporations. The gearing ratios vary a lot among Romanian corporations pointing out the fact that the internal specific factors are the ones with a greater impact upon their capital structure, and not the external factors. Our empiric research evaluates the determining factors for the debt ratio (total debt/total assets) of some Romanian corporations, focusing on its explanatory variables by including them within simple and multiple econometric models. The panel data indicators computed for the companies in the Cluj area listed on the Bucharest Stock Exchange were evaluated with the OLS and FEM techniques.The results have been interpreted, pointing out that company size and asset turnover seem to have a positive influence upon the debt ratio of selected companies, while profitability and liquidity seem to influence the debt ratio of selected companies negatively.
Keywords:capital structure, debt ratio, theories of capital structure, determinants of capital structure, empirical data.
JEL classification:G32.
1. Introduction
The capital structure of a company represents the way that company finances its assets through some combination of equity and debt, of own and borrowed funds. Basically, capital structure policies involve a trade-off between risk and return. Besley and Brigham (2011) argue that „using more debt raises the riskiness of the firm’s earnings stream, but a higher proportion of debt generally leads to a higher expected rate of return. A higher risk associated with greater debt tends to lower the stock’s price. Therefore, the optimal capital structure of a company is utmostly considered to be the one that strikes a balance between risk and return to achieve the ultimate goal of maximizing the price of the stock.”
Generally, capital structure decisions are considered to be influenced by six primary factors:
the firm’s business risk - the greater the firm’s business risk, the lower the account of debt that is optimal.
the firm’s tax position. A major reason for using debt is that interest is tax deductible, which lowers the effective cost of debt.
thefinancial flexibility, i.e. the ability to raise capital on reasonable terms under adverse conditions.
are more inclined to use debt in an effort to boost profits.
thegrowth rate. Firms that are in the growth stage of their cycle typically finance that growth through debt, borrowing money to grow faster. The conflict that arises with this method is that the revenues of growth firms are typically unstable and unproven. As such, a high debt load is usually not appropriate. More stable and mature firms typically need less debt to finance growth, as its revenues are stable and proven.
themarket conditionscan also have a significant impact on a company's capital-structure condition.
These six points widely discussed by the specialised literature on the field largely determine the target capital structure of a company, but operating conditions can cause the actual capital structure to vary from the target at any given time.
2. Literature Review
The optimal capital structure of an entity has raised major debates in the last tens of years, and as a result there exist numerous capital structure theories, ranging from the works of Modigliani and Miller (1958) to the trade-off theory of Kraus and Litzenberger (1973) and pecking order theory of Myers and Majluf (1984) and furthermore towards the agency theory and the market timing theory.
Among a great variety of foreign specialists, some Romanian authors have also investigated these theories in detail, such as Mihalca G and Antal R (2009) that have analysed the trade-off and pecking order hypotheses on the Romanian market empirically, on a sample of non-financial Romanian firms, listed on the Bucharest Stock Exchange (BSE) from 2005 to 2007. Using a panel data analysis, they found that the pecking order theory could be successfully applied to the Romanian market, as the Romanian profitable firms with a high proportion of tangible assets have a lower debt ratio.
Several determinants of the capital structure of a corporation among manufacturing companies listed on BSE have been analysed by Vătavu S.(2012), her findings establishing size as the main financial indicator with significant impact on the capital structure of companies operating in the manufacturing industry.
The specialized literature classifies the determinants of the capital structure of a corporation into two large categories:external factors, reflecting the macroeconomic conditions specific to every country (such as economic growth, inflation, interest rate etc) andinternal factors, specific to each and every corporation, such as the size of the company, its assets’ tangibility, its profitability and liquidity, the assets’ turnover, its investment opportunities and others.
3. Methodology and Data
Our paper investigates the influence of corporate specific factors upon the financing decision of thirteen companies performing in the Cluj-Napoca area and listed on the BSE, acting within different fields of activity. The capital structure of these economic entities has been studied as a function of different internal factors.
the size of the company was considered as an independent variable, measured as a natural logarithm of the company’s total assets. We expect a positive correlation. Then, we have considered asset tangibility as another independent variable, computed as the ration between tangible fixed assets and total assets, and further expecting either a positive or a negative correlation. The fourth explanatory variable is the liquidity of the company, determined as the ratio of cash and current accounts to total assets and the fifth explanatory variable of this study is the assets’ turnover, computed as total sales divided by total assets.
Our study focuses on the econometrical modelling of the debt ratio of Romanian companies through simple and multiple regressions, using panel data. The study uses a data basis constructed with the help of BSE data for companies listed during the 2009-2011 time period, comprising 39 observations for each independent variable and for the dependent variable as well. The authors have restricted the research area upon the listed companies of Cluj county. These panel data were processed using the Gnu Regression, Econometrics and Time-series Library (Gretl) software, using both the Ordinary Least Squares (OLS) and Fixed Effects Model (FEM) techniques.
Firstly, we obtained several simple linear econometric models, of the form: yt= a + bxt+ εt,
where:
yt= the debt ratio of companiesnotDebtRatio;
xt= several independent variables;
εt= residual variable
The independent explanatory variables used in this study are the ones mentioned above: the profitability of the company, its size, asset tangibility, liquidity and asset turnover.
Furthermore, the linear multiple econometric model is considered to be of the following shape:
yt= a + bx1t+ cx2t+ dx3t+ ex4t+ fx5t+ Ɛt,
where:
yt= the debt ratio of companiesnotDebtRatio;
x1t= the profitability of company i at time t, x1tnotProfitability;
x2t= the size of the company, x2tnotCompanySize;
x3t= theassets’ tangibility, x3tnotAssetTangibility.
x4t= the liquidity of the company, x4tnoLiquidity
x5t= the assets’ turnover, x5tnotAssetTurnoveri
From an econometric point of view, the existence of individual effects imposes the choice for an estimation method that would produce non-shifted results. Where there are individual effects and they are correlated with the independent variables, the OLS estimation produces shifted and inconsistent results, which we didn’t quite agree with. Under these circumstances, it would be recommended to use an estimation method that takes into account the presence of individual effects and that produces non-shifted results, such as the FEM.
4. Simple regressions–results and interpretations
At first, the following simple models were considered for estimation using linear regressions on the panel data for the analysed companies:
Model no 2: , - the size of the company
Model no 3: , -the assets’ tangibility
Model no 4: , -the liquidity of the company
Model no 5: , -the assets’ turnover
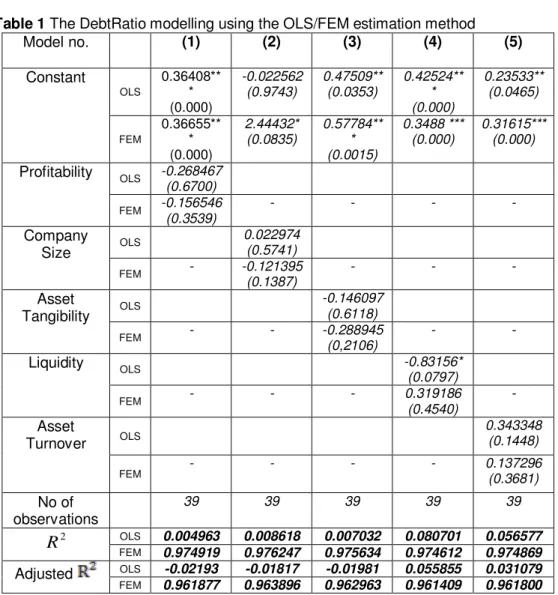
Table 1The DebtRatio modelling using the OLS/FEM estimation method
Model no. (1) (2) (3) (4) (5)
Constant
OLS
0.36408** * (0.000)
-0.022562 (0.9743)
0.47509** (0.0353)
0.42524** * (0.000)
0.23533** (0.0465)
FEM
0.36655** * (0.000)
2.44432* (0.0835)
0.57784** * (0.0015)
0.3488 *** (0.000)
0.31615*** (0.000)
Profitability OLS -0.268467 (0.6700)
FEM -0.156546 (0.3539)
- - -
-Company
Size OLS
0.022974 (0.5741)
FEM - -0.121395 (0.1387)
- -
-Asset
Tangibility OLS
-0.146097 (0.6118)
FEM - - -0.288945
(0,2106)
-
-Liquidity OLS -0.83156*
(0.0797)
FEM - - - 0.319186
(0.4540)
-Asset
Turnover OLS
0.343348 (0.1448)
FEM - - - - 0.137296(0.3681)
No of observations
39 39 39 39 39
2
R
OLSFEM 0.0049630.974919 0.0086180.976247 0.0070320.975634 0.0807010.974612 0.0565770.974869Adjusted OLS -0.02193 -0.01817 -0.01981 0.055855 0.031079
FEM 0.961877 0.963896 0.962963 0.961409 0.961800 Source: Authors’ processing in Gretl
After estimating the models’ coefficients, the following simple regressions were obtained with the FEM technique:
Model no 1 DebtRatioit= 0.355655 -0.156546 Profitabilityit
Model no 2 DebtRatioit= 2.44432 -0.121395 CompanySizeit
Model no 3 DebtRatioit= 0.577847 -0.288945 AssetTangibilityit
Model no 4 DebtRatioit= 0.348803 +0.319186 Liquidityit
Model no 5 DebtRatioit= 0.316152 +0.137296 AssetTurnoverit
The above presented regressions may be interpreted as follows:
Model no 1: For a one unit increase ofProfitabilityit, theDebtRatioitwill decrease, on
average, with0.156546units.
Model no 2: For a one unit increase ofCompanySizeit, DebtRatioitwill decrease, on
average, with0.121395units.
Model no 3: For a one unit increase of AssetTangibilityit, the DebtRatioit will
decrease, on average, with0.288945 units.
Model no 4: For a one unit increase of Liquidityit, theDebtRatioit will increase, on
average, with0.319186 units.
Model no 5: For a one unit increase ofAssetTurnoverit, theDebtRatioitwill increase,
on average, with0.137296units.
Table 1 compares the and the adjusted of these models. The negative values for the adjusted might point out towards some useless regressors in the model. We may notice that the adjusted reaches the maximum value of 0.963896 for model no 2. We may further say that x2itrepreseting the size of the company would
have the highest explanatory power and model no 2 is the most representative among the other studied models. Still, by taking into account the p-values, the only significant coefficient is that of liquidity with OLS, in model no 4.
5. Multiple regressions–results and interpretations
Furthermore, we have considered multiple regression models, for the DebtRatio as the dependent variable and the above mentined independent variables, on turns. We have estimated the coefficients of these models and we have compared the values obtained for the adjusted . The model having the maximum adjusted points out the fact that the independent variable used for that regression has the highest explanatory power. To follow, it will be considered for another series of multiple models, together with another independent variable, and so on. Knowing that an adjusted that increases as we add more independent variables in the model points out that the explanatory power of the regression increases, we have obtained the models presented in Table 2.
Summing up, the relationships between the explanatory variables and the DebtRatio as a dependent variable for the Cluj area companies listed on the BSE, we may conclude that the following relationships were validated:
a positive relationship between company size and its debt ratio; a positive relationship between asset turnover and the debt ratio; a negative relationship between profitability and debt;
a negative relationship between liquidity and debt.
Table 2The DebtRatio modelling through multiple regressions:
Source: Authors’ processing in Gretl
Note: Within parentheses there are the p-values, and *** designates the 1% significant coefficients, ** designates the 5% significant coefficients while * designates the 10% significant coefficients.
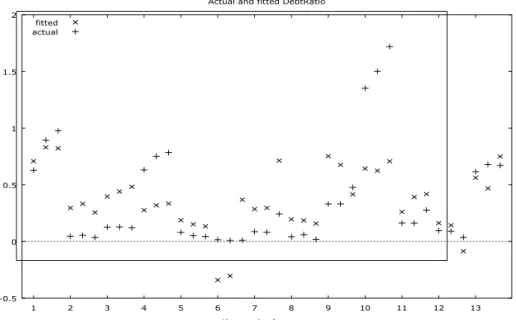
We have graphically represented the experimental values in dark grey +and the ones adjusted by the optimum chosen model (Model no 10) in light grey ×, processing the data with the Gretl software, according to Figure 1:
Model
no (6) (7) (8) (9) (10)
Constant FEM 0.366555** * (0,000) 2.44833 (0,1858) 2.28033 (0.3692) 3.48074 (0.2181) 3.64443 (0.1998) OLS 0.364089** * (0,00001) -0.0443237 (0,9502) -1.29585 (0,1397) -1.78530* (0,0580) -0.490412 (0,5877) Profitability FEM -0.156546 (0,3539) 0.0007464 (0,9972) -0.0092694 (0.9695) 0.0879174 (0.7359) -0.0162759 (0.9540) OLS -0.268467 (0,6700) -0.286346 (0,6529) -0.574181 (0,3522) -0.976490 (0,1490) -1.49415** (0.0188) Company Size
FEM - -0.121628 (0,2581) -0.112273 (0.4385) -0.163225 (0.2899) -0.159211 (0.3028)
OLS - 0.0238783 (0,5639) 0.082277* (0,0836) 0.0630676 (0,1922) 0.0166132 (0,7094) Asset Tangibility
FEM - - - -0.347552
(0.3134)
-0.634828 (0,1703)
OLS - - - 0.829728
(0,1580)
0.301848 (0,5746) Liquidity
FEM - - - - -0.872064
(0,3389)
OLS - - - - -1.8789 ***
(0,0026) Asset
Turnover
FEM - - 0.0202166
(0.9213)
-0.177720 (0,5303)
-0.101251 (0.7302)
OLS - - 0.630486**
(0,0265) 1.17094** (0,0157) 1.15058*** (0,0078) No of observations
39 39 39 39 39
2
R
FEM 0.974919 0.976247 0.976258 0.977353 0.978341OLS 0,004963 0.014251 0.145371 0.194722 0.391265
Figure 1: Experimental values of the companies’ financial leverage (DebtRatio) and the ones adjusted through the 10thmodel–OLS
Source: Authors’ processing in Gretl
Figure 1 reveals the actual values of the DebtRatio of the sampled companies, and the ones fitted by the most complex model, model no 10.
The following figure (Figure 2) represents the regression residuals as drawn by Gretl:
Figure 2: Regression residuals for the 2ndmodel–FEM
Source: Authors’ processing in Gretl
-0.5 0 0.5 1 1.5 2
1 2 3 4 5 6 7 8 9 10 11 12 13 time series by group
Actual and fitted DebtRatio fitted
actual
-0.6 -0.4 -0.2 0 0.2 0.4 0.6 0.8 1 1.2
1 2 3 4 5 6 7 8 9 10 11 12 13
time series by group
5. Conclusions
These estimations reveal the dependence degree between the debt ratio of the studied companies and certain explanatory variables. Company size, asset turnover, liquidity and profitability were found important for the debt ratio of selected companies. The higher the size of the company and its assets’ turnover, the more borrowed capital companies use. On the other hand, the higher the liquidity and profitability of these companies, the less borrowed capital they need in order to finance their business.
Because of data inaccessibility, this study was carried out on a reduced number of companies and time periods so the size of the sample is a limition of this research. Still, as new data become available, this would become a direction for our future research.
All in all, when it comes to financing decisions, after analyzing a number of factors, a company establishes its target capital structure, the one it believes to be optimal, which is then used as a guide for raising funds in the future. Besley and Brigham (2011) consider that „the target might change over time as conditions vary, but at any given moment the firm’s management has a specific capital structure in mind, and individual financing decisions should be consistent with this target. If the actual proportion of debt is below the target level, new funds will probably be raised by issuing debt, whereas if the proportion of debt is above the target, stock will probably be sold to bring the firm back in line with the target debt/assets ratio”. All in all, the debt ratio presents a particular importance for each company, regardless of its activity field.
Bibliography
Besley S., Brigham E.F.(2011), Principles of finance 5e, South Western Cengage Learning, OH, USA
Kraus A., Litzenberger R.H.(1973),A State-Preference Model of Optimal Financial leverage, Journal of Finance, vol.28, pag.911-922.
Mihalca G., Antal R. (2009), An empirical investigation of the trade-off and pecking order hypotheses on Romanian market,ASMDA-2009 -Selected papers, Vilnius, pp.109-114,
http://leidykla.vgtu.lt/conferences/ASMDA_2009/PDF/05_sec_023_Mihalca_et_al_ An_Empirical.pdf
Modigliani, F., Miller, M. (1958),The cost of capital, corporation finance and theory of investment, American Economic Review, vol.48, pp. 261–297.
Myers S., Majluf N.(1984),Corporate financing and investment decisions when firms have information that investors do not have, Journal of Financial Economics, vol. 13, pp.187-221