63 63 63 63 63 Mem Inst Oswaldo Cruz, Rio de Janeiro, Vol. 93, Suppl. I: 63-73, 1998
The Stabilizing Effects of the Acquired Immunity on the
Schistosomiasis Transmission Modeling
-The Sensitivity Analysis
Hyun Mo Yang/
+, Ariana Campos Yang*
Departamento de Matemática Aplicada/IMECC, Universidade Estadual de Campinas, Caixa Postal 6065, 13081-970 Campinas, SP, Brasil *FCMS, Santos, SP, Brasil
A mathematical model is proposed to analyze the effects of acquired immunity on the transmission of schistosomiasis in the human host. From this model the prevalence curve dependent on four parameters can be obtained. These parameters were estimated fitting the data by the maximum likelihood method. The model showed a good retrieving capacity of real data from two endemic areas of schistosomiasis: Touros, Brazil (Schistosoma mansoni) and Misungwi, Tanzania (S. haematobium). Also, the average worm burden per person and the dispersion of parasite per person in the community can be obtained from the model. In this paper, the stabilizing effects of the acquired immunity assumption in the model are assessed in terms of the epidemiological variables as follows. Regarded to the prevalence curve, we calculate the confidence interval, and related to the average worm burden and the worm dispersion in the community, the sensitivity analysis (the range of the variation) of both variables with respect to their parameters is performed.
Key words: schistosomiasis - acquired immunity - mathematical model - epidemiological values - sensitivity analysis
Schistosomiasis is probably the human infec-tion with the most complex biological cycle, in-volving at least two host species (human and snail), two free-living transmission stages of the parasite (cercariae and miracidia) and distinct environ-ments.
Humans are the principal definitive host for the five schistosome species. Adult worms live in the venous system of intestine (Schistosoma mansoni, S. japonicum, S. mekongi and S. intercalatum) or the urinary bladder (S. haematobium) (Mahmoud 1990). As a result of the parasite sexual reproduc-tion in different human organs, the characteristi-cally shaped eggs pass through the vesical or in-testinal wall in order to find their way to outside via the host excreta. In fresh water the eggs hatch and release ciliated motile miracidia that soon pen-etrate into the snail (the intermediate host). Inside the snail the miracidia multiply asexually, and in four to six weeks hundreds of thousands of motile
forked-tail cercaria emerge. These are the infec-tive forms to the human host. For each species of schistosome and for each geographic region there is a specific snail as the intermediate host. There-fore, it is believed that the geographic distribution of schistosomiasis depends on the distribution of the specific snails. On encountering human skin, the cercaria actively penetrate it, causing a local reaction. In the process of invasion, the cercaria lose their tails and change into schistosomula that migrate to the lungs and liver; in about six weeks they mature to adult worms, mate and descend, via the venous system, to their final habitat. The life-span of adult worms is still a controversy, ranging from 5-10 years to more than 30 years (Vermund et al. 1983, Harris 1984).
The question of whether humans mount an immune response to schistosomiasis is of basic biological interest and important in the context of disease control (Fulford et al. 1993). There is ac-cumulating evidence that the human host devel-ops a protective immune response to schistosome infection (Clegg et al. 1970, Hagan 1987). How-ever, the immune response to this and other large parasites differs from that of viruses and bacteria, and appears to be acquired gradually, concomitant, and may afford only partial protection against fur-ther infections. In addition, acquired host responses can act to reduce rates of parasite establishment, fecundity and survival (Anderson & May 1991). Partially support by FAPESP Grant # 97/12543-4 and
FAEP/UNICAMP Grant # 1085/97.
+Corresponding author. Fax: +55-19-289.1466. E-mail:
64 64 64 64
64 Schistosomiasis Transmission Model HM Yang, AC Yang
Acquired immunity among the humans has important consequences for the epidemiology of schistosome infection (Anderson & May 1985, Crombie & Anderson 1985, Woolhouse et al. 1991, Woolhouse 1991, 1992). Mathematical models have great potential for advancing the understand-ing of schistosome transmission and as a tool for the design of control programmes (Woolhouse 1991). As the life-cycle of schistosome is extremely complex, it is very difficult to understand the quan-titative contribution of different components of transmission to the level of infection in a human population. For the same reason, it is difficult to predict the quantitative effects of intervention on human infection and disease. As prediction is cen-tral to the question of decision about competing intervention options, models with predictive capac-ity can be a powerful tool to help the disease con-trol problems. To be of any use, however, models must be sufficiently realistic and grounded in what is understood of the schistosome biology (Woolhouse 1991). This implies the inclusion of some biological details such as the role of acquired immunity on the disease dynamics.
The main epidemiological data used to quan-tify schistosomiasis transmission are as follows. The most used epidemiological data to describe the schistosomiasis is the so-called prevalence curve, denoted p(a), that is, the proportion of individuals shedding viable eggs in faeces (or urine) plotted against age. The essential relationship between prevalence and age, which is repeatedly observed in the studies of age-specific prevalence data of schistosomiasis, is a build up in the early years, peaking around 10-20 years of age, dropping there-after, and stabilizing at some endemic level (Holford & Hardy 1976). It is remarkable that this behaviour of the prevalence curve is observed even when the prevalence is very low, reaching a peak of only 5 % (Dias et al. 1989).
The second most used data is the age-depen-dent egg output curve, m(a). This curve is also characterized by an early build up, peaking slightly earlier than the prevalence curve (Costa et al. 1985). Following this peak, there is a decline in the egg output but the decline does not reach zero, rather it approaches some other asymptote (Hairston 1965, Bradley & McCullough 1973). There are various ways in which mean egg output are reported in the literature (Banáñez et al. 1994): the simple arith-metic, the Williams’ mean (logarithmic transfor-mation) and the square root transformed mean. Since the egg output varies greatly with random factors that cannot be included in a simple model we believe that the Williams’ mean, by smoothing
the data and normalizing it, is the more appropri-ate. A justification for this can be found in the clas-sical paper by Williams (1937).
The third kind of data is the age-dependent variance in the egg output d(a) among the human population. This kind of data is difficult to obtain but is very important to what follows. This vari-ance divided by mean egg output is the well known dispersion curve and typically assumes high val-ues at lower ages, dropping quickly to a minimum value around 10-15 years, raising thereafter to sta-bilize at a certain level (Bradley & McCullough 1973). For instance, if the dispersion assumes the unity value, then the parasite is distributed ran-domly among the individuals in the community, which corresponds to the Poisson distribution. However, if the dispersion assumes a value higher than unity, then we have a great number of para-sites harboured by few individuals while all other individuals harbour small amount of parasites and, in this case, the parasite distribution in the popula-tion can be described by the negative binomial dis-tribution.
From the second and third kind of data we can obtain, by calculating the average values regard-ing age, the average worm burden per person m, and the worm dispersion per person d. These epi-demiological variables show the distribution trend of the worms in the community (over- or under-dispersion).
The fourth type of data described in the litera-ture is the proportion of shedding snails (those re-leasing cercaria), or the combined proportion of latent (those already infected but not releasing cer-caria yet) and shedding snails (Sturrock & Webbe 1971).
Another less used data is the observed fre-quency of contact among humans with presumably contaminated water (Dalton & Pole 1978, Barbour 1985, Chandiwana & Woolhouse 1991). The in-troduction of this kind of information is the basis of Holford and Hardy model (1976).
pa-65 65 65 65 65 Mem Inst Oswaldo Cruz, Rio de Janeiro, Vol. 93, Suppl. I, 1998
rameters in the quantitative epidemiology. For this reason, this value must be taken into account when schistosomiasis controlling mechanisms are ap-plied in a community.
Models which incorporate neither the acquired resistance to infection nor the age-dependent pa-rameters cannot reproduce typical age intensity or age prevalence patterns. For a recent review of schistosome infection modeling see Woolhouse (1991, 1992). The consequences of a simple model for acquired immunity against schistosomiasis were analyzed elsewhere (Yang et al. 1995, 1997, Yang & Coutinho 1998). Yang et al. (1995, 1997) pro-posed a semi-stochastic model to analyze the ef-fects of acquired immunity on the transmission of schistosomiasis in the human host. We call this as semi-stochastic model, because the distribution of worms among the human population is treated probabilistically and the deterministic treatment is used for the demographic structure (age distribu-tion) of human population. The basic model’s as-sumptions were as follows. The human host was assumed to build up an immune response after elapsing a fixed period of time L from the first in-fection. This acquired immunity was assumed to be partially effective (Terry 1994, Butterworth 1994, Gryseels 1994). Any infection can be done by one or more cercaria with a given probability. The model treated deterministically the age-distri-bution of human host.
In this paper, we analyze the effects of the ac-quired immunity on the stability of the schistoso-miasis transmission. For this purpose, following a different way that done by Yang and Coutinho (1998), we present the confidence interval for fit-ted prevalence curve p(a), and perform the sensi-tivity analysis of the average worm burden per person (m) and the worm dispersion per person (d) with respect to their parameters. The sensitivity analysis provides us with the range of the varia-tions of m and d when the parameters are varied.
MATERIALS AND METHODS
In this section we briefly describe the semi-sto-chastic approach proposed by Yang et al. (1995, 1997) to assess the effects of acquired immunity on the transmission of schistosomiasis in the hu-man host. The model’s assumptions were as fol-lows.
1. The human host build an immune response up after elapsing a fixed period of time L from the first infection at age A. This immunity is partially effective, that is, protection against further infec-tions is not fully avoided but controlled to some extent, and everlasting, that is, in the absence of
the adult worm the immunity processes do not fade away.
2. The infection event is assumed to be Pois-son (random) process of rate l with multiple oc-currences (Cox & Miller 1992), i.e., in each infec-tion one or more cercaria are assumed to invade the host per infective event. Considering that the probability of the inocula b(i) is binomially dis-tributed and there is a maximum number of invad-ing viable cercaria r, then we must have
b i i r
( )=
=
∑
1 1. It also reflects the fact that not all invading cercaria per event maturate to adult form but only viable cercaria. Therefore, from the con-sideration of the acquired immunity, we have for the Poisson process rates ls and lc the special names, respectively, the forces of infection of non-immune and non-immune individuals.3. Adult worms inside the host die with a con-stant rate mw.
4. The human population is treated determinis-tically with a constant death rate mh.
Based on the first assumption, the human popu-lation can be divided into non-immune (completely susceptible) and partially immune individuals. The second and third assumptions are related to the worm distribution in the human host, which is given by the probabilistic events of parasite entrance and its mortality. Finally, the last assumption is related to the age-distribution of the human population. All the above considerations are used to obtain, by means of the stochastic process modeling, a sys-tem of difference-differential equations that de-scribes the dynamics of the schistosomiasis. Note that the term difference is related to the discrete (integer number) counting of parasites, while the term differential is related to the age which is con-sidered as a continuous variable.
Here we transport the equilibrium solutions from the model proposed by Yang et al. (1997). The steady state probability generating function (pgf) for the number of worms distributed among non-immune individuals with age between a and a+da is given by
( ) F a x
S e e e for a L
S e e e for a L
s
a e
j a
a
a L e
j a
h s
j a s
h s
j L s ( , )
;
;
=
−
<
−
≥
−
−
−
− − − − −
− −
− 0
1
0
1
µ λ µ λ
µ λ µ λ
µω ω
µω ω Ψ
Ψ
66 66 66 66
66 Schistosomiasis Transmission Model HM Yang, AC Yang
whereS0 is the new-born rate and the auxiliary notation
(
)
Ψ( )ξ = ( ) ξ ,
−
=
=
∑
∑
b i ij x j i i r j 1 1 1
with the combinatory being given by
Observe that i! = i´ (i-1) ´ (i-2) ´...´2´1. From Fs(a,x) and Fc(a,x) we can obtain the following three epidemiological variables. These variables, which were discussed in the Introduc-tion, are the age-prevalence curve p(a), the aver-age worm burden m and the average worm disper-sion in the community d. The procedures to obtain these variables, which were described in Yang et al. (1995, 1997), are not given here.
The age-prevalence curve p(a) is given by
where
The average worm burden per person m is given by
(
)
m s e
h s c L s h h = + − − + − ϖ λ
µω µ λ λ λ µ
µ
1 ,
where v is the mean parasite entrance per infec-tive event, given by
. ) ( 1
å
= = r i i b i v( )
1 .) ( ) (
1 1
0 x x
j r i i j j i i
b ÷÷
-ø ö çç è æ =
Y
å
å
= =
Finally, the worm dispersion per person in the com-munity d is given by
d m f f f
m = − +1 1+ 2− 3
, where f1, f2 and f3 are the auxiliary functions
and
is the second moment of the parasite entrance per infective event.
The epidemiological variables p(a), m and d are given as a function of the parameters ls, lc, mw and L. These values can be estimated by an appro-priate method, but due to the unreliability of the observed data, they will be approximated values of the true values. The sensitivity analysis deal with this question of the parameters that are given as an approximated values, and from which other vari-ables are derived.
Now, we present the sensitivity analysis (Bailey & Duppenthaler 1980) in the modeling of schisto-somiasis transmission. Let y(q) be one of the pre-viously defined and calculated epidemiological variables, that is, p(a), m or d, with q being the model’s parameter-set, given by the column vec-tor
[
]
θ = λ µ λs w c T
L ,
where the superscript T stands for the transposition of the matrix.
The parameter-set q can be fitted by the maxi-mum likelihood estimation method using the ob-served prevalence data. In practice, these data are unreliable. Therefore, the estimated parameter-set qcan be set as
( )
σb i
r
i i b i
= − =
∑
1 1 ( ) ( )(
)
(
)
( ) ( )( )(
)
f f e e e e e f e s h b s hs s c h
L c s h h h L h c s L s c s L h s h
b s s c
L
s h h
s c L h h h 1 2 2 2 2 2 3 2 2 2 2 2 2 3 2 1 1 2 2 = + + + = − + + + + + + + − +− + − + + − − + + = − − − − − − − ϖ λ µ µ σ λ µ µ ϖ λ λ λ µ
µ λ λ µ µ µ µ µ µ µ λ λ λ λ λ µ µ λ µ
σ λ λ λ λ µ µ µ
λ λ ϖ λ ω ω µ ω ω ω µ ω µ µ ω µ ω µ ω ω ω
sµω
67 67 67 67 67 Mem Inst Oswaldo Cruz, Rio de Janeiro, Vol. 93, Suppl. I, 1998
$ $ ,
θ θ= 0+δ θ
where q0is the true value, θ$ is an unbiased esti-mator provided by the likelihood method and dqˆis the deviation from the true value. By the fact that
$
θ is an unbiased estimator, we must have for its expectation,
that is, the average value of the deviation from the true value is zero, or
On the other hand, the average value of the square of the deviation from the true value, designed by S, is not zero and is given by
This is the covariance (symmetric) matrix, whose elements are denoted byρij
(
= ρ ji)
, if i¹j, and σi2, otherwise. Note that σi
2 is the variance.
By the fact that the parameters are not accu-rately estimated, when we calculate the epidemio-logical variables, we must bear in mind that these variables are also imprecise. For this reason, it is interesting to calculate the range of variations of the epidemiological variables. Therefore, the varia-tion in the epidemiological variables can be calcu-lated, in the first approximation, as
(
)
( )
∆ y = y θ +δ θ − y θ ≅ H Tδ θ
0 $ 0 $ ,
where H (see the appendix), defined as
H=∂y
∂ θ θ 0
,
is the sensitivity matrix, whose elements are de-signed by hi , where i=1,2,3 and 4 related to the parameters. Using the fact that θ θ$= 0+δ θ$, we
have the expectations of the epidemiological vari-ables given by
( )
E ∆ =y 0 andfrom Σ = E
[ ]
δ θ$ 2 . Hence, we haveσy T
H H
2 = Σ
for the variance of the epidemiological variable.
In the next section we present the sensitivity analysis of the epidemiological variables with re-spect to their parameters. Firstly, by using the pa-rametrized prevalence curve, the model’s param-eters are fitted to prevalence data from Touros, Brazil (Motta et al. 1977), and region of Misungwi, Tanzania (Bradley & McCullough 1973). There-after, we apply this estimated set of parameters to assess the variations in the epidemiological vari-ables: we calculate the confidence interval for p(a), and for the average worm burden per individual m and the dispersion per individual d, we present the rank of the sensitivity of the model’s parameters.
RESULTS
In this section, we present the stabilizing ef-fects of the acquired immunity consideration in the model. First, we present the parameters fitted to prevalence data found from region of Misungwi, Tanzania and Touros, Brazil.
In Table I a and b we show the fitted param-eters by the maximum likelihood estimation method, for 3 arbitrarily chosen values for the maximum parasite entrance per infective event.
TABLE I
The parameters fitted to prevalence data from region of Misungwi (Schistosoma haematobium), Tanzania (I.a) and Touros (S. mansoni), Brazil (I.b), for r =1, 13
and 25. The symbols y and l stand, respectively, for year and likelihood value
I.a
r 1 13 25
ls(y-1) 0.227 0.175 0.168 mw(y-1) 0.089 0.194 0.211 lc(y-1) 0.049 0.047 0.042
L(y) 11.0 9.80 7.39
- l 2531.0 2519.1 2516.8
I.b
r 1 13 25
ls(y-1) 0.117 0.096 0.084 mw(y-1) 0.076 0.199 0.241 lc(y-1) 0.039 0.044 0.065
L(y) 5.81 1.47 0.25
- l 1493.4 1490.6 1490.0
68 68 68 68
68 Schistosomiasis Transmission Model HM Yang, AC Yang
We observe that the covariance (especially the covariance with the parasite mortality rate
µ
ω) and variance values related to the periods of time elapsed to build up an immune response (L) are high. Also the estimation related to Touros, Brazil showed more imprecise than that found for region of Misungwi, Tanzania.Based on the values of the parameters and their covariance matrices given in Tables I and II, we perform the sensitivity analysis. Note that the con-fidence interval for the prevalence curve, when the fitted parameters are considered with regard to their estimated covariance elements, must be narrowed in proportion to the model’s adequacy to describe the strong stability of the disease stability (in the sense of a broad range of variation of the model’s parameters). Nevertheless, besides of the insensi-tivity of the prevalence curve with respect to the variation of the model’s parameters, we must ob-serve a large variation in the average worm bur-den and the worm dispersion in order to explain the difficulty encountered in the eradication programmes. It is worth to stress the fact that both
TABLE II
The elements of the covariance matrix related to the fitted parameters given in Table I, for region of Misungwi (Schistosoma haematobium), Tanzania (II.a) and Touros (S. mansoni), Brazil (II.b), for r =1,
13 and 25
II.a
r 1 13 25
s2
1 0.0002 0.00006 0.00004
r12 0.0002 0.0003 0.0003
r13 0.0002 0.00008 0.00007
r14 0.02 0.03 0.03
s2
2 0.0004 0.003 0.01
r23 0.0003 0.0008 0.002
r24 0.04 0.3 1.1
s23 0.0002 0.0002 0.0005
r34 0.03 0.07 0.2
s24 5.1 27.2 113.4
II.b
r 1 13 25
s21 0.0002 0.0004 0.00004
r12 0.0007 0.0009 -0.0001
r13 0.0004 0.0002 -0.00002
r14 0.1 0.2 -0.09
s22 0.004 0.2 0.3
r23 0.002 0.04 0.05
r24 0.8 44.6 111.9
s2
3 0.001 0.009 0.009
r34 0.5 10.0 20.5
s2
4 149.7 11,223.6 45,334.2
the confidence interval and sensitivity analysis are strongly dependent on the values attributed to the parameters, that is, it is a local analysis in the sense that the variations in the parameters are regarded around the chosen values.
With respect to the prevalence curve, we de-termine the confidence interval. Let us assume that
$
θ is an unbiased estimator with distribution ap-proximately normal, which is reasonable since it is estimated by maximum likelihood and the size of observed prevalence data is not small. Hence, to the prevalence curve, which is a proportion, we have the 100´(1-a) % confidence interval given by
( )
( )
( )
p θ$ z σ y p θ p θ$ z σ y ,
α α
+ < < +
−
1 2
2
0
1 1 2
2
where za is the 100a percentile obtained from the normal distribution (Dixon & Massey 1983). In this paper, we will consider a=0.05, which yields in z0.025 =-1.96 and z0.975 =1.96. Therefore, the above interval will no longer ensure a 95 percent chance that the confidence limit will include q0.
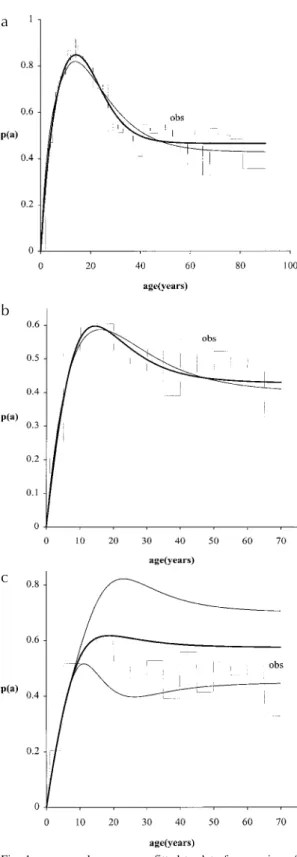
In Figs 1.a, 1.b and 1.c we show the age-preva-lence fitting p
( )
θ$ , based on Tables I and II, for three maximum parasite entrance per infective event, r =1, 13 and 25.The 95 percent confidence interval for both curves are very close, practically coinciding with the curves shown (Figs 1a, b). For instance, the maximum relative range of variation of the confi-dence interval ∆p p/ are 0.0065 (r =1), 0.003 (r =13) and 0.003 (r =25) at age 90 years, for re-gion of Misungwi, Tanzania (Fig. 1a), and 0.01 (r =1 at age 5.81), 0.0064 (r =13 at age 70) and 0.69 (r =25 at age 24.5), for Touros, Brazil (Fig. 1b). However, the confidence interval is large (see below) for data from Touros when we use r =25 (Fig. 1c).
69 69 69 69 69 Mem Inst Oswaldo Cruz, Rio de Janeiro, Vol. 93, Suppl. I, 1998
Fig. 1: age-prevalence curves fitted to data from region of Misungwi (Schistosoma haematobium), Tanzania (a) and from Touros (S. mansoni), Brazil (b). The thin curves correspond to
r =1 and thick curves, to r =25 (Misungwi) and 13 (Touros). For Touros, when we fitted the data considering r =25, the con-fidence interval enlarges for the prevalence curve calculated at higher ages (c).
We observe that, in spite of the broad range of the estimated parameters, especially of the param-eter L, which has very high variance, the preva-lence curve is practically unchanged by the varia-tion of the parameters with respect to their covari-ance values. This shows that the acquired immu-nity consideration taken into account by the model stabilizes the disease transmission.
Nevertheless, we would like to stress that the goodness of fit by itself should not be considered sufficient for accessing to model adequacy. For instance, a model without immunity, which encom-passes the age-dependent frequency contact with infested water (Holford & Hardy 1976), fits the prevalence extremely well with four parameters, but it fails in two aspects: to explain the observed strong stability and underestimates the basic re-production ratio. Moreover, both acquired immu-nity and multiple parasite infections reproduced a great endemic stability for the disease and a high value for the basic reproduction ratio (Yang & Coutinho 1998), which are important features ob-served with respect to the schistosomiasis trans-mission. Of course, in this kind of schistosomiasis modeling we must obtain a large confidence limit for the prevalence curve (Fig. 1c).
With respect to the average worm burden per person and the worm dispersion per person, the sensitivity analysis (Frank 1978) regarded to their parameters can be done by calculating
( )
σ
yσ θ
y i i2 2
1 4
=
=
∑
,
where
σ θ
2y( )
i is the overall contribution of the i-th parameter of i-the model to i-the variation of m or d given by( )
σ θ
y i iρ
ij j jh
h
2
1 4
=
=
∑
,
remembering that hi and rij are, respectively, the elements of the sensitivity vector H and covari-ance matrix S. Observe that the central contribu-tion of the ith parameter, that is, the isolated con-tribution of the variance of the ith parameter, is given by
h
i2σ
i2 .In Table III a and b we show the sensitivity analysis of the average worm burden per person with respect to its parameters. The average worm burden per person for region of Misungwi, Tanza-nia (Touros, Brazil) are: for r =1, m =0.83 (0.59), for r =13, m =2.44 (1.69) and for r =25, m =3.70 (3.45).
a
b
70 70 70 70
70 Schistosomiasis Transmission Model HM Yang, AC Yang
We note that the most sensitive parameter is
µ
ω, followed byλ
c and L, and the least sensi-tive isλ
s. This ranking of the parameters which contribute to vary the average worm burden is maintained to all values of the estimated param-eters. Therefore, due to the fact that the variation in the force of infection related to the non-immune individuals affects so little to the variation of the average worm burden, we can conclude that the acquired immunity consideration permits us to explain the strong stability of the schistosomiasis transmission. Observe that the variation in the av-erage worm burden does not surpass its avav-erage value, except for Touros when we consider r =13. In Table IV a and b, we show the sensitivity analysis of the worm dispersion per person with respect to its parameters. The worm dispersion per person for region of Misungwi, Tanzania (Touros, Brazil) are: for r =1, d=5.08 (2.16), for r =13, d=15.96 (7.89) and for r =25, d=30.67 (9.19).Differently to the average worm burden, the ranking of the sensitivity does not maintain to all values of parameters considered. We note that the most sensitive parameter is
µ
ω, followed byλ
c andλ
s and the least sensitive is L, if we consider low values of r. However, for great values of r, we have the same ranking observed in relation to the average worm burden, which isµ
ω, followed byλ
c and L, and the least sensitive isλ
s. Observethat the variation in the worm dispersion per per-son corresponding to higher values of r increases many times its value.
The above findings show the stabilizing effects when the acquired immunity is considered in the schistosomiasis transmission model. Besides the low worm burden per person and high worm dis-persion, we obtained the following important as-pect. When controlling or eradicating mechanism is introduced in a community (by varying the model’s parameters), we observe that the pattern of the disease transmission (prevalence curve) is practically unchanged, the average worm burden per person is lowered reasonably, but the worm dispersion is changed broadly. This suggests that the worm distributes more and more in negative binomially shape if the host-parasite system is per-turbed.
Finally, note that we have considered an ac-quired immunity which is never lost. Yang and Silveira (1998) showed, for the directly transmit-ted infections, that the loss of immunity decreases the estimation of the basic reproduction ratio R0 , and it attains the maximum value when the im-munity is life-long. Therefore, if we deal with the return of the immune individuals to the suscep-tible status, we must bear in the mind that all the above results are the upper bound of possible outcomes.
TABLE III
The sensitivity analysis of the average worm burden per individual to region of Misungwi (Schistosoma haematobium), Tanzania (III.a) and Touros (S. mansoni), Brazil (III.b), for r =1, 13 and 25. The isolated contributions of each parameter with the total variation are shown. The indexes 1, 2, 3 and 4
refer, respectively, to
λ
s ,µ
ω,λ
c and LIII.a
r 1 13 25
h12 1 2
σ 0.0005 0.002 0.002
h22 2 2
σ 0.022 0.40 2.8
h3 2
3 2
σ 0.011 0.15 1.0
h42 4 2
σ 0.002 0.07 0.92
σm
2 0.0007 0.0049 0.114
III.b
r 1 13 25
h1 2
1 2
σ 0.0003 0.0004 0.001
h2 2
2 2
σ 0.18 11.0 50.4
h3 2
3 2
σ 0.12 6.9 17.2
h4 2
4 2
σ 0.016 5.2 6.5
σm
2
0.0046 2.53 0.18
TABLE IV
The sensitivity analysis of the worm dispersion per individual to region of Misungwi (Schistosoma
haematobium), Tanzania (IV.a) and Touros (S. mansoni), Brazil (IV.b), for r =1, 13 and 25. The isolated contributions of each parameter with the total
variation are shown. The indexes 1, 2, 3 and 4 refer, respectively, to parameters
λ
s ,µ
ω,λ
c and LIV.a
r 1 13 25
h1 2
1 2
σ 0.3 1.1 2.9
h22 2 2
σ 2.1 15.6 160.6
h32 3 2
σ 0.5 6.5 68.8
h4 2
4 2
σ 0.09 3.1 62.3
σd
2
3.9 56.3 781.5
IV.b
r 1 13 25
h1 2
1 2
σ 0.2 0.5 0.4
h22σ22 8.5 131.7 33.9
h3 2
3 2
σ 1.0 93.2 91.4
h4 2
4 2
σ 0.1 21.7 0.03
σd
71 71 71 71 71 Mem Inst Oswaldo Cruz, Rio de Janeiro, Vol. 93, Suppl. I, 1998
DISCUSSION
In this paper we analyzed the stabilizing effects of the acquired immunity consideration in the schis-tosomiasis transmission modeling. To do this, we determined the confidence interval for the preva-lence curve, and performed the sensitivity analy-sis of the average worm burden per person and the worm dispersion per person in the community.
All the results presented in this paper confirm the fact that the acquired immunity consideration stabilizes the transmission of the schistosomiasis. When there is a variation in the model’s param-eters, the prevalence curve is practically un-changed, while the parasite dispersion is strongly affected.
Therefore, the acquired immunity is one of ex-planation to the strong stability of the schistoso-miasis transmission, i.e., the disease is maintained in an endemic level even in the presence of con-trolling or eradication mechanisms. The model tak-ing into account the acquired immunity results in a very low estimation for the average worm bur-den per person, and a very high value for the worm dispersion. This suggests that the worms are nega-tive binomially distributed in the community, which is enhanced when perturbation is introduced in form of controlling or eradicating effort.
ACKNOWLEDGMENT
Prof. Dr Luiz Koodi Hotta for his helpful sugges-tions regard to the statistical presentation, and to the anonymous referee for valuable suggestion.
REFERENCES
Anderson RM, May RM 1985. Herd immunity to helm-inth infection and implications for parasite control.
Nature 315: 493-496.
Anderson RM, May RM 1991. Infectious Diseases of Human. Dynamics and Control, Oxford University Press, Oxford, New York, Tokyo.
Bailey NTJ, Duppenthaler J 1980. Sensitivity analysis in the modelling of infectious disease dynamics. J Math Biol 10: 113-131.
Banáñez MG, Boussinesq M, Proud’hon J, Frontado H, Villamizar NJ, Medley GF, Anderson RM 1994. Density-dependent processes in the transmission of human onchocerciasis: intensity of microfilariae in the skin and their uptake by the stimuli host. Parasi-tology 108: 115-127.
Barbour AD 1985. The importance of age and water contact patterns in relation to Schistosoma haematobium infection. Trans R Soc Trop Med Hyg 79: 151-153.
Bradley DJ, McCullough FS 1973. Egg output stability and the epidemiology of Schistosoma haematobium. Part II. An analysis of the epidemiology of endemic
Schistosoma haematobium. Trans R Soc Trop Med Hyg 67: 491-499.
Butterworth AE 1994. Human immunity to
schisto-somes: some questions. Parasitol Today 10: 378-380. Chandiwana SK, Woolhouse ME 1991. Heterogeneities in water contact pattern and the epidemiology of Schis-tosoma haematobium. Parasitology 103: 363-370. Clegg JA, Smithers SR, Terry RJ 1970. ‘Host’ antigens
associated with schistosomes: observations on their attachment and their nature. Parasitology 61: 87-94. Costa EGF, Rocha RS, Magalhães MHA, Katz N 1985. A clinico-epidemiological survey of schistosomia-sis mansoni in a hyperendemic area in Minas Gerais State (Comercinho, Brazil) - I: Differences in the manifestations of schistosomiasis in the town center and in the environs. Trans R Soc Trop Med Hyg 79: 539-545.
Cox DR, Miller HD 1992. The Theory of Stochastic Pro-cesses, Chapman and Hall, London.
Crombie JA, Anderson RM 1985. Population dynamics of Schistosoma mansoni in mice repeatedly exposed to infection. Nature 315: 491-493.
Dalton PR, Pole D 1978. Water contact patterns in rela-tion to Schistosoma haematobium infection. Bull WHO 56: 417-426.
Dias LCS, Kawazoe U, Glasser C, Hoshino-Shimizu S, Kamamura S, Cordeiro JA, Guarita DF, Ishihata G 1989. Schistosoma mansoni in the municipality of Pedro de Toledo (São Paulo, Brazil) where the
Biomphalaria tenagophila is the snail host - I: Preva-lence in human population. Rev Inst Med Trop S Paulo 31: 110-118.
Dixon WJ, Massey Jr. FJ 1983. Introduction to The Sta-tistical Analysis. McGraw-Hill, Inc., 4th ed, New York.
Frank PM 1978. Introduction to System Sensitivity Theory, Academic Press, New York, San Francisco & London.
Fulford AJC, Butterworth AE, Dunne DW, Sturrock RF, Ouma JH 1993. Some mathematical and statistical issues in assessing the evidence for acquired immu-nity to schistosomiasis: (pre-print).
Gryseels B 1994. Human resistance to Schistosoma in-fections: age or experience? Parasitol Today 10: 380-384.
Hagan P 1987. The human immune response to schisto-some infection. In D Hollison & AJG Simpson (eds),
The Biology of Schistosomes from Genes to Latrines, Academic Press, London.
Hairston NG 1965. An analysis of age-prevalence data by catalytic models. A contribution to the study of bilharziasis. Bull WHO 33: 163-175.
Harris ARC, Russell RJ, Charters AD 1984. A review of schistosomiasis in immigrants in Western Aus-tralia, demonstrating the unusual longevity of
Schistoma mansoni. Trans R Soc Trop Med Hyg 78: 385-388.
Holford TR, Hardy RJ 1976. A stochastic model for the analysis of age-specific prevalence curves in schis-tosomiasis. J Chron Dis 29: 445-458.
72 72 72 72
72 Schistosomiasis Transmission Model HM Yang, AC Yang
Motta EGF, Trigueiros KH, Leibovich GHC 1977. Programa especial de controle da esquistossomose (PECE). Projeto Touros: avaliação dos resultados do tratamento coletivo. In PA Machado. Painel Programa Especial de Controle da Esquistossomose, Ministério da Saúde, Brasília.
Sturrock RF, Webbe G 1971. The application of cata-lytic models to schistosomiasis in snails. J Helmintol 45: 189-200.
Terry RJ 1994. Human immunity to schistosomes: con-comitant immunity? Parasitol Today 10: 377-378. Vermund SH, Bradley DJ, Ruiz-Tiben E 1983. Survival
of Schistosoma mansoni in the human host: estimates from a community-based prospective study in Puerto Rico. Am J Trop Med Hyg 32: 1040-1048. Williams CB 1937. The use of logarithms in the
interpret6ation of certain entomological problems.
Ann Applied Biol 24: 404-414.
Woolhouse MEJ, Taylor P, Matanhire D, Chandiwana SK 1991. Acquired immunity and epidemiology of
Schistosoma haematobium. Nature 351: 757-759. Woolhouse MEJ 1991. On the application of
mathemati-cal models of schistosomes transmission dynamics - I: Natural transmission. Acta Tropica 49: 241-270. Woolhouse MEJ 1992. On the application of mathemati-cal models of schistosomes transmission dynamics - II: Control. Acta Tropica 50: 189-204.
Yang HM, Coutinho FAB 1998. Acquired immunity on a schistosomiasis transmission model - Analysis of the stabilizing effects. J Theor Biol: in press. Yang HM, Silveira ASB 1998. The loss of immunity in
directly transmitted infections modeling: The effects on the epidemiological parameters. B Math Biol 60: 355-372.
Yang HM, Coutinho FAB, Massad E 1995. Modeling the role of immunity in macroparasite infections. J Biol Systems 3: 379-387.
Yang HM, Coutinho FAB, Massad E 1997. Acquired immunity on a schistosomiasis transmission model - Fitting the data. J Theor Biol 188: 495-506.
APPENDIX
The sensitivity matrix H (here is a vector, since we are dealing with one variable) can be obtained by partial differentiation of the variable with respect to the parameters. We show some expressions corre-sponding to the elements of the sensitivity matrix.
In relation to the prevalence curve we have four partial derivatives:∂p a
( )
/∂ λs , ∂ p a( )
/∂ µω,( )
∂p a /∂ λc and ∂p a
( )
/∂L. For instance, we have73 73 73 73 73 Mem Inst Oswaldo Cruz, Rio de Janeiro, Vol. 93, Suppl. I, 1998
In relation to the average worm burden per person m, we have the following elements for the sensi-tivity matrix,
(
)
(
)
(
)
(
)
(
)
(
)(
)
(
)
(
)(
)
h m e e
h m e
h m e
h m L e s h s c L s h
s c h L s h s h s c L s h c s L
h s h
s s c h L
h s h
h h h h h 1 2 2 2 3 4 1 1 ≡ = + − − + − + + ≡ = − + − − + ≡ = + + ≡ = − + + − − − − − ∂ ∂ λ ϖ µ µ λ λ λ µ
λ λ µ λ µ ∂ ∂ µ ϖ λ µ µ λ λ λ µ ∂ ∂ λ ϖ λ
µ µ λ µ ∂
∂
ϖ λ λ λ µ µ µ λ µ
ω µ µ ω ω µ µ ω µ ω .
In relation to the average worm dispersion per person in the community d, we have the following partial derivatives as elements of the sensitivity matrix,
(
)
(
)
(
)
h d m
f f f
m f f f m
m
h d m
f f f
m f f f m
m
h d m
f f f
m f f f m
m
h
s s
s s s s
c c
c c c c
1
1 2 3
1 2 3
2
2
1 2 3
1 2 3
2
3
1 2 3
1 2 3
2 4 ≡ = − + + − − + − ≡ = − + + − − + − ≡ = − + + − − + − ≡ ∂ ∂ λ ∂ ∂ λ ∂ ∂ λ ∂ ∂ λ ∂ ∂ λ ∂ ∂ λ ∂ ∂ µ ∂ ∂ µ ∂ ∂ µ ∂ ∂ µ ∂ ∂ µ ∂ ∂ µ ∂ ∂ λ ∂ ∂ λ ∂ ∂ λ ∂ ∂ λ ∂ ∂ λ ∂ ∂ λ ∂ ω ω
ω ω ω ω
(
)
d L m L f L f L fL m f f f
m L m ∂ ∂ ∂ ∂ ∂ ∂ ∂ ∂ ∂ ∂ ∂ = − + + − − + −
1 2 3
1 2 3
2 ,
where, for instance, we have
(
) (
)
(
)
∂
∂ λ µ µ
ϖ λ µ µ σ ∂ ∂ µ ϖ λ
µ µ µ µ
ϖ λ µ µ σ λ µ µ ∂ ∂ λ ∂ ∂ ω ω
ω ω ω ω ω
f f f f L s h s h b s h h s h b s h c 1 2 1 2 2 2 2 2 1 1 2 2 2 2 2 2 2 4 2 0 0 = + + + = − + + − + + + = = and
(
)
(
)
(
)
∂ ∂ λλ λ ϖ λ µ ∂
∂ µ
λ λ ϖ λ µ ∂ ∂ λ λ ϖ λ µ ∂ ∂
λ λ ϖ µ λ µ µ ω ω µ ω µ ω µ ω f e f e f e f L e s s c L s s c L s c c L s
s c h
L s h h h h 3 2 2 2 3 2 2 2 3 3 2 2 2 = + = − − = − = − − − − − − .
74 74 74 74