Predictive value of [-2]propsa (p2psa) and its derivatives
for the prostate cancer detection in the 2.0 to 10.0ng/mL
PSA range
_______________________________________________
I. Vukovic
1, D. Djordjevic
1, N. Bojanic
1, U. Babic
1, I. Soldatovic
21 Clinic of Urology, Clinical Center of Serbia, School of Medicine, University of Belgrade, Serbia; 2 Institute of Medical Statistics and Informatics, Belgrade, Serbia
ABSTRACT
ARTICLE
INFO
______________________________________________________________ ______________________
Introduction: To assess predictive value of new tumor markers, precursor of prostate specific antigen (p2PSA) and its derivates-%p2PSA and prostate health index (PHI) in detection of patients with indolent and aggressive prostate cancer (PC) in a subcohort of man whose total PSA ranged from 2 to 10ng/mL.
Materials and Methods: This cross-sectional study included 129 consecutive male pa-tients aged over 50 years, with no previous history of PC and with normal digital rectal examination findings, but with serum PSA in interval between 2 and 10ng/mL. All patients underwent standard transrectal ultrasonography guided prostate biopsy for the first time. For all patients, serum PSA, free PSA (fPSA) and p2PSA were measured and PHI and %p2PSA were calculated.
Results: PHI and %p2PSA levels were significanlty higher in patients with PC com-pared to those without this malignancy. The same findings have been observed in group of patients with Gleason score ≥7 compared to those with Gleason score <7. ROC analysis reveled the highest area under the curve with these two markers. Mul-tivariate logistic regression showed significant improvement in PC detection and its agressive form (assumed as Gleason score ≥7).
Conclusions: New markers, derivates of p2PSA (especially %p2PSA and PHI), repre-sente potentially very important clinical tool for predicting presence of PC, and even more important, to discriminate patients with Gleason score <7 from those with Glea-son score ≥7 with total PSA in range from 2 to 10ng/mL.
Keywords:
Biomarkers; Prostatic Neoplasms; Prostate-Specific Antigen
Int Braz J Urol. 2017; 43: 48-56
_____________________ Submitted for publication: May 03, 2016
_____________________ Accepted after revision: June 17, 2016
_____________________ Published as Ahead of Print: November 07, 2016
INTRODUCTION
Prostate cancer (PC) is the fifth leading cause of cancer in male population worldwide. In western countries, it represents the most com-monly diagnosed cancer in men. Autopsy studies highlighted the fact that the prevalence of PC in men 70 years of age or older is around 80% (1-3).
Prostate-specific antigen (PSA) is widely
ly detection of PC (4). Namely, its introduction in routine urological clinical practice in the early 1980s deeply influenced PC diagnosis and mana-gement, with a consequent reduction in PC-rela-ted mortality during the past three decades (5-7).
ficity, with the positive predictive value around 25%, leading to a huge number of false-positive results and up to 75% unnecessary prostate biop-sies. Secondly, PSA also has low sensitivity, with about one-third of all PC cases with the level of this marker below the value of 4ng/mL. Finally, the findings from numerous studies have been highlighted that almost 60% of all PC operative treated patients had so-called indolent tumors, characterized with low malignant potential (8, 9). Keeping in mind this fact, it could be hypothesized that majority of these patients were over-detected and subsequently over-treated. All these facts cle-arly pointed out that PSA alone has no satisfied predictive value in PC detection.
Consequently, in more recent years, con-siderable efforts have been made to find new specific markers for early PC detection with im-proved potential to detect its aggressive clinical form. In this line, the introduction of several PSA derivatives (free PSA [fPSA], percentage of free PSA [%fPSA], PSA density, PSA velocity, Pros-tate health index [PHI],) in clinical practice sig-nificantly improved the accuracy and validity of PSA in identifying PC. Moreover, fPSA was found to include several subforms, such as a precursor form of PSA (proPSA). Theoretically, seven isofor-ms of proPSA should exist of which [-2] proPSA (p2PSA) is the most stable form. The results from several studies suggested that p2PSA has the hi-ghest specificity in PC detection (10, 11). It origi-nates mainly from malignant prostate epithelium, especially in periphery zone of prostate, which is the dominant location of cancer occurrence (12, 13). Therefore, nowadays this marker represents the most promising tool for early PC detection. Additionally, it has been shown that p2PSA is also capable to make distinguish between clinically insignificant tumor (low grade) and cancer that needs to be treated.
Keeping in mind all mentioned above, the objective of this study was to assess predictive value of tumor markers p2PSA and its derivates, %p2PSA, and PHI in detection of patients with aggressive PC (assumed as Gleason score ≥7) in a sub-cohort of men whose total PSA ranged from 2 to 10ng/mL.
MATERIALS AND METHODS
Design, setting and participants
Study was conducted in Clinic of Urolo-gy, Clinical Center of Serbia, Belgrade, from Ja-nuary 2012 to JaJa-nuary 2014. This cross-sectional investigation included 129 consecutive patients who underwent prostate biopsy for the first time. Inclusion criteria were: age over 50 years, no pre-vious history of PC, normal digital rectal exami-nation findings, serum PSA in interval between 2 and 10ng/mL, and minimally 12 biopsy cores taken from patient. Exclusion criteria were: pre-vious consumption of medications that influence on PSA level (Finasteride, Dutasteride), previous surgical intervention on prostate (Transurethral prostatectomy TURP, biopsy), acute prostatitis, urinary tract infection, and previous androgen therapy.
Study was approved by Ethic Committee of Clinical Center of Serbia and Faculty of Medicine, University of Belgrade. All patients were comple-tely informed about procedure and possible com-plications. Written consent was obtained from all patients.
Interventions, measurement and data collection
At first examination, complete patient his-tory (urological and general) and urological exa-mination was done. Subsequently, blood samples were drawn and immediately stored in refrigera-tor at 4ºC temperature. Serum samples from who-le blood were obtained by centrifuge and stored at-20ºC. When all samples were collected, serum PSA, fPSA and p2PSA were measured. Our labora-tory routinely measures only serum PSA levels by Abbott test with CMIA technique. Access Hybrite-ch assays (Backman Coulter Inc., Brea, CA, USA) were used to measure serum PSA, fPSA and p2P-SA. p2PSA is measured using Hybertech p2PSA automated immunoassay. Hybritech calibrations were used for PSA and fPSA levels. After obtai-ning p2PSA, fPSA and PSA results, these were combined to calculate PHI:
In addition, %p2PSA was calculated using follow-ing formula:
%p2PS = p2PSA / (fPSAx1000) x 100. (equation 2)
Blood analysis also included C-reactive protein (CRP), serum protein and testosterone.
Physical examination comprised digital rectal examination. Furthermore, all participants underwent standard transrectal ultrasonography guided prostate biopsy. Minimal 12 cores biopsies were taken. Six cores were taken from peripheral zone of each lobe, 2 of those cores were form apex, 2 from middle part and 2 from base of prostate.
Preparation of biopsy core and microsco-pically examination was done in Department of Pathology, Clinical Center of Serbia. Biopsy speci-mens were placed in specific single-core specimen containers and then processed and evaluated by experienced genitourinary pathologist. Prostate cancer was identified and graded according to In-ternational Society of Urological Pathology defi-nitions (14).
Pathological findings were divided into two groups, with and without PC. Findings of patients with confirmed cancer were further in-vestigated to calculate Gleason score. Afterward, patients with cancer were divided into subgroups depending on Gleason score, patients with score less than 7 and patients with 7 and higher Gleason score.
Statistical analysis
Data are presented as counts (percents), mean±sd or median (25th-75th percentile), de-pending on data type and distribution. T test and Mann-Whitney U test tests were used for group comparisons. Receiver operating characteristics (ROC) area under the curve (AUC) was used to assess significant marker of PC and to determi-ne cut-off value. Univariate and multivariate lo-gistic regression were used to fit prediction of PC by explanatory variables. Hosmer-Lemeshow test was used to check for goodness of fit of logistic regression model (calibration of the model). All statistical analyses were performed in SPSS 20.0
(IBM corp.) statistical software. All p values less than 0.05 were considered significant.
RESULTS
Study included 129 patients, 65 with PC (50.4%) and 64 without PC (49.6%). Basic clinical characteristics of the study population are pre-sented in Table-1. Significant differences between examined groups were observed in fPSA, %fPSA, %p2PSA and PHI. There were no significant diffe-rences between groups in respect of values of pro-teins, CRP and testosterone. Furthermore, mean age was also very similar in both groups.
The distribution of the PSA value cate-gory according to the presence of PC is shown in Table-2. According to this analysis, there was no statistically significant difference in this variable among patients with and without presence of this malignancy (p=0.820).
Table-3 represents area under the curve (AUC), cut off values and sensitivity and speci-ficity for each chosen cut off value. Left side of the table represents AUC for all patients (PC and controls) while right side of the table represents AUC only for patients with PC. When analyzing diagnosis of PC, the highest area was observed in %p2PSA, following by fPSA and %fPSA, while the lowest observed in tPSA. We presented three cut--off values for %p2PSA and PHI because no ade-quate cut off was obtained on ROC graph. But, of those three variants, best ratio of sensitivity and specificity for %p2PSA would be at cut-off 1.67 and 41.67 for PHI. When analyzing diagnosis of GS ≥7 only PHI and %p2PSA are significant (PHI is almost significant, very close to conventional level of significance, 0.05). Same as for diagnosis of PC, three possible cut-off values for PHI and %p2PSA are present.
Univariate and multivariate logistic re-gression were used to assess predictive value of PSA isophorms (Table-4 and Table-5). In whole sample model, univariate analysis revealed that fPSA, %fPSA, PHI and %p2PSA are significant predictors of PC. Also, %p2PSA has highest R2
is significant (PHI and p2PSA are almost cant, very close to conventional level of signifi-cance, 0.05).
DISCUSSION
Early detection of PC remains the most important issue for general practitioners, patients, researchers, and the experts in the field of urology. During the past decades, efforts are being made to identify tools or biomarkers that can maximize early diagnosis of aggressive disease, but curable, and minimize the undesirable effects of treatment of indolent disease.
Table 1 - Basic characteristics, labaratory and Prostate Specific Antigen.
PCa Non-PCa p value
Age 65.3±6.6 64.0±6.6 0.281
tPSA 5.81±1.98 6.24±1.96 0.220
fPSA 0.84±0.46 1.21±0.62 <0.001
%fPSA 14.67±7.27 19.06±7.52 <0.001
p2PSA 19.55±14.93 18.68±12.46 0.779
%p2PSA 2.39±1.35 1.61±0.62 <0.001
PHI 54.77±31.21 39.15±15.59 <0.001
Protein 77.10±4.74 78.10±4.85 0.252
CRP 1.90 (1-3.8) 1.75 (0.9-3.3) 0.532
Testosterone 19.18±6.93 18.63±6.19 0.795
*Med (25th -75th percentile)
Table 2 - Distribution of patients with or without prostate cancer according to total prostate specific antigen.
Total PSA
Prostate cancer
No Yes
2-2.9 4 (6.2%) 5 (7.7%)
3-3.9 6 (9.4%) 8 (12.3%)
4+ 54 (84.4%) 52 (80.0%)
No significant difference between groups (p=0.808)
Table 3 - Area under the curve AUC.
Controls vs Prostate cancer (n=129) Gleason <7 vs ≥ 7 (n=65)
Area p value Cut off Sn Sp Area p
value Cut off Sn Sp
tPSA 0.563
(0.464-0.662) 0.215
3.47 90.6 9.2
0.538
(0.389-0.687) 0.608
3.530 92.0 10.0
5.55 62.5 49.2 5.275 64.0 45.0
8.42 15.6 90.8 8.175 16.0 90
fPSA 0.707
(0.617-0.798) <0.001
0.550 90.6 29.2
0.520
(0.375-0.664) 0.793
0.400 90.0 16.0
1.035 60.9 81.5 0.665 67.5 40.0
1.520 21.9 90.8 1.525 10.0 92.0
%fPSA 0.693
(0.602-0.785) <0.001
11.410 90.6 40
0.529
(0.386-0.671) 0.701
6.825 90.0 8.0
12.905 81.3 49.2 11.24 65.0 60.0
22.565 25.0 90.8 21.95 15.0 92.0
p2PSA 0.514
(0.414-0.615) 0.779
8.205 90.6 13.4
0.581
(0.436-0.726) 0.275
7.770 92.0 15.0
13.020 60.9 61.5 15.24 64.0 40.0
32.160 9.4 90.8 28.41 16.0 90
PHI 0.680
(0.588-0.772) <0.001
27.480 90.6 26.6
0.645
(0.505-0.784) 0.054
31.33 91.7 22.5
41.670 64.1 62.5 49.13 66.7 60.0
61.015 28.1 90.6 76.38 25.0 90
%p2PSA 0.723
(0.632-0.810) <0.001
1.245 90.8 34.4
0.673
(0.534-0.812) 0.020
1.356 92.0 20.0
1.673 75.4 64.1 2.495 56.0 17.5
2.368 43.1 90.6 3.076 32.0 90
Table 4 - Univariate model for prostate cancer prediction and ≥ 7 Gleason score.
Controls vs Prostate cancer (n=129) Gleason <7 vs ≥ 7 (n=65)
P value OR (95% IP) R2 H-La P value OR (95% IP) R2 H-La
tPSA 0.219 0.894 (0.749-1.069) 0.016 0.925 0.663 1.058 (0.820-1.367) 0.004 0.946
fPSA 0.001 0.247 (0.110-0.553) 0.148 0.025 0.547 0.700 (0.220-2.232) 0.008 0.040
%fPSA 0.002 0.920 (0.872-0.970) 0.111 0.604 0.419 0.970 (0.902-1.044) 0.014 0.506
p2PSA 0.737 1.004 (0.981-1.028) 0.001 0.548 0.116 1.028 (0.993-1.063) 0.061 0.185
PHI 0.001 1.037 (1.015-1.060) 0.146 0.993 0.052 1.021 (1.000-1.042) 0.102 0.983
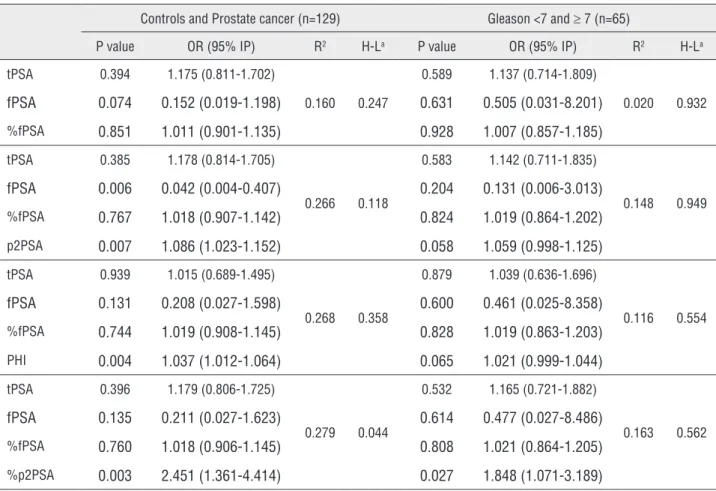
value for detection of high malignancy potential, especially %p2PSA which achieved the best re-sults and statistical significance. Other two are near statistical significance and it is very likely that larger sample size could provide significance. Also, in multivariate models, it has been shown that inclusion of p2PSA, %p2PSA and PHI incre-ased prediction of PC presence and level of its ag-gressiveness (assessed by Gleason score), although p2PSA and PHI did not reach conventional level of statistical significance in Gleason score groups (<7 and 7+), but p values are very close to 0.05.
During the past years numerous studies have been performed in other to explore the predictive value of different biomarkers in PC detection (15-22). Le et al. showed evidence in distinguishing PC from benign disease using the %p2PSA in 2.034 men with PSA between 2.5 and
Table 5 - Multivariate model for prostate cancer prediction and ≥ 7 Gleason score.
Controls and Prostate cancer (n=129) Gleason <7 and ≥ 7 (n=65)
P value OR (95% IP) R2 H-La P value OR (95% IP) R2 H-La
tPSA 0.394 1.175 (0.811-1.702)
0.160 0.247
0.589 1.137 (0.714-1.809)
0.020 0.932
fPSA 0.074 0.152 (0.019-1.198) 0.631 0.505 (0.031-8.201)
%fPSA 0.851 1.011 (0.901-1.135) 0.928 1.007 (0.857-1.185)
tPSA 0.385 1.178 (0.814-1.705)
0.266 0.118
0.583 1.142 (0.711-1.835)
0.148 0.949
fPSA 0.006 0.042 (0.004-0.407) 0.204 0.131 (0.006-3.013)
%fPSA 0.767 1.018 (0.907-1.142) 0.824 1.019 (0.864-1.202)
p2PSA 0.007 1.086 (1.023-1.152) 0.058 1.059 (0.998-1.125)
tPSA 0.939 1.015 (0.689-1.495)
0.268 0.358
0.879 1.039 (0.636-1.696)
0.116 0.554
fPSA 0.131 0.208 (0.027-1.598) 0.600 0.461 (0.025-8.358)
%fPSA 0.744 1.019 (0.908-1.145) 0.828 1.019 (0.863-1.203)
PHI 0.004 1.037 (1.012-1.064) 0.065 1.021 (0.999-1.044)
tPSA 0.396 1.179 (0.806-1.725)
0.279 0.044
0.532 1.165 (0.721-1.882)
0.163 0.562
fPSA 0.135 0.211 (0.027-1.623) 0.614 0.477 (0.027-8.486)
%fPSA 0.760 1.018 (0.906-1.145) 0.808 1.021 (0.864-1.205)
%p2PSA 0.003 2.451 (1.361-4.414) 0.027 1.848 (1.071-3.189)
a Hosmer and Lemeshow test p value
10ng/mL, normal DRE (20). Moreover, in their in-vestigation, Stephan et al. showed that the PHI, the absolute value of 60, had greater power to pre-dict clinically significant prostate cancer (Gleason
population confirmed and extended these findings and also provided further evidence that %p2PSA and PHI could be considered as power tools for improvement the accuracy in the early detection of clinically significant PC.
In our investigation, we used ROC and AUC analyses, as a part of comprehensive statis-tical approaches in assessing significant cut-off values of different potential PC biomarkers. Ex-tensive employment of the existing literature led to the conclusion that %p2PSA and PHI have the highest AUC, leading to the hypothesis that these indicators represented the most promising predic-tors of prostate malignancy (10, 11, 23-26). Accor-ding to these finAccor-dings, PHI has the highest AUC, but very similar to %p2PSA. The results from our study have revealed that in our cohort of males %p2PSA represented leading PC biomarker, with the highest AUC. This potential predictive abili-ty has been noted in both, discriminating benign from malignant prostate tumor, and more aggres-sive (Gleason score ≥7) from less aggressive forms of PC (Gleason score <7). Similar to other authors, PHI revealed high discriminating power, but less than %p2PSA, especially in discriminating high aggressive forms of PC from less aggressive forms. Results of our study also indicated high discre-pancy between sensitivity and specificity of these markers. Similar to other researchers, 90% sensiti-vity is followed by low specificity and vice versa. Nevertheless, %p2PSA and PHI demonstrated the best ratio between sensitivity and specificity. Sin-ce ideal combination of sensitivity and specificity in our study is not available, we presented cut off values for combination of sensitivity and speci-ficity of 90%, which is also suggested in others similar investigations (19, 26, 27).
With the aim to assess the independent predictors of prostate malignancy, we also perfor-med the logistic regression analyses. The results from univariate logistic regression showed that %p2PSA and PHI had the highest predictive va-lue for PC detection, as well as for distinguished clinical form with Gleason score ≥7 from the non--clinically significant one. The results from this type of analysis were in accordance with those obtained in ROC analysis. Namely, %p2PSA appe-ared to be a better indicator of malignancy than
PHI, especially when aggressive form is the de-pendent variable. In this regression analysis PHI is also near conventional level of significance (p value is 0.054 in AUC analysis and 0.052 in logistic regression) and it is possible that higher sample size could reach statistical significance at conventional level. However, in multivariate mo-del, %p2PSA remained significant predictor of PC and its aggressive forms, but PHI remained signi-ficant only in PC prediction. It is very important to note that in prediction of aggressive form, p value is higher in multivariate than in univariate mo-del. Therefore, the addition of %p2PSA and PHI in multivariate model improved model itself, and made decision process more accurate, if based on this probability (21). Our results are in accordance with the findings from the other studies. Namely, a few prospective multicenter studies demonstra-ted that the %p2PSA and PHI have an improved prediction of clinically significant PC, both in men with a PSA between 4-10ng /mL and between 2-10ng/L (10-13, 15, 18). These biomarkers may therefore also have a role in monitoring men un-der active surveillance.
tumor potential. It is clear that more comprehen-sive estimation of tumor-related agrescomprehen-siveness should include other parametes such as: number of sections with cancer, percentage of cancer in a single section etc (27, 28).
CONCLUSIONS
Derivates of p2PSA, PHI and especially %p2PSA, represented potentially very important clinical tools for predicting presence of PC in a cohort of Serbian males. Even more, these new markers could discriminate patients with Gleason score <7 from those Gleason score ≥7, within total PSA ranging from 2 to 10ng/mL. Those findings are central to avoid over diagnosis and subse-quent over treatment.
CONFLICT OF INTEREST
None declared.
REFERENCES
1. Arnold M, Karim-Kos HE, Coebergh JW, Byrnes G, Antilla A, Ferlay J, et al. Recent trends in incidence of five common cancers in 26 European countries since 1988: Analysis of the European Cancer Observatory. Eur J Cancer. 2015;51:1164-87.
2. Siegel RL, Miller KD, Jemal A. Cancer statistics, 2015. CA Cancer J Clin. 2015;65:5-29.
3. Luengo-Fernandez R, Leal J, Gray A, Sullivan R. Economic burden of câncer across the European Union: a population-based cost analysis. Lancet Oncol. 2013;14:1165-74. 4. Abrate A, Lughezzani G, Gadda GM, Lista G, Kinzikeeva E,
Fossati N, et al. Clinical use of [-2]proPSA (p2PSA) and its derivatives (%p2PSA and Prostate Health Index) for the detection of prostate cancer: a review of the literature. Korean J Urol. 2014;55:436-45.
5. Stamey TA, Donaldson AN, Yemoto CE, McNeal JE, Sözen S, Gill H. Histological and clinical findings in 896 consecutive prostates treated only with radical retropubic prostatectomy: epidemiologic significance of annual changes. J Urol. 1998;160:2412-7.
6. Schröder FH, Hugosson J, Roobol MJ, Tammela TL, Ciatto S, Nelen V, et al. Screening and prostate-cancer mortality in a randomized European study. N Engl J Med. 2009;360:1320-8.
7. Hugosson J, Carlsson S, Aus G, Bergdahl S, Khatami A, Lodding P, et al. Mortality results from the Göteborg randomised population-based prostate-cancer screening trial. Lancet Oncol. 2010;11:725-32.
8. Jalloh M, Myers F, Cowan JE, Carroll PR, Cooperberg MR. Racial variation in prostate cancer upgrading and upstaging among men with low-risk clinical characteristics. Eur Urol. 2015;67:451-7.
9. Punnen S, Cooperberg MR. The epidemiology of high-risk prostate cancer. Curr Opin Urol. 2013;23:331-6.
10. Guazzoni G, Lazzeri M, Nava L, Lughezzani G, Larcher A, Scattoni V, et al. Preoperative prostate-specific antigen isoform p2PSA and its derivatives, %p2PSA and prostate health index, predict pathologic outcomes in patients undergoing radical prostatectomy for prostate cancer. Eur Urol. 2012;61:455-66. 11. Guazzoni G, Nava L, Lazzeri M, Scattoni V, Lughezzani G,
Maccagnano C, et al. Prostate-specific antigen (PSA) isoform p2PSA significantly improves the prediction of prostate cancer at initial extended prostate biopsies in patients with total PSA between 2.0 and 10 ng/ml: results of a prospective study in a clinical setting. Eur Urol. 2011;60:214-22.
12. Mikolajczyk SD, Marker KM, Millar LS, Kumar A, Saedi MS, Payne JK, et al. A truncated precursor form of prostate-specific antigen is a more prostate-specific serum marker of prostate cancer. Cancer Res. 2001;61:6958-63.
13. Mikolajczyk SD, Millar LS, Wang TJ, Rittenhouse HG, Marks LS, Song W, et al. A precursor form of prostate-specific antigen is more highly elevated in prostate cancer compared with benign transition zone prostate tissue. Cancer Res. 2000;60:756-9.
14. Epstein JI, Allsbrook WC Jr, Amin MB, Egevad LL; ISUP Grading Committee. The 2005 International Society of Urological Pathology (ISUP) Consensus Conference on Gleason Grading of Prostatic Carcinoma. Am J Surg Pathol. 2005;29:1228-42.
15. Tan LG, Tan YK, Tai BC, Tan KM, Gauhar V, Tiong HY, et al. Prospective validation of %p2PSA and the Prostate Health Index, in prostate cancer detection in initial prostate biopsies of Asian men, with total PSA 4-10 ng ml (-1). Asian J Androl. 2016. 16. Schwen ZR, Tosoian JJ, Sokoll LJ, Mangold L, Humphreys
E, Schaeffer EM, et al. Prostate Health Index (PHI) Predicts High-stage Pathology in African American Men. Urology. 2016;90:136-40.
17. Na R, Ye D, Liu F, Chen H, Qi J, Wu Y, et al. Performance of sérum prostate-specific antigen isoform [-2]proPSA (p2PSA) and the prostate health index (PHI) in a Chinese hospital-based biopsy population. Prostate. 2014;74:1569-75. 18. Lazzeri M, Haese A, de la Taille A, Palou Redorta J, McNicholas
19. Lazzeri M, Haese A, Abrate A, de la Taille A, Redorta JP, McNicholas T, et al. Clinical performance of serum prostate-specific antigen isoform [-2]proPSA (p2PSA) and its derivatives, %p2PSA and the prostate health index (PHI), in men with a family history of prostate cancer: results from a multicentre European study, the PROMEtheuS project. BJU Int. 2013;112:313-21.
20. Le BV, Griffin CR, Loeb S, Carvalhal GF, Kan D, Baumann NA, et al. [-2]Proenzyme prostate specific antigen is more accurate than total and free prostate specific antigen in differentiating prostate cancer from benign disease in a prospective prostate cancer screening study. J Urol. 2010;183:1355-9.
21. Stephan C, Vincendeau S, Houlgatte A, Cammann H, Jung K, Semjonow A. Multicenter evaluation of [-2]proprostate-specific antigen and the prostate health index for detecting prostate cancer. Clin Chem. 2013;59:306-14.
22. Loeb S, Sanda MG, Broyles DL, Shin SS, Bangma CH, Wei JT, et al. The prostate health index selectively identifies clinically significant prostate cancer. J Urol. 2015;193:1163-9. 23. Jansen FH, van Schaik RH, Kurstjens J, Horninger W, Klocker
H, Bektic J, et al. Prostate-specific antigen (PSA) isoform p2PSA in combination with total PSA and free PSA improves diagnostic accuracy in prostate cancer detection. Eur Urol. 2010;57:921-7.
24. Scattoni V, Lazzeri M, Lughezzani G, De Luca S, Passera R, Bollito E, et al. Head-to-head comparison of prostate health index and urinary PCA3 for predicting cancer at initial or repeat biopsy. J Urol. 2013;190:496-501.
25. Filella X, Foj L, Augé JM, Molina R, Alcover J. Clinical utility of %p2PSA and prostate health index in the detection of prostate cancer. Clin Chem Lab Med. 2014;52:1347-55. 26. Abrate A, Lazzeri M, Lughezzani G, Buffi N, Bini V, Haese
A, et al. Clinical performance of the Prostate Health Index (PHI) for the prediction of prostate cancer in obese men: data from the PROMEtheuS project, a multicentre European prospective study. BJU Int. 2015;115:537-45.
27. Heidenreich A, Bastian PJ, Bellmunt J, Bolla M, Joniau S, van der Kwast T, et al. EAU guidelines on prostate cancer. Part II: Treatment of advanced, relapsing, and castration-resistant prostate cancer. Eur Urol. 2014;65:467-79.
28. Mottet N, Bellmunt J, Briers E et al. EAU guidelines on prostate cancer. European Association of Urology 2015
_______________________ Correspondence address: