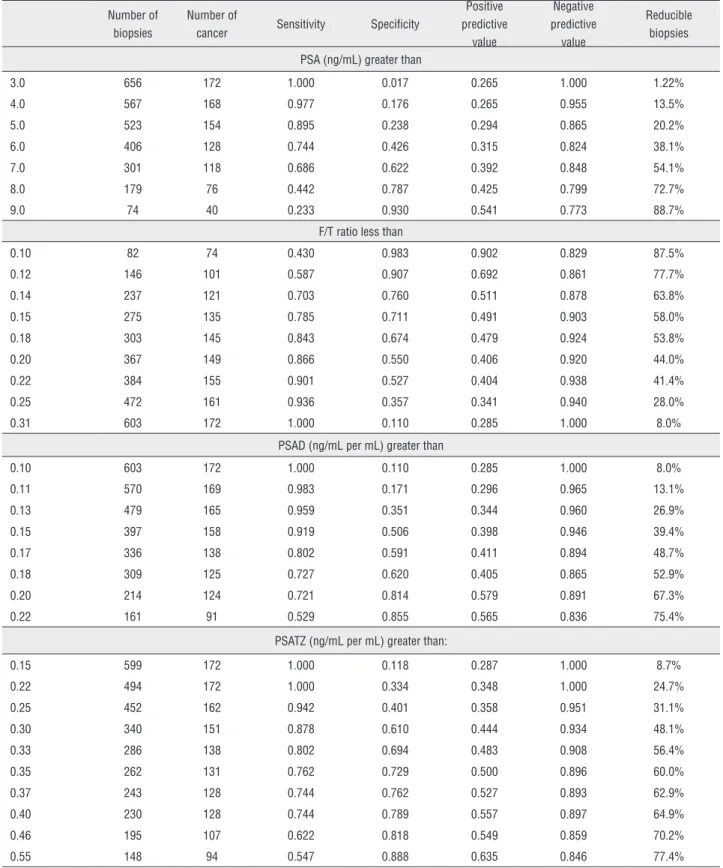
Impact of PSA density of transition zone as a potential parameter in reducing the number of unnecessary prostate biopsies in patients with PSA levels between 2.6 and 10.0 ngmL
Texto
Imagem

Documentos relacionados
Os resultados obtidos demonstraram que os comprimidos e solução oral de paracetamol distribuídos na rede pública de saúde desses municípios estão de acordo com a
Variables included in the model were age, prostate specific antigen (PSA), digital rectal examination, prostate volume and abnormal sono- graphic findings.. We constructed
a) Existem mais crianças em idade escolar frequentando aulas atualmente do que em qualquer outro período da nossa história. b) Existe mais crianças em idade escolar. frequentando
The incidence of prostate cancer in men with prostate specific antigen greater than 4.0 ng/ml: a ran- domized study of 6 versus 12 core transperineal prostate biopsy.. Emiliozzi
Objective: To determine the clinical usefulness of prostate-specific antigen (PSA) density in the transition zone (PSADTZ) for increasing the specificity in early detection of
Objective: Determine how serum prostate-specific antigen (t-PSA) levels and free PSA (f/t PSA) ratio change following transurethral resection of the prostate (TURP).. Materials
Also, baseline prostate specific antigen (PSA), prostate volume, creatinine, International Prostatic Symptom Score (IPSS), IPSS-Quality of Life (IPSS-QoL), maximal urinary flow
= number, ASAP = atypical small acinar proliferation; HGPIN = high grade prostatic intraepithelial neoplasia; PSA = prostate-specific antigen; %fPSA = percent of
