Differentiated Native American Genome Regions
Josyf C. Mychaleckyj,*
,1,2Alexandre Havt,
3,4Uma Nayak,
1Relana Pinkerton,
5Emily Farber,
1Patrick Concannon,
6,7Aldo A. Lima,
3,4and Richard L. Guerrant
51
Center for Public Health Genomics, University of Virginia, Charlottesville, VA
2
Department of Public Health Sciences, University of Virginia, Charlottesville, VA
3
Departamento de Fisiologia e Farmacologia, Universidade Federal do Ceara, Fortaleza, Brazil
4
INCT-Instituto de Biomedicina Universidade Federal do Ceara, Fortaleza, Brazil
5
Center for Global Health, University of Virginia, Charlottesville, VA
6
Genetics Institute, University of Florida, Gainesville, FL
7
Department of Pathology Immunology and Laboratory Medicine, University of Florida, Gainesville, FL
*Corresponding author:E-mail: [email protected]. Associate editor:Rasmus Nielsen
Abstract
Despite its population, geographic size, and emerging economic importance, disproportionately little genome-scale research exists into genetic factors that predispose Brazilians to disease, or the population genetics of risk. After iden-tification of suitable proxy populations and careful analysis of tri-continental admixture in 1,538 North-Eastern Brazilians to estimate individual ancestry and ancestral allele frequencies, we computed 400,000 genome-wide locus-specific branch length (LSBL) Fst statistics of Brazilian Amerindian ancestry compared to European and African; and a similar set of differentiation statistics for their Amerindian component compared with the closest Asian 1000 Genomes pop-ulation (surprisingly, Bengalis in Bangladesh). After ranking SNPs by these statistics, we identified the top 10 highly differentiated SNPs in five genome regions in the LSBL tests of Brazilian Amerindian ancestry compared to European and African; and the top 10 SNPs in eight regions comparing their Amerindian component to the closest Asian 1000 Genomes population. We found SNPs within or proximal to the genes CIITA (rs6498115), SMC6 (rs1834619), and KLHL29 (rs2288697) were most differentiated in the Amerindian-specific branch, while SNPs in the genes ADAMTS9 (rs7631391),DOCK2(rs77594147),SLC28A1(rs28649017),ARHGAP5(rs7151991), andCIITA(rs45601437) were most highly differentiated in the Asian comparison. These genes are known to influence immune function, metabolic and anthropometry traits, and embryonic development. These analyses have identified candidate genes for selection within Amerindian ancestry, and by comparison of the two analyses, those for which the differentiation may have arisen during the migration from Asia to the Americas.
Key words:ancestry, selection, admixture, genetic differentiation, Native American, Brazil.
Introduction
In the last three decades, Brazil has undergone a rapid tran-sition from low-middle income to a burgeoning high-income country, and this economic development has led to a public health paradox; the diseases of poverty such as infectious diseases and malnutrition, although in decline, still exist (Paim et al. 2011;Victora et al. 2011), but now co-exist with an increasing incidence of “western” lifestyle metabolic dis-eases (de Carvalho Vidigal et al. 2013). Genetic analysis of susceptibility is an important tool to understand both dis-eases of poverty and wealth, but to apply genetics to Brazilian sub-populations, an understanding of the structure of the underlying genetic admixture is needed.
Twenty-first century Brazil has emerged as a genetic melt-ing pot of races and ethnic groups reflectmelt-ing its successive history of conquest, slavery, and migration. Three
trans-continental population groups, Europeans, Africans, and native American Indians (Amerindians) substantially contribute to the variable ancestry within Brazil’s population. Although exact estimates differ, there were at least three million indigenous Amerindians in Brazil when Portuguese explorers first landed in Bahia in 1500, but their numbers dropped precipitously during the next centuries through en-slavement and forced labor, conflict with the invading colo-nists, and European-borne disease epidemics, although their numbers have rebounded somewhat since the mid-20th cen-tury, to a 2010 census enumeration of 820 thousand (Ricardo and Ricardo 2011) (Fundac¸~ao Nacional doIndio, http:www. funai.gov.br; last accessed October 13, 2015). In the period after initial discovery by Europeans, migration gradually in-creased so that by 1,760, approximately 700 thousand Europeans had migrated to Brazil (Ven^ancio 2000). At the
Article
ßThe Author 2017. Published by Oxford University Press on behalf of the Society for Molecular Biology and Evolution.
This is an Open Access article distributed under the terms of the Creative Commons Attribution License (http://creativecommons. org/licenses/by/4.0/), which permits unrestricted reuse, distribution, and reproduction in any medium, provided the original work is
same time, to supplement and ultimately largely replace in-digenous Amerindians as a workforce, Africans were im-ported as slave labor to work on colonial plantations, mostly for sugar production, but also for wood and other agricultural products (Schwartz 1978). African slave trafficking brought to Brazil an estimated total of 4.9 million slaves, 40% of all Africans shipped to the Americas (Bergad 2007).
In comparison to its population size and economic status, relatively little genetic work has been performed on Brazilian populations using genome-wide genetic panels for analysis (Giolo et al. 2012;Kuhn et al. 2012;Kehdy et al. 2015; Lima-Costa et al. 2015). Much of the previous research in Brazil, even during the current genomic era, has used genetic panels with limited numbers of SNPs leading to regionally biased estimates of population genetic parameters with high vari-ance (Cardena et al. 2013;Manta et al. 2013;Vieira et al. 2013;
Durso et al. 2014;Ruiz-Linares et al. 2014;Magalhaes da Silva et al. 2015). The majority of the genetics research has been aimed at estimating admixture and correlation with self-reported or socially perceived race groups, with little focus on genetic variants influencing disease risk (Guindalini, Colugnati, et al. 2010; Guindalini, Lee, et al. 2010; Suarez-Kurtz 2010;Suarez-Kurtz et al. 2012). As a necessary precursor to our work to identify genetic factors underlying infant growth and development, we undertook a genome-wide and locus-specific analysis of admixture in our study popula-tions recruited in North-Eastern Brazil, centered on the cap-ital city of Ceara state, Fortaleza, but also including
participants from neighboring Paraıba, Pernambuco, and Piauı states. We developed improved estimates of locus-specific admixture and allele frequencies, and used these to identify highly differentiated outlier SNPs in the Amerindian component of the Brazilian ancestry as candidates for SNPs and genes under selection pressure.
Results
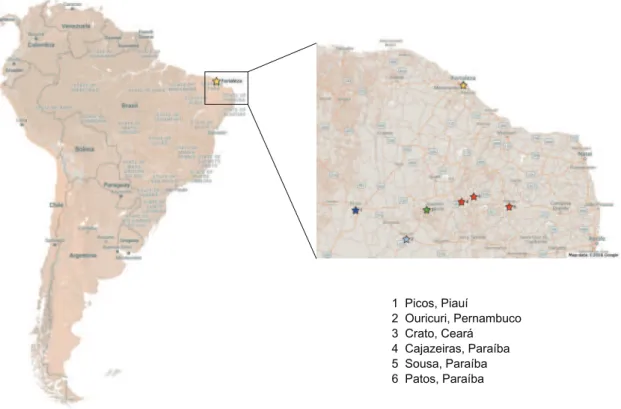
We genotyped 2,010 DNA samples from six Brazil studies on the Affymetrix Axiom LAT-1 Latin American Array. These samples were drawn from six studies in the North-Eastern region of Brazil, centered on the city of Fortaleza, Ceara state, but also including six other towns or cities (fig. 1). After qual-ity control, we were left with 1,538 samples unrelated to second degree, and 755,801 SNPs (table 1). The detailed qual-ity control steps and results are available insupplementary table S1,Supplementary Materialonline.
Unsupervised Principal Component Analysis
Identified the Latent Major Axes of Trans-Continental
Ancestry Defined by Genetic Variation within the
Brazil Samples
Figure 2shows the results from the initial unsupervised prin-cipal component analysis (PCA) of the 1,538 Brazil samples with all publicly available 1000 Genomes (1KG) population samples in the 2013 release (1000 Genomes Project Consortium et al. 2012) projected onto the first two axes of
1 Picos, Piauí
2 Ouricuri, Pernambuco 3 Crato, Ceará 4 Cajazeiras, Paraíba 5 Sousa, Paraíba 6 Patos, Paraíba
Table 1.The Six North-Eastern Brazil Studies and Results of the Genome-Wide Genotyping Quality Control (QC)
Gonc¸alves Dias Mal-ED Birth Mal-ED Case Control
Recodisa Case Control
PU Zinc-Arginine Trial
PU Zinc Vitamin A Trial
Total
Study Typea Birth Cohort Birth Cohort Prospective
Case-Control
Prospective Case-Control
Randomized Clinical
Trial
Randomized Clinical Trial Location Fortaleza,
Gonc¸alves Dias Favela
Fortaleza Fortaleza, IPREDE 6 Cities in 4 North-Eastern States
Fortaleza, Parque Universitario
Fortaleza, Parque Universitario Enrollment 1989–1993 2010–2014 2010–2014 2010–2014 2006–2010 2000–2006
Samples Genotyped 172 300 368 1044 126 109 2,119 Samples
Post-Genotyping QC
110 276 336 658 95 63 1,538
SNP QCb All Cohorts: SNPs Total SNPs on
Affymetrix
Axiom LAT-1 Array 4
818,154
Affymetrix SNP QC: SNPs dropped
62,353 SNPs Remaining 755,801 Call Rate<99%
þMAFc<5%
345,629 SNPS Remaining 410,172
aThe top half of the table shows the number of DNA samples genotyped by study and the number remaining after genome-wide genotyping QC.
bThe bottom half of the table shows the initial total number of SNPs on the Affymetrix array used and the number remaining after QC. The same SNP results pertain to all
studies and are only shown once for clarity.
cMAF: Minor Allele Frequency.
0.2 0.1 0.0 0.1
0.1 0.0 0.1
PC1
PC2
Population
ACB ASW BEB BRN CDX CEU CHB CHS CLM ESN FIN GBR GIH GWD IBS ITU JPT KHV LWK MSL MXL PEL PJL PUR STU TSI YRI
maximal genetic variation defined solely by the Brazil samples (PC1PC2). The full 1KG populations and three letter ab-breviations are explained in supplementary table S2,
Supplementary Materialonline and subsets intables 2and
3. Brazilians from North-Eastern Brazil, labeled BRN, are
plotted in green glyphs throughout. Using only the BRN sam-ples to define the principal components (PCs) identifies and ranks the predominant axes of variation, compared to pro-jection onto all samples which addresses the different ques-tion of the amount of each ancestry within the samples
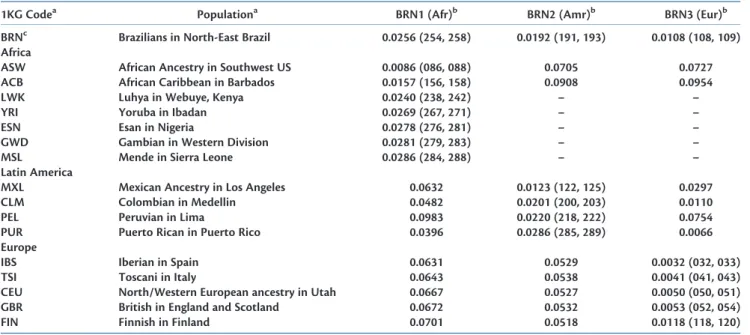
Table 2.Genetic Differentiation (Fst) between the Ancestral Brazilian Admixture Components from an Unsupervised ADMIXTURE Analysis and Reference 1000 Genomes Populations Containing Major African, Latin American, and European Ancestry
1KG Codea Populationa BRN1 (Afr)b BRN2 (Amr)b BRN3 (Eur)b
BRNc Brazilians in North-East Brazil 0.0256 (254, 258) 0.0192 (191, 193) 0.0108 (108, 109)
Africa
ASW African Ancestry in Southwest US 0.0086 (086, 088) 0.0705 0.0727 ACB African Caribbean in Barbados 0.0157 (156, 158) 0.0908 0.0954 LWK Luhya in Webuye, Kenya 0.0240 (238, 242) – – YRI Yoruba in Ibadan 0.0269 (267, 271) – – ESN Esan in Nigeria 0.0278 (276, 281) – – GWD Gambian in Western Division 0.0281 (279, 283) – – MSL Mende in Sierra Leone 0.0286 (284, 288) – – Latin America
MXL Mexican Ancestry in Los Angeles 0.0632 0.0123 (122, 125) 0.0297 CLM Colombian in Medellin 0.0482 0.0201 (200, 203) 0.0110 PEL Peruvian in Lima 0.0983 0.0220 (218, 222) 0.0754 PUR Puerto Rican in Puerto Rico 0.0396 0.0286 (285, 289) 0.0066 Europe
IBS Iberian in Spain 0.0631 0.0529 0.0032 (032, 033) TSI Toscani in Italy 0.0643 0.0538 0.0041 (041, 043) CEU North/Western European ancestry in Utah 0.0667 0.0527 0.0050 (050, 051) GBR British in England and Scotland 0.0672 0.0532 0.0053 (052, 054) FIN Finnish in Finland 0.0701 0.0518 0.0118 (118, 120)
a1KG populations BEB, CDX, CHB, CHS, GIH, ITU, PJL, JPT, KHV, and STU are not shown since they were not in the closest population groups by ranked Fst and were not
predominantly of the putative ancestral group.
bThe 95% confidence interval (CI) from bootstrap percentile (B¼10,000 replicates) is shown for the closest 1KG populations for each inferred component ancestry as last 3
digits only. CIs are not shown for other Fst values. – (dash) indicates Fst>0.1 (not shown for clarity).
cBRN row shows the Fst with the source Brazil samples without segregation of putative ancestral components for comparison.
Table 3.Estimated Genetic Differentiation (Fst) between the Brazil Ancestral Admixture Components from a Supervised ADMIXTURE Analysis and Reference 1000 Genomes Populations Containing Major African, Latin American, and European Ancestry
1KG Codea Populationa BRN1 (Afr)b BRN2 (Amr)b BRN3 (Eur)b BRNc Brazilians in North-East Brazil 0.0837 (832, 843) 0.0801 (796, 806) 0.0154 (153, 155) Africa
ASW African Ancestry in Southwest US 0.0132 (131, 134) – 0.0821 ACB African Caribbean in Barbados 0.0074 (073, 075) – – LWK Luhya in Webuye, Kenya 0.0102 (101, 103) – – YRI Yoruba in Ibadan 0.0040 (039, 040) – – ESN Esan in Nigeria 0.0036 (035, 036) – – GWD Gambian in Western Division 0.0107 (106, 108) – – MSL Mende in Sierra Leone 0.0084 (084, 085) – – Latin America
MXL Mexican Ancestry in Los Angeles – 0.0375 (372, 377) 0.0362 CLM Colombian in Medellin – 0.0689 (684, 693) 0.0148 PEL Peruvian in Lima – 0.0076 (075, 077) 0.0867 PUR Puerto Rican in Puerto Rico – 0.0911 (905, 917) 0.0094 Europe
IBS Iberian in Spain – – 0.0013 (012, 013) TSI Toscani in Italy – – 0.0030 (029, 031) CEU North/Western European ancestry in Utah – – 0.0039 (038, 040) GBR British in England and Scotland – – 0.0041 (040, 042) FIN Finnish in Finland – – 0.0117 (115, 118)
a
1KG populations BEB, CDX, CHB, CHS, GIH, ITU, PJL, JPT, KHV, STU are not shown since they were not in the closest population groups by ranked Fst and were not predominantly of the putative ancestral group.
b
Analogous totable 2, the supervised ADMIXTURE analysis of the Brazil samples usedN¼30 reference sample genome-wide profiles from each of the ancestral proxy groups. The 95% confidence interval from bootstrap percentile (10,000 replicates) is shown for the closest 1KG populations for each inferred component ancestry as last 3 digits only. – (dash) indicates Fst>0.1 (not shown for clarity). CIs are not shown for other Fst values.
defined by the proxy populations. Projection of the 1KG sam-ples onto the BRN axes identified a triangular structure of three continental clusters with PC1 as a predominantly Africa—Europe admixture axis and PC2 separating Native American genetic variation from the European and African poles. Hence the Brazil samples contained African, European, and Native American ancestry and admixture between these continental groups explained the greatest fraction of the ge-netic variation in the samples. At the negative Native American pole of the PC2 axis the density of Lima Peruvian 1KG samples (PEL) increased, with outlier samples from other Hispanic 1KG populations including Mexicans from Los Angeles (MXL) and Columbians from Medellin (CLM). This suggested that the PEL group might form the basis of a latter day proxy for the Native American ancestry component within the Brazilians. Higher principal components 3–15 de-fined latent variation within the Brazil samples without addi-tional structure in the 1KG reference samples. For comparison purposes, we generated PCA plots using all BRN and 1KG samples in a joint analysis of total genetic variation; these are available insupplementary figures S15– S28,Supplementary Materialonline, following othersupple mentary figures.
Unsupervised Admixture Analysis on Brazilian
Samples Recapitulated the PCA Results to Identify
Major Admixing Ancestral Groups
We recapitulated the PCA results in an unsupervised analysis using ADMIXTURE 1.23 (Alexander et al. 2009;Alexander and Lange 2011). We tested all models from K¼1–10 for the Brazil samples and found that K¼3 minimized the cross-validation error, suggesting a latent three ancestral cluster model best fitted the data (supplementary fig. S1,
Supplementary Material online). We computed pairwise Hudson Fst values (Bhatia et al. 2013) between the three inferred ancestral components and 1KG populations (table 2). The first ancestral component in the North-Eastern Brazil samples (BRN1) was genetically closest to 1KG populations containing a significant African component, but was closest to African Americans in the US South-West (ASW) and African Caribbeans in Barbados (ACB), populations contain-ing European admixture. This was most likely due to imper-fect partitioning of genetic variance between admixing continental components and European admixture retained within the inferred Brazil African component. Of the 1KG populations recruited in Africa, the Luhya in Webuye, Kenya (LWK) were more genetically similar by Fst than the Western sub-Saharan African populations of Yoruba in Nigeria (YRI), Esan in Nigeria (ESN), Gambians in Western Division (GWD), and Mende in Sierra Leone (MSL). The third component, BRN3, was closest to European populations, no-tably the Southern European populations from Spain (IBS) and Italy (TSI). The second component BRN2 was closest to Latin American recruited populations, Mexicans in Los Angeles (MXL), Columbians in Medellin (CLM), and then PEL, indicating a major Native American component. The
population ranking by similarity again reflected imperfect partitioning and residual nonAmerindian admixture.
Supervised Africa-Centric PCA Identified Recent
West-Central African Admixture in the Brazilians and
More Ancient Similarity to Ancestral East African
Populations
To better understand the finding that the African (BRN1) ancestral admixture component was most similar to the LWK population, we performed a supervised Africa-centric PCA and projected the remaining 1KG and Brazil samples on to genetic coordinates generated from the 1KG samples of sub-Saharan populations in Africa (ESN, YRI, GWD, MSL, and LWK;fig. 3). PC1 distinguishes an East-West sub-Saharan axis with the Luhya from Kenya (LWK) samples at most negative PC1 to The Gambian (GWD) samples most positive, with the Yoruban (YRI) and Esan (ESN) Nigerian populations interme-diate. The Brazil (BRN) and remaining 1KG populations clearly segregated with the Central African LWK samples on this axis, revealing the African source of ancient founding populations of Europe, Asia, and the Americas (Bryc et al. 2010). PC2 in figure 3distinguishes the degree of Eurasian admixture in the sub-Saharan African populations, with more Eurasian admixture in The Gambia (GWD) and Kenya (LWK) than in the Mende of Sierra Leone (MSL) or YRI/ESN (Bhatia et al. 2011;Gurdasani et al. 2015). The Brazilians (and ACB and ASW) are smeared along an axis from the centroid of the nonAfrican 1KG cluster towards the West-Central African YRI/ESN, representing more recent admixture with African populations that derived from near modern day Nigeria and the Gulf of Guinea, rather than further West towards Sierra Leone, Senegal, and Gambia. PC3 segregated the Mende MSL from the other West and Central African populations.
Proxy Population Samples for the Amerindian
and African Components of Ancestry in
North-Eastern Brazil
LWK African population from Africa had the highest overall genetic similarity to the Brazil African ancestral component, the goal of the admixture analysis was to remove recent ad-mixture and therefore YRI/ESN were predominantly selected as African component supervising proxy samples from the most extreme positive PC1. The numbers of samples from each 1000 Genomes group as a function of total N(proxy) are shown in
supplementary table S3,Supplementary Materialonline.
Estimates of Admixture Proportions in the Brazil
Samples Using Supervised Admixture Analysis
Having established the best 1KG proxy samples, we identified the optimal number of proxy samples to use for the super-vised analysis to maximize the precision and minimize the bias of the estimates of ancestral proportions. We varied the equal number of ancestral samples from each proxy group in supervised ADMIXTURE analyses with bootstrap estimates of standard error of ancestry proportions, reasoning that the standard error and precision would decrease with the addi-tion of more proxy samples until a minimum was reached after which addition of more samples would increase the standard error. Insupplementary figure S2,Supplementary Material online, we show that a minimum was reached with N¼30 samples of each of the three ancestral proxy groups although the minimum is broad and little changed withN¼20–50, so that even a relatively small number of supervising samples can be valuable in reducing variance of the estimates. We usedN¼30 samples for all other super-vised analyses of the Brazil samples in this work. The resulting
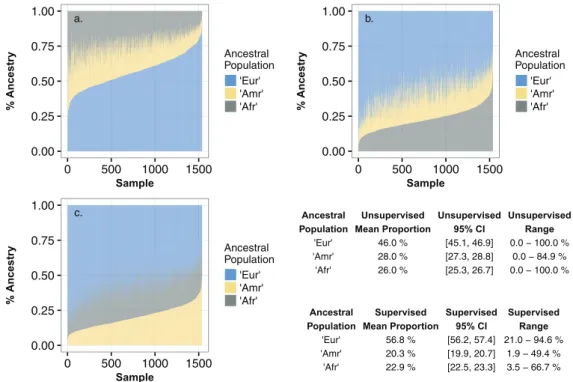
changes in estimated ancestral proportions are shown in fig-ure 4and the improved Fst estimates are shown intable 3. We labeled the three ancestral components as European (Eur), Amerindian (Amr), and African (Afr), based on similar-ity to the contemporary proxy populations. The mean pro-portion of European ancestry increased from 46.0% to 56.8% with attendant decreases in the mean proportion of Amerindian and African ancestry. Supplemental table S4,
Supplementary Material online shows the estimates of mean ancestry in each of the six study groups oftable 1. There was no significant difference in the mean ancestry between any pair of the five study groups located in Fortaleza after multiple testing correction (all
P-value>0.05/15), but the mean ancestry in the Recodisa
case control group (enrolled in six other cities across four North-Eastern states) differed from all five Fortaleza groups (P<1 1010). The participants in Recodisa had slightly
higher mean European (61% vs. 52–55%) and African ances-try (24% vs. 21–22%) and were more variable in these com-ponents, while their mean Amerindian ancestry was lower (15% vs. 24–26%) and less variable.
The Most Highly Genetically Differentiated Loci along
the Amerindian Branch from an Ancestral Population
of the Three Admixture Components of Brazil
We used the method of locus-specific branch length (Shriver et al. 2004;Mattiangeli et al. 2006;Bigham et al. 2010;Bhatia et al. 2011) to compute the Fst statistic for the latter day Amerindian ancestry component in the Brazil samples a.
0.0 0.1 0.2
0.10 0.05 0.00 0.05
PC1
PC2
b.
0.1 0.0 0.1
0.0 0.1 0.2
PC2
PC3
Population
ACB ASW BEB BRN CDX CEU CHB CHS CLM ESN FIN GBR GIH GWD
IBS ITU JPT KHV LWK MSL MXL PEL PJL PUR STU TSI YRI
relative to a hypothetical single ancestral population from which the European, Amerindian, and African admixture components emerged. This is monotonically related to the population branch statistic method as described in Materials and Methods. The overall distribution of the 400,150 SNP Fst values was exponential-like in the right hand tail, with mean, median, and 75% percentile Fst values of 0.079, 0.041, and 0.126, respectively.Table 4shows the top 10 SNPs ranked by
greatest locus branch-specific Fst values which segregate into five distinct regions. The top differentiated SNP (rs6498115) was located within the proximal promoter of the Class II, Major Histocompatibility Complex, Transactivator (CIITA)
gene, a positive regulator of class II major histocompatibility complex gene transcription, supplementary figure S3,
Supplementary Materialonline, with two additional differen-tiated flanking SNPs in linkage disequilibrium with the top a.
0.00 0.25 0.50 0.75 1.00
0 500 1000 1500
Sample
% Ancestr
y Ancestral Population
'Eur' 'Amr' 'Afr'
b.
0.00 0.25 0.50 0.75 1.00
0 500 1000 1500
Sample
% Ancestr
y Ancestral Population
'Eur' 'Amr' 'Afr'
c.
0.00 0.25 0.50 0.75 1.00
0 500 1000 1500
Sample
% Ancestr
y Ancestral Population
'Eur' 'Amr' 'Afr'
Ancestral Population
'Eur'
Unsupervised Mean Proportion
'Amr'
Unsupervised 95% CI
'Afr'
Unsupervised Range
46.0 % 28.0 % 26.0 %
[45.1, 46.9] [27.3, 28.8] [25.3, 26.7]
0.0 − 100.0 % 0.0 − 84.9 % 0.0 − 100.0 %
Ancestral Population
'Eur'
Supervised Mean Proportion
'Amr'
Supervised 95% CI
'Afr'
Supervised Range
56.8 % 20.3 % 22.9 %
[56.2, 57.4] [19.9, 20.7] [22.5, 23.3]
21.0 − 94.6 % 1.9 − 49.4 % 3.5 − 66.7 %
FIG. 4.The proportion of continental ancestry within the Brazil samples, estimated using supervised ADMIXTURE analysis. TheK¼3 ancestral components are labeled “Eur” predominantly European; “Amr” predominantly Amerindian; “Afr” predominantly African. In each panel, each individual sample along thex-axis is a narrow vertical bar with three color intervals along they-axis that are proportional to the percentage of the three ancestries and sum to 100% (y¼1.0). In panel a, the Brazil samples are sorted along thex-axis from lowest to highest fraction of Eur ancestry (blue); in panel b, sorted by fraction of African ancestry (grey); in panel c, by fraction of Amerindian ancestry (yellow). The table shows the mean proportion of each ancestry with 95% confidence interval, and range.
Table 4.The Top 10 Most Highly Differentiated Loci for the Amerindian Admixture Branch within the Brazil Samples Compared with the Putative Ancestral Population of the Three Admixture Components
CHR SNP GENPOSa POSa A1a A2a f(Eur)b f(Amr)b f(Afr)b Fstc Nearest Gened
16 rs6498115 28.170 10965511 T C 0.000 0.908 0.000 0.908 CIITA, promoter 2 rs1834619 39.407 17901485 A G 0.041 0.942 0.000 0.899 SMC6, intron 16 rs77979769 28.358 11343560 A G 0.073 0.949 0.035 0.883 SOCS1, 3’ downstream 2 rs2288697 47.776 23860168 A G 0.029 0.906 0.018 0.877 KLHL29, intron 16 rs35346036 28.164 10951098 G A 0.065 0.957 0.088 0.872 CIITA
16 rs2021760 28.358 11343992 G A 0.076 0.947 0.065 0.869 SOCS1, 3’ downstream 16 rs45601437 28.180 10989754 A G 0.006 0.912 0.050 0.862 CIITA, intron 16 rs2866065 91.637 75822042 A G 0.075 0.929 0.000 0.849 –
16 rs8054781 28.400 11384776 C T 0.026 0.932 0.092 0.846 PRM1, promoter 15 rs16964480 35.881 37284909 G T 0.000 0.837 0.000 0.837 MEIS2, intron
a
GENPOS is the genetic map position of the marker on a chromosome (CHR) in centiMorgans, POS is the hg19 physical map position, A1 is the reference allele, A2 the alternative.
bf(Afr), f(Amr), f(Eur) are the estimated reference allele frequencies for SNP A1 allele in the 3 Brazil ancestral admixture components.
cThis table shows the top ten ranked loci by Hudson Fst value, where Fst measures the genetic differentiation between the inferred second Amerindian admixture component
(Amr) and a single ancestral population of all components. Fst is the Amerindian component branch-specific estimate of genetic differentiation.
dNearest Gene is taken from the RefSeq track in the UCSC genome browser database (http://genome.ucsc.edu; last accessed October 16, 2016). Annotated SNPs are within
100 kb of the nearest gene. A promoter SNP is within 10 kb 50to the transcription start site; 30downstream SNP is within 10 kb 30of the nearest gene; exon and intron are within
SNP (r2>0.8;fig. 5). Other more distal SNPs with reduced Fst
at a lower linkage disequilibrium threshold (r2> 0.6) extend
approximately 500 kb 50and 30to the leading SNP, extending the physical gene loci covered toEMP2(50) and thePRM1/ RMI2gene cluster (30). SNP rs6498115 lies within prominent H3Kme1 and H3K27Ac marks defined by seven ENCODE cell lines (http://genome.ucsc.edu; last accessed October 16, 2016) and in four of the seven, these marks lie in regions predicted to have strong enhancement (53/125 cell lines also demonstrate DNase hypersensitivity). As shown insup plementary figure S3, Supplementary Material online, two SNPs in the NHGRI genome-wide association study catalog fall within this interval (Welter et al. 2014), rs4781011 within theCIITAgene, from a secondary analysis in a case–control association study of ulcerative colitis in Europeans (McGovern et al. 2010), and rs6498142 within the neighbor-ingCLEC16Agene, from a case–control association analysis of acute coronary syndrome in Mexican Americans ( Vargas-Alarcon et al. 2014). The other SNPs intable 4 within the
CIITAlinkage disequilibrium region were rs35346036 (within 100 kb of CIITA); rs45601437 (CIITA intron); rs77979769 (within 10 kb 30 of SOCS1); rs2021760 (within 10 kb 30 of SOCS1); rs8054781 (within 10 kb 30 of PRM1). The other four regions intable 4were: rs1834619 (SMC6gene intron), chromosome 2 at 17.9 Megabases (Mb), shown insupplemen tary figure S4, Supplementary Material online; rs288697 (KLHL29gene intron), chromosome 2 at 23.9 Mb,supplemen tary figure S5,Supplementary Materialonline; rs2866065 in an extended gene desert region on chromosome 16 at 75.8 Mb,
supplementary figure S6,Supplementary Materialonline; and rs16964480 (MEIS2gene intron), chromosome 15 at 37.3 Mb,
supplementary figure S7,Supplementary Materialonline.
The Most Highly Differentiated Loci for Amerindian
Ancestry in Brazil Compared with the Closest
Population in 1000 Genomes Asian Populations
We were interested in identifying SNPs that were most highly differentiated in the Amerindian ancestral component com-pared with the closest available Asian population,
conjecturing that the most highly differentiated SNPs might be candidates for disease or trait loci under ancestral selection during the migration from Asia into the Americas, and could differentiate disease risk in Amerindians from ancestral Asian populations. Comparison of these SNPs to the Amerindian differentiated SNPs identified above could suggest whether the differentiation was more likely to have occurred during the Asia to Americas ancestral migration. We estimated the population Fst values for the Amerindian admixture compo-nent in Brazil, BRN2 (Amr), versus all Asian 1KG populations that were recruited from within Asia as shown insupplemen tary table S5, Supplementary Material online. Surprisingly, Bengalis in Bangladesh (BEB) were significantly closer to the BRN2 (Amr) admixture component than any of the other 1KG populations as measured by Fst, with the Punjabis from Lahore (PJL) the next closest in the second cluster. We ran TREEMIX 1.12 to better understand the apparent relationship between BEB and the BRN2(Amr) component (Pickrell and Pritchard 2012). We included BRN2(Amr), all Asian 1KG pop-ulations and YRI as an outgroup and varied the number of migrations from 0 to 8. Since the 5-migration model was only slightly worse than a 6-migration model based on the change in log likelihood and a distinct flattening in the log likelihood change profile (supplementary fig. S8, Supplementary Material online), and the 5-migration model generated ac-ceptable residuals (supplementary fig. S9, Supplementary Materialonline), we accepted this is as the preferred model. The phylogenetic plot (supplementary fig. S10) illuminates the source of the similarity in BEB and shows that the Amerindian component is most genetically similar to an ad-mixed Central-East Asian ancestral group containing later admixture between a descendent group of the North-Indian subcontinent clade (PJL, GIH, and BEB) and an older South-East Asian/Japan lineage, albeit with evidence of later reverse gene flow between the Indian and East Asian clades. Similar to the LSBL test, the distribution of the Fst values was also exponential-like with mean, median, and 75% per-centile Fst values of 0.083, 0.045, and 0.123 respectively.
The top 10 most highly differentiated loci by Fst between the BRN2(Amr) component and the BEB population are
Table 5.The Top 10 Most Highly Differentiated Loci for the Amerindian Admixture Component in the Brazil Samples vs. the Closest Asian 1KG Population (BEB, Bengalis in Bangladesh)
CHR SNP GENPOS POS A1 A2 f(Eur) f(Amr) f(Afr) f(BEB)a Fstb Nearest Genec
3 rs7631391 88.546 64514393 G A 0.002 0.950 0.113 0.058 0.885 ADAMTS9, intron 5 rs77594147 178.800 169155975 G A 0.079 0.878 0.328 0.017 0.857 DOCK2, intron 5 rs73318286 178.809 169162708 G A 0.042 0.879 0.297 0.029 0.843 DOCK2, intron 15 rs28649017 89.197 85438991 A G 0.353 0.150 0.515 0.983 0.827 SLC28A1, exon/intron 14 rs7151991 30.033 32635572 A G 0.148 0.950 0.158 0.116 0.821 ARHGAP5, 3’ downstream 16 rs45601437 28.180 10989754 A G 0.006 0.912 0.050 0.081 0.816 CIITA, intron
16 rs6498115 28.170 10965511 T C 0.000 0.908 0.000 0.081 0.811 CIITA, promoter 20 rs6088519 57.089 33132191 T C 0.298 0.966 0.249 0.163 0.791 MAP1LC3, promoter 2 rs4666032 50.639 28254769 C T 0.000 0.827 0.000 0.029 0.788 BRE, intron 22 rs117487309 49.210 41195082 A G 0.039 0.786 0.000 0.000 0.786 SLC25A17, exon
aAll other columns are as intable 4, except f(BEB) contains the allele frequency of the A1 reference allele estimated inN¼86 Bengalis in Bangladesh 1KG samples. b
This table shows the top ten ranked loci by Hudson Fst value, where Fst measures the genetic differentiation between the Amr Amerindian admixture component and the BEB Bangladesh 1KG population.
cNearest Gene is taken from the RefSeq track in the UCSC genome browser database (http://genome.ucsc.edu; last accessed October 16, 2016). Annotated SNPs are within
100 kb of the nearest gene. A promoter SNP is within 10 kb 50to the transcription start site; 30downstream SNP is within 10 kb 30of the nearest gene; exon and intron are within
shown intable 5, were located in eight genome regions. The top SNP (rs7631391) is present in an intron of the gene ADAM metallopeptidase with thrombospondin type 1 motif, 9, (ADAMTS9)located on chromosome 3 at 64.5 Mb,supple mentary fig. S11,Supplementary Material online. This SNP was also within the top 500 SNPs from the previous Amerindian locus specific branch analysis (first green track in supplementary fig. S11, Supplementary Materialonline). The other SNPs were located in seven other regions: rs77594147 and rs73318286 within DOCK2 gene introns, chromosome 5 at 169.2 Mb (supplementary fig. S12,
Supplementary Material online); rs28649017 in SLC28A1, chromosome 15 at 85.4 Mb (supplementary fig. S13,
Supplementary Materialonline); rs71519991 5 kb 30 to the geneARHGAP5, chromosome 14 at 32.6 Mb (supplementary fig. S14, Supplementary Material online); rs45601437 and rs6498115 in theCIITAgene intron and promoter, chromo-some 16 at 11.0 Mb (supplementary fig. S3,Supplementary Materialonline); and rs6088519 (MAP1LC3Agene promoter, chromosome 20, 33.1 Mb), rs4666032 (BREgene intron, chro-mosome 2, 28.3 Mb), and rs117487308 (SLC25A17gene exon, chromosome 22, 41.2 Mb). The genome interval annotation plots forCIITA,ADAMTS9,DOCK2, andARHGAP5displaying the most differentiated SNPs for both the Fst tests of ancestral locus branch length and differentiation from the Asian BEB population contain highly differentiated SNPs in both tracks. To better understand the genetic history of the top differ-entiated SNPs and test for the possibility that the differenti-ation arose from founder effects within Asia, we computed the allele frequencies and locus-specific Fst values for ten of the 1KG populations: seven Asian populations resident within Asia countries; and Gujarati from Houston (GIH), LWK (Kenyans from Webuye), and TSI (Italians from
Tuscany) as proxies for the ancestral African and European populations (table 6). TSI was chosen as the geographically closest population to the Levantine migration routes out of Africa although IBS (Spaniards) gave very similar results. In the five SNPs, we found three distinct patterns in the Fst and allele frequencies across the populations. SNPs inADAMTS9
(rs7631391, chr3),ARHGAP5(rs71519991, chr14), andCIITA
(rs45601437, chr16) showed a trend from high Fst, low fre-quency in Africa with incremental Fst decreases and allele frequency increases in Asian populations, with the largest change occurring in the BRN2(Amr) component. The
DOCK2 region (rs77594147, chr5) showed a low Fst in Africa (0.541 allele frequency) but higher Fst and frequency
<0.10 in all other populations except Brazil Amerindian. The
third pattern inSLC28A1(rs28649017, chr15) was an increas-ing Fst and increasincreas-ing allele frequency from Africa to BEB and PJL and then a dramatic decrease in Fst and allele frequency in the rest of Asia and BRN2(Amr).
Discussion
Brazil poses a complex methodological problem for genetic analysis due to extensive recent admixture between individ-uals of European, African, and Native American Indian de-scent, combined with a complex history of migration and forced slavery. This complexity is an advantage for disease gene mapping because it allows the interrogation of wider genetic variation and resulting clinical and biological effects. Our purpose in this study was to develop accurate estimates of ancestry from genome-wide SNP data and use the jointly fitted SNP allele frequencies in a genome-wide scan for the most highly differentiated loci in the Amerindian ancestry component. Although not proven, these loci are strong
Table 6.Locus-Specific Fst and Allele Frequencies within the 1000 Genomes Populations for the Five Most Differentiated SNPs in Distinct Genome Regions in the Brazil Amerindian Component vs. Closest Asian Population (BEB)
Populationa LWK TSI BEB PJL CHB JPT CHS GIH KHV CDX BRN
Nb 97 107 86 96 103 104 105 101 99 93 1538
SNP CHR:POS A1 A2 Fst LWKc
Fst TSIc
Fst BEBc
Fst PJLc
Fst CHBc
Fst JPTc
Fst CHSc
Fst GIHc
Fst KHVc
Fst CDXc
rs7631391 3:64514393 G A 0.858 0.950 0.885 0.909 0.634 0.685 0.682 0.889 0.671 0.694 rs77594147 5:169155975 G A 0.240 0.826 0.857 0.801 0.782 0.777 0.795 0.817 0.822 0.785 rs28649017 15:85438991 A G 0.102 0.242 0.827 0.843 0.003 0.024 0.052 0.001 0.008 0.003 rs7151991 14:32635572 A G 0.813 0.754 0.821 0.749 0.794 0.791 0.766 0.677 0.749 0.707 rs45601437 16:10989754 A G 0.827 0.901 0.816 0.820 0.511 0.586 0.567 0.865 0.628 0.629 SNP CHR:POS A1 A2 f(A1)
LWKd f(A1)
TSId f(A1)
BEBd f(A1)
PJLd
f(A1) CHBd
f(A1) JPTd
f(A1) CHSd
f(A1) GIHd
f(A1) KHVd
f(A1) CDXd
f(A1) BRN2Amrd rs7631391 3:64514393 G A 0.082 0.000 0.058 0.036 0.286 0.240 0.243 0.054 0.253 0.231 0.950 rs77594147 5:169155975 G A 0.541 0.042 0.017 0.063 0.078 0.082 0.067 0.050 0.045 0.075 0.878 rs28649017 15:85438991 A G 0.356 0.500 0.983 0.995 0.141 0.245 0.291 0.173 0.101 0.145 0.150 rs7151991 14:32635572 A G 0.124 0.178 0.116 0.182 0.141 0.144 0.167 0.248 0.182 0.220 0.950 rs45601437 16:10989754 A G 0.072 0.009 0.081 0.078 0.345 0.279 0.295 0.040 0.242 0.242 0.912
aThe populations are ordered by Africa(LWK), Europe(TSI), Asia(BEB, PJL, CHB, JPT, CHS, GIH, KHV, and CDX) where Asian populations are in decreasing order of similarity to
BRN2(Amr) (supplementary table S5,Supplementary Materialonline). Population codes are LWK (Luhya in Webuye, Kenya); TSI (Toscani in Italy); BEB (Bengalis in Bangladesh); PJL (Punjabis in Lahore, Pakistan); CHB (Han Chinese in Beijing); JPT (Japanese in Tokyo, Japan); CHS (Southern Han Chinese); GIH (Gujarati in Houston, USA); KHV (Kinh in Ho Chi Minh City, Vietnam); CDX (Chinese Dai in Xishuangbanna); BRN2(Amr) (North-Eastern Brazilians, Amerindian admixture component 2).
bNumber of DNA samples within each population.
cSNP-specific Fst value for each population compared with the Brazil Amerindian admixture component, BRN2 (Amr). In the top half of the table, the BEB Fst values are shown in bold
since thisisthe closestAsianpopulationand arethe valuesintable 5. Inthe lowerhalfofthe table,the BEB andBRN2(Amr)columnsare inboldsincethedifferenceinthesefrequencies is used in the FstBEB calculation. Other Fst 1KG values in the top half of the table are calculated from the 1KG population and BRN2(Amr) frequencies in the lower half.
candidates for having been under selection pressure. We chose to focus on Amerindian locus differentiation within our Brazil population since less work has been possible on Native Amerindian population genetics due to community sensitivities and fewer publicly available large Amerindian genome-wide data sets.
By ranking SNPs in the upper tail of the genome-wide distribution of Fst values from a locus-specific branch length (LSBL) test of reconstructed Amerindian ancestry in Brazilians, we found five genome regions containing the top 10 SNPs which were the most differentiated SNPs, and there-fore candidates for selection (table 4and fig. 5). The LSBL analysis against the single ancestral root population is a model for testing SNP locus differentiation but is not intended to be a literal model of the archaic history of the continental pop-ulations and does not model complex ancestral history, re-placement, or migrations between Africa, Europe, and Americas. The top differentiated SNP (rs6498115) was located within the proximal promoter of theCIITAgene, 6 kb (kb) upstream of the start site ofCIITAtranscription, within prom-inent H3Kme1 and H3K27Ac epigenetic marks in a region of transcriptional enhancement, and is a strong positional and functional candidate as transcriptional regulator ofCIITA ex-pression. The LD region for this SNP extended fromEMP2(50) to thePRM1/RMI2gene cluster (30). The second SNP was in an intron of the structural maintenance of chromosomes 6 geneSMC6(rs1834619), a gene that is obligate for normal development and chromosome structure but without prior clinical research results or GWAS signals to suggest possible beneficial changes in associated human phenotypes. Other SNPs were located in an intron of kelch-like family member 29 (KLHL29) rs2288697, a gene desert region of chromosome 16 (rs2866065, 75.8 Mb) approx. 5 kb from a localized isolated genome region conserved in mammals and with a cluster of transcription factor sites identified by CHIP-Seq experiments, (http://genome.ucsc.edu; last accessed October 16, 2016), and in an intron of Meis homeobox 2 (MEIS2)rs16964480.
In a second similar analysis of pairwise Fst values computed between the Brazilian Amerindian admixture component and the closest Asian population, Bengalis in Bangladesh (BEB), we found evidence of extreme differentiation of the top 10 SNPs in eight regions in the reconstructed Amerindian branch compared with a single ancestral root population (table 5). By comparing these two analyses we hoped to gain insight into where and when in the complex history of the Amerindian population, the locus-specific differentiation may have occurred, pre- or during Asia-to-Americas migra-tion. The only region that contained SNPs ranking in the top 10 SNPs of both analyses was theCIITAregion, and astable 6
showed, the greatest component of the differentiation is most likely to have occurred in the geographical migration between Asia and ending in the North-Eastern region of Brazil, although may already have begun in Asia. The LSBL test regionSMC6(rs75594147, chromosome 2) also contained SNPs within the top 500 of the Amerindian vs. Asia analysis (second green track,supplementary fig. S4,Supplementary Materialonline), which provides suggestive evidence for dif-ferentiation during the peopling of the Americas. We also
found four other interesting regions in the Amerindian vs. Asian analysis, but which did not appear in the top 10 LSBL SNPs, although theADAMTS9(rs7631391, chromosome 3),
DOCK2 (rs77594147, chromosome 5), and ARHGAP5
(rs7151991, chromosome 14) regions also contained SNPs that were ranked in the top 500 of the LSBL test (top green track,supplementary figs. S11–S13,Supplementary Material
online, respectively). From comparison of the pairwise Fst and allele frequencies across the 10 populations with the Brazil Amerindian intable 6,ADAMTS9andARHGAP5showed a smooth trend of decreasing Fst and increasing allele fre-quency from Africa to Asia with the largest change in Fst in the transition to Amerindian also suggesting these are good candidates for New World selection. Of the other top gene regions,DOCK2, showed a much higher allele frequency in Africa than in the European or Asian populations, and higher still in Brazil Amerindian. One possible explanation is that gene variant was originally at low frequency in the founding African migration, but experienced selection pressure sepa-rately and independently in Africa and the Americas. This pattern explains why the LSBL test for the SNP did not yield an extreme Fst statistic yet was highly differentiated in the Asian comparison. The final gene region, SLC28A1
(rs28649017, chromosome 15) contains a SNP that rose in Fst and allele frequency from Africa to Europe to Bangladesh and Pakistan but which subsequently drifted or experienced downward allele frequency selection pressure within Asia re-sulting in a similar frequency in Brazil Amerindian (table 6), but had occurred pre-migration. The reason for this is unknown.
The genes we have implicated have known functions that span biological processes that could potentially influence re-productive or survival fitness in different and fascinating ways.
CIITAregulates MHC class II gene transcription and has been called “the master control factor” for expression of these genes. CIITA has been implicated in immune function through association with autoimmune diseases or very re-cently with leprosy (Liu et al. 2015). The gene complex in-cluding CIITA and neighboring DEXI/CLEC16A has been shown to be associated with multiple autoimmune diseases (Bronson et al. 2011;Gyllenberg et al. 2012,2014;Leikfoss et al. 2015).DOCK2is predominantly expressed in hematopoietic cells, regulates migration and activation of neutrophils through Rac activation (Nishikimi et al. 2013) and is associ-ated with early-onset invasive infections (Dobbs et al. 2015).
ADAMTS9has been shown to be associated with body fat distribution (Liu et al. 2013) and other anthropometry/met-abolic traits including type 2 diabetes (Zeggini et al. 2008;Heid et al. 2010;Randall et al. 2013), as well as age-related macular degeneration (Fritsche et al. 2013) and other traits.ARHGAP5
Our unsupervised analysis of genetic ancestry within our North-Eastern Brazil samples showed that an admixture model of three continental populations, Africa, Europe, and Amerindian, was sufficient to explain the most important ancestral structure, although if we had included other diverse Latin American samples in our admixture and PCA, we un-doubtedly would have found finer structure of admixture (Johnson et al. 2011;Moreno-Estrada et al. 2013, 2014) but this was not the goal of the study, and would have been problematic for accurate supervised ancestry estimation at fine resolution. The unsupervised admixture analysis also showed that the African component was closest to African Americans in the US South-West (ASW) and African Caribbeans in Barbados (ACB) but this was most likely due to imperfect partitioning of genetic variance between admix-ing continental components and European admixture re-tained within the inferred African component in the absence of supervising proxy samples in the ADMIXTURE analysis, rather than significant recent differentiation (Bhatia et al. 2014). Among populations in Africa, the unsupervised African component was actually most similar to the Luhya in Kenya, but this was also probably biased by similarity to older East African variation through residual European or Amerindian variation. The Africa-centric PCA clearly showed that the recent North-Eastern Brazil admixture arose from a population genetically closer to the West African Yoruba/ Esan populations near the Bight of Benin, modern day Nigeria. This is consistent with the history of slave importation into Brazil. Three broad periods of slave importation are recog-nized, roughly corresponding to the 16th century (Senegambia/Upper Guinea); 17th century (a switch to im-portation from Central/West Africa, modern day Congo and Angola); and the 18th century (Mina Coast/Lower Guinea) (Sweet 2003). Before 1700 only 13% of total African slaves came from the Bight of Benin, while in the period 1700–1850 approximately 55% of the slaves that landed in Bahia prov-ince—the major landing point in North-Eastern Brazil—came from the Bight (Klein and Luna 2010). The European admix-ture component is most likely derived from Southern Europe with latter day Spanish being the closest match of the avail-able 1000 Genomes populations, which probably reflects ear-lier Portuguese influence, although Spaniards and Dutch were also present as explorers and colonial powers.
Inclusion of proxy samples for the components ancestries in a supervised ADMIXTURE analysis resulted in significantly different estimates of individual admixture. Similar results were found in one of the very few and limited genetic studies of North-Eastern Brazilians (768 SNPs), with the use of differ-ing pseudo-ancestral populations (Magalhaes da Silva et al. 2015). We found that as few as 30 proxy samples for each ancestry was sufficient, and of the 1000 Genomes popula-tions, the closest proxies for the predominantly European, Amerindian, and African admixed components were respec-tively Spanish (IBS); Esan/Yorubans (ESN/YRI); Peruvians (PEL) and a few Mexicans (MXL). The North-Eastern Brazilians had a mean ancestry of 57% European, 20% Amerindian, and 23% African although with considerable ranges of individual ancestries within each component
(19–95%, 2–49%, and 4–67%, respectively). The mean ances-tries of the five study groups located in coastal Fortaleza, the capital of Ceara state, did not differ, but the mean ancestry in the Recodisa case control study group, which was enrolled in six other noncoastal cities across four North-Eastern states including Ceara, had slightly higher and more variable per-centages of European and African ancestries, but about 10% lower and less variable Amerindian ancestry.
The advantages of including proxies to identify compo-nents of admixture have described previously but using dif-ferent methods to assess likely accuracy of ancestral reconstruction (Falush et al. 2003; Tang et al. 2005;
Alexander et al. 2009;Alexander and Lange 2011). Although we believe these differences are an improvement in the esti-mates of admixture proportions, a possible alternative expla-nation is that supervised ancestry estimates are biased due to European admixture in the Amerindian proxies, and to lesser degree, in the African samples. This illustrates the challenges in accurate admixture analysis and identifying suitable nonad-mixed reference or proxy samples for supervised ancestral deconvolution.
Previous studies of urban and regional Brazilian popula-tions have shown that the predominant admixture compo-nents are European, African, and Amerindian with systematic variation in the proportions between the five major regions in Brazil, although the accuracy may have been limited by small SNP panels and unsupervised or joint admixture estimation (Ruiz-Linares et al. 2014). More recent genome-wide panels with thousands of samples have found similar structure (Giolo et al. 2012;Kehdy et al. 2015;Lima-Costa et al. 2015) but this is the first study using Brazil samples that has at-tempted to carefully select best matching proxies and derive supervised genome-wide estimates of admixture compo-nents based on ancestral similarity. No other studies have attempted to interrogate the latent ancestry in Brazil for pu-tative selection.
2014), which now seems to have occurred as a single migra-tion wave, approximately 23 kya (Raghavan et al. 2015).
In conclusion, we have identified multiple differentiated regions in the Amerindian ancestral component of the North-Eastern Brazil population, drawn from six separate studies containing SNPs located in genes involved in immune function, metabolism, embryonic development, and other diseases and traits. We recognize that our results could be biased by the genetic panel used as the source of the SNP genotyping data, although the panel is informative for Latin American populations; that we have only investigated the ancestry derived from a single country, albeit one with a high degree of admixture; and that we have not proven that the most differentiated SNPs or genes are functionally under selection. Further work is needed to replicate these findings in other studies and to understand the health impli-cations of the results.
Materials and Methods
Study Populations
The genetic samples analyzed in this work were drawn from six cohorts/studies conducted on populations in North-Eastern Brazil and centered on Fortaleza, Ceara state. They have been previously described in detail and will only be reviewed briefly here. The Gonc¸alves Dias cohort was re-cruited in the Gonc¸alves Dias favela in Fortaleza between 1989 and 1993 to study the epidemiology, nutritional impact and causes of persistent diarrhea in early childhood (Lima et al. 2000). The Malnutrition and Enteric Disease Network (Mal-ED) Birth Cohort enrolled 242 children within 17 days of birth between 2010 and 2014; an additional 101 infants re-cruited under the ICIDR (International Center for Infectious Disease Research) program and evaluated by the same pro-cedures as Mal-ED are included in the cohort. The prospective Mal-ED case-control (MCC) study enrolled 401 children 6–18 months of age between 2010 and 2014. Both Mal-ED study groups were enrolled in Fortaleza (Lima et al. 2014). The Recodisa prospective case-control study enrolled 1200 chil-dren aged 2–36 months between 2010 and 2014 from hos-pitals or clinic facilities in six semiarid countryside cities of North-Eastern Brazil to study the etiology of diarrhea. The cities were Crato (Ceara state), Cajazeiras, Souza, and Patos (Paraıba state), Ouricuri (Pernambuco state), and Picos (Piauı state) and had>50,000 inhabitants in states with>50% area
localized inside the Brazilian Semiarid region. Target enroll-ment was 100 cases and controls from each city.
The Parque Universitario Zinc-Vitamin A clinical trial co-hort enrolled 324 children between 2000 and 2006, and the Parque Universitario Zinc-Arginine clinical trial cohort en-rolled 349 infants between 2006 and 2010, both from the Parque Universitario favela in Fortaleza (Lima et al. 2013). All families gave informed consent for genetic research into diseases and traits linked to malnutrition. The study protocols were approved by the Federal University of Ceara Committee for Ethics in Research and the University of Virginia Institutional Review Board for Health Sciences Research. Although this study contained incidental analysis of ancestry
and anthropology, this was performed in so far as it was required to construct correctly-adjusted statistical tests to identify regions of the genome and SNPs that might be linked to disease susceptibility and to enable future tests of associ-ation. All participants were de-identified to the analysis and no interpretation of the ancestry of specific identified partic-ipants was performed.
Genome-Wide Genotyping and Quality Control
Saliva samples from all children were collected using Oragene DNA kit G-250 (DNA Genotek, Ontario, Canada). Briefly, the sample collector was mixed gently and incubated at 50C for 1 h in a water bath. Unabsorbed liquid was transferred to a conical 15 mL centrifuge tube and the barrel of a 5 mL dis-posable syringe, containing collected sponges, was also placed inside the tube and centrifuged at 200gfor 10 min at 20C. After centrifugation, the syringes were removed and the DNA was manually extracted from 4.0 mL of Oragene DNA/saliva according to published vendor protocols. All samples were genotyped on the Affymetrix Axiom Latin America Array (LAT-1) with 818,154 SNPs and Indels specifically informative for Hispanic and Latin American populations. A total of 2,119 Brazil sample CEL files were processed using Affymetrix power tools (APT 1.16.0), applying the vendor’s best practices quality control (QC) criteria for samples and SNPs. More details are available insupplementary table S1,Supplementary Material
online. After Affymetrix quality control 1,659 samples and 755,801 SNPs were available for genetic ancestry analysis. Additional sample quality control for cryptic relatedness up to degree 2 was performed using KING (Manichaikul et al. 2010), and after removing related and sex-misclassified sam-ples, 1,538 samples remained. Further SNP QC, dropping SNPs with a call rate<99% and/or minor allele frequency
(MAF)<5%, resulted in a total autosomal chromosome
SNP count of 410,172 SNPs. Finally these SNPs were thinned to reduce residual linkage disequilibrium (LD), so that the maximum inter-SNP r2 was 0.3, resulting in 199,654 SNPs. Plink 1.07 was used for genetic data management and to calculate LD (Purcell et al. 2007).
1000 Genomes Project Data and Quality Control
The 1000 Genomes Project (1KG) phase3 release data (ver-sion date 2013/05/02) was downloaded (ftp://ftp-trace.ncbi. nih.gov/1000genomes/ftp/release/20130502; last accessed January 30, 2015) and contained 2,504 samples from 26 pop-ulations. KING was used to identify residual relatedness up to degree 2, inferring eight parent-offspring, four full sibs and three 2nd degree relative pairs with one family of size 3. After dropping one of the related pairs and filtering SNPs>1%
Principal Component and Admixture Analysis
Admixture analysis was performed using ADMIXTURE v1.23 in supervised and unsupervised modes as described in the main text, and was run with 10 cross-validation folds (–cv¼10) (Alexander et al. 2009; Alexander and Lange 2011). Principal component analysis was performed using the EIGENSOFT package v5.0.1 (Patterson et al. 2006; Price et al. 2006). Unsupervised analysis used the Brazil post-QC LD-thinned SNP set of 199,654. For supervised analyses, the number of proxy reference samples was constrained to be equal for each component ancestry to reduce the bias in estimation of ancestry composition through different likeli-hood weighting, or the distortion of principal component axes (McVean 2009).
Statistical Genetic Analysis
Tests of equality of mean ancestry between the six study groups were performed using Hotelling’s test applied to each pair of study groups testing bivariate equality of means of two independent ancestry proportions (%AMR, %AMR) of the three constrained total. The significance level was ad-justed for 15 tests, (alpha¼0.05/15). Genetic differentiation between ancestral admixture components and populations was measured using Hudson’s Fst (Nei 1973;Hudson et al. 1992). This was computed using custom R functions accord-ing to the algorithm and estimator described inBhatia et al. (2013). 95% Confidence intervals for Fst estimates were gen-erated using 10,000 bootstrap resamples and the bootstrap percentile method (Efron and Tibshirani 1993). The genetic differentiation of SNP loci for the Amerindian-specific ances-tral component of the Brazil samples was assessed under two scenarios. The branch-specific Fst (Shriver et al. 2004) was computed for each SNP for the Brazil Amerindian admixture component (BRN2) relative to a hypothetical single ancestral population for all three admixture components (ancestral) where:
Fstð2 vs: ancestralÞ
¼Fstð1 vs: 2Þ þFstð2 vs: 3Þ Fstð1 vs: 3Þ 2
(1)
This statistic is monotonically related to the population branch statistic which has an identical form but with scaled population divergence time estimated asT ¼ logð1FstÞ (Cavalli-Sforza 1969) substituted for each pairwise Fst. The second scenario identified the most highly genetically differ-entiated loci comparing the closest proxy Asian 1KG popu-lation, Bengalis in Bangladesh (BEB) to the Brazil Amerindian BRN2(Amr) component, using direct pairwise Fst, BRN2(Amr) vs. BEB). R version 3.0.3 was used for all other statistical analyses (R Core Team 2014).
Genome Regional Fst Plots
Genome regional plots of extreme Fst differentiation were created using LocusZoom (Pruim et al. 2010). Linkage disequi-librium (r2) between SNPs was estimated in LocusZoom using 1KG admixed American (AMR) samples (MXL, PUR, CLM, and PEL).
TREEMIX Analysis
The relationship between the Amerindian component BRN(Amr) and 1KG Asian populations was analyzed using TREEMIX 1.12 (Pickrell and Pritchard 2012). We included the Yorubans (YRI) as an outgroup and varied the number of migrations from 0 to 8. The BRN2(Amr) genotype counts were estimated as 2mean proportion of BRN2(Amr) ad-mixture (0.2) ADMIXTURE estimated allele frequency, rounded to the nearest integer. We compared the plots of residuals and tested the change in final composite log max-imum likelihood using 10,000 bootstrap replicates of the SNPs with the same seed to estimate the bias-corrected 95% con-fidence interval on the log likelihood (-bootstrap -seed op-tions in TREEMIX). We compared the 1-sided 95% confidence interval test of the model log likelihood with k migration events vs.k 1 events to identify the most parsimonious migration model at which further increase in the migration parameter led to insignificant improvement in the maximum likelihood.
Supplementary Material
Supplementary tables S1–S5andfigures S1–S28are available atMolecular Biology and Evolutiononline.
Acknowledgments
This work was supported by grant no. U01AI026512 from the National Institute of Allergy and Infectious Diseases at the National Institutes of Health for the International Collaboration in Infectious Diseases Research (ICIDR) pro-gram; the Etiology, Risk Factors and Interactions of Enteric Infections and Malnutrition and the Consequences for Child Health and Development Project (MAL-ED) is carried out as a collaborative project supported by the Bill & Melinda Gates Foundation, the Foundation for the National Institutes of Health, and the National Institutes of Health, Fogarty International Center. The funders had no role in study design, data collection and analysis, decision to publish, or prepara-tion of the manuscript. We acknowledge the assistance of two anonymous reviewers whose comments greatly im-proved the manuscript.
References
1000 Genomes Project Consortium, Abecasis GR, Auton A, Brooks LD, DePristo MA, Durbin RM, Handsaker RE, Kang HM, Marth GT, McVean GA. 2012. An integrated map of genetic variation from 1,092 human genomes.Nature491:56–65.
Achilli A, Perego UA, Lancioni H, Olivieri A, Gandini F, Hooshiar Kashani B, Battaglia V, Grugni V, Angerhofer N, Rogers MP, et al. 2013. Reconciling migration models to the Americas with the variation of North American native mitogenomes.Proc Natl Acad Sci U S A.
110:14308–14313.
Alexander DH, Lange K. 2011. Enhancements to the ADMIXTURE algorithm for individual ancestry estimation.BMC Bioinformatics
12:246.
Alexander DH, Novembre J, Lange K. 2009. Fast model-based estimation of ancestry in unrelated individuals.Genome Res.19:1655–1664. Bergad LW. 2007. The comparative histories of slavery in Brazil, Cuba,
and the United States. New York: Cambridge University Press. Bhatia G, Patterson N, Pasaniuc B, Zaitlen N, Genovese G, Pollack S,
comparison of African-ancestry populations from CARe and other cohorts reveals signals of natural selection. Am J Hum Genet.
89:368–381.
Bhatia G, Patterson N, Sankararaman S, Price AL. 2013. Estimating and interpreting FST: the impact of rare variants. Genome Res.
23:1514–1521.
Bhatia G, Tandon A, Patterson N, Aldrich MC, Ambrosone CB, Amos C, Bandera EV, Berndt SI, Bernstein L, Blot WJ, et al. 2014. Genome-wide scan of 29,141 African Americans finds no evidence of directional selection since admixture.Am J Hum Genet.95:437–444.
Bigham A, Bauchet M, Pinto D, Mao X, Akey JM, Mei R, Scherer SW, Julian CG, Wilson MJ, Lopez Herraez D, et al. 2010. Identifying sig-natures of natural selection in Tibetan and Andean populations using dense genome scan data.PLoS Genet.6:e1001116.
Bronson PG, Goldstein BA, Ramsay PP, Beckman KB, Noble JA, Lane JA, Seldin MF, Kelly JA, Harley JB, Moser KL, et al. 2011. The rs4774 CIITA missense variant is associated with risk of systemic lupus erythema-tosus.Genes Immun.12:667–671.
Bryc K, Auton A, Nelson MR, Oksenberg JR, Hauser SL, Williams S, Froment A, Bodo JM, Wambebe C, Tishkoff SA, et al. 2010. Genome-wide patterns of population structure and admixture in West Africans and African Americans.Proc Natl Acad Sci U S A.
107:786–791.
Cardena MM, Ribeiro-Dos-Santos A, Santos S, Mansur AJ, Pereira AC, Fridman C. 2013. Assessment of the relationship between self-declared ethnicity, mitochondrial haplogroups and genomic ances-try in Brazilian individuals.PLoS One8:e62005.
Cavalli-Sforza LL. 1969. Human Diversity. 12th International Congress of Genetics, Tokyo, Japan. p. 405–407.
de Carvalho Vidigal F, Bressan J, Babio N, Salas-Salvado J. 2013. Prevalence of metabolic syndrome in Brazilian adults: a systematic review.BMC Public Health13:1198.
Dobbs K, Dominguez Conde C, Zhang SY, Parolini S, Audry M, Chou J, Haapaniemi E, Keles S, Bilic I, Okada S, et al. 2015. Inherited DOCK2 deficiency in patients with early-onset invasive infections.N Engl J Med.372:2409–2422.
Duggan AT, Stoneking M. 2014. Recent developments in the genetic history of East Asia and Oceania.Curr Opin Genet Dev.29:9–14. Durso DF, Bydlowski SP, Hutz MH, Suarez-Kurtz G, Magalhaes TR, Pena
SD. 2014. Association of genetic variants with self-assessed color categories in Brazilians.PLoS One9:e83926.
Efron B, Tibshirani RJ. 1993. An Introduction to the Bootstrap. Boca Raton (FL): Chapman & Hall/CRC.
Elwi AN, Damaraju VL, Baldwin SA, Young JD, Sawyer MB, Cass CE. 2006. Renal nucleoside transporters: physiological and clinical implications.
Biochem Cell Biol.84:844–858.
Falush D, Stephens M, Pritchard JK. 2003. Inference of population struc-ture using multilocus genotype data: linked loci and correlated allele frequencies.Genetics164:1567–1587.
Fritsche LG, Chen W, Schu M, Yaspan BL, Yu Y, Thorleifsson G, Zack DJ, Arakawa S, Cipriani V, Ripke S, et al. 2013. Seven new loci associated with age-related macular degeneration. Nat Genet. 45:433–439, 439e1–2.
Giolo SR, Soler JM, Greenway SC, Almeida MA, de Andrade M, Seidman JG, Seidman CE, Krieger JE, Pereira AC. 2012. Brazilian urban popu-lation genetic structure reveals a high degree of admixture.Eur J Hum Genet.20:111–116.
Guindalini C, Colugnati FA, Pellegrino R, Santos-Silva R, Bittencourt LR, Tufik S. 2010a. Influence of genetic ancestry on the risk of obstructive sleep apnoea syndrome.Eur Respir J.36:834–841.
Guindalini C, Lee KS, Andersen ML, Santos-Silva R, Bittencourt LR, Tufik S. 2010b. The influence of obstructive sleep apnea on the expression of glycerol-3-phosphate dehydrogenase 1 gene. Exp Biol Med (Maywood).235:52–56.
Gurdasani D, Carstensen T, Tekola-Ayele F, Pagani L, Tachmazidou I, Hatzikotoulas K, Karthikeyan S, Iles L, Pollard MO, Choudhury A, et al. 2015. The African Genome Variation Project shapes medical genetics in Africa.Nature517:327–332.
Gyllenberg A, Asad S, Piehl F, Swanberg M, Padyukov L, Van Yserloo B, Rutledge EA, McNeney B, Graham J, Orho-Melander M, et al. 2012. Age-dependent variation of genotypes in MHC II transactivator gene (CIITA) in controls and association to type 1 diabetes.Genes Immun.
13:632–640.
Gyllenberg A, Piehl F, Alfredsson L, Hillert J, Bomfim IL, Padyukov L, Orho-Melander M, Lindholm E, Landin-Olsson M, Lernmark A, et al. 2014. Variability in the CIITA gene interacts with HLA in mul-tiple sclerosis.Genes Immun.15:162–167.
Heckman BM, Chakravarty G, Vargo-Gogola T, Gonzales-Rimbau M, Hadsell DL, Lee AV, Settleman J, Rosen JM. 2007. Crosstalk between the p190-B RhoGAP and IGF signaling pathways is required for embryonic mammary bud development.Dev Biol.309:137–149. Heid IM, Jackson AU, Randall JC, Winkler TW, Qi L, Steinthorsdottir V,
Thorleifsson G, Zillikens MC, Speliotes EK, Magi R, et al. 2010. Meta-analysis identifies 13 new loci associated with waist-hip ratio and reveals sexual dimorphism in the genetic basis of fat distribution.Nat Genet.42:949–960.
Hollard C, Keyser C, Giscard PH, Tsagaan T, Bayarkhuu N, Bemmann J, Crubezy E, Ludes B. 2014. Strong genetic admixture in the Altai at the Middle Bronze Age revealed by uniparental and ancestry infor-mative markers.Forensic Sci Int Genet.12:199–207.
Hudson RR, Slatkin M, Maddison WP. 1992. Estimation of levels of gene flow from DNA sequence data.Genetics132:583–589.
Johnson NA, Coram MA, Shriver MD, Romieu I, Barsh GS, London SJ, Tang H. 2011. Ancestral components of admixed genomes in a Mexican cohort.PLoS Genet.7:e1002410.
Kehdy FS, Gouveia MH, Machado M, Magalhaes WC, Horimoto AR, Horta BL, Moreira RG, Leal TP, Scliar MO, Soares-Souza GB, et al. 2015. Origin and dynamics of admixture in Brazilians and its effect on the pattern of deleterious mutations.Proc Natl Acad Sci U S A.
112:8696–8701.
Klein HS, Luna FV. 2010. Slavery in Brazil. New York, NY: Cambridge University Press.
Kuhn PC, Horimoto AR, Sanches JM, Vieira Filho JP, Franco L, Fabbro AD, Franco LJ, Pereira AC, Moises RS. 2012. Genome-wide analysis in Brazilian Xavante Indians reveals low degree of admixture.PLoS One7:e42702. Leikfoss IS, Keshari PK, Gustavsen MW, Bjolgerud A, Brorson IS, Celius
EG, Spurkland A, Bos SD, Harbo HF, Berge T. 2015. Multiple sclerosis risk allele in CLEC16A acts as an expression quantitative trait locus for CLEC16A and SOCS1 in CD4þT cells.PLoS One10:e0132957. Lima AA, Kvalsund MP, Souza PP, Figueiredo IL, Soares AM, Mota RM,
Lima NL, Pinkerton RC, Patrick PP, Guerrant RL, et al. 2013. Zinc, vitamin A, and glutamine supplementation in Brazilian shantytown children at risk for diarrhea results in sex-specific improvements in verbal learning.Clinics (Sao Paulo)68:351–358.
Lima AA, Moore SR, Barboza MS, Jr., Soares AM, Schleupner MA, Newman RD, Sears CL, Nataro JP, Fedorko DP, Wuhib T, et al. 2000. Persistent diarrhea signals a critical period of increased diarrhea burdens and nutritional shortfalls: a prospective cohort study among children in northeastern Brazil.J Infect Dis.181:1643–1651. Lima AA, Oria RB, Soares AM, Filho JQ, de Sousa F, Jr., Abreu CB, Binda A,
Lima I, Quetz J, Moraes M, et al. 2014. Geography, population, de-mography, socioeconomic, anthropometry, and environmental sta-tus in the MAL-ED cohort and case-control study Sites in Fortaleza, Ceara, Brazil.Clin Infect Dis.59 Suppl 4:S287–S294.
Lima-Costa MF, Rodrigues LC, Barreto ML, Gouveia M, Horta BL, Mambrini J, Kehdy FS, Pereira A, Rodrigues-Soares F, Victora CG, et al. 2015. Genomic ancestry and ethnoracial self-classification based on 5,871 community-dwelling Brazilians (The Epigen Initiative).Sci Rep.5:9812.
Liu CT, Monda KL, Taylor KC, Lange L, Demerath EW, Palmas W, Wojczynski MK, Ellis JC, Vitolins MZ, Liu S, et al. 2013. Genome-wide association of body fat distribution in African ancestry popu-lations suggests new loci.PLoS Genet.9:e1003681.