www.nat-hazards-earth-syst-sci.net/12/1255/2012/ doi:10.5194/nhess-12-1255-2012
© Author(s) 2012. CC Attribution 3.0 License.
and Earth
System Sciences
Analysis of flash flood regimes in the North-Western and
South-Eastern Mediterranean regions
P. Tarolli1, M. Borga1, E. Morin2, and G. Delrieu3
1Department of Land, Environment, Agriculture and Forestry, University of Padova, Legnaro, Italy 2Department of Geography, The Hebrew University of Jerusalem, Mount Scopus, Jerusalem, Israel 3Laboratoire d’etude des Transferts en Hydrologie et Environnement, Grenoble, France
Correspondence to:P. Tarolli ([email protected])
Received: 10 January 2012 – Revised: 8 March 2012 – Accepted: 16 March 2012 – Published: 3 May 2012
Abstract. This work analyses the prominent characteristics of flash flood regimes in two Mediterranean areas: the North-Western Mediterranean region, which includes Catalonia, France and Northern Italy, and the South-Eastern Mediter-ranean region, which includes Israel. The two regions are characterized by similarities in the hydro-meteorological monitoring infrastructure, which permits us to ensure ho-mogeneity in the data collection procedures. The analysis is articulated into two parts. The first part is based on use of flood peak data, catchment area and occurrence date for 99 events (69 from the North-Western region and 30 from the South-Eastern region). Analysis is carried out in terms of relationship of flood peaks with catchment area and sea-sonality. Results show that the envelope curve for the South-Eastern region exhibits a more pronounced decreasing with catchment size with respect to the curve of the North-Western region. The differences between the two relationships reflect changes in the effects of storm coverage and hydrological characteristics between the two regions. Seasonality analy-sis shows that the events in the North-Western region tend to occur between August and November, whereas those in the South-Eastern area tend to occur in the period between October and May, reflecting the relevant patterns in the syn-optic conditions leading to the intense precipitation events. In the second part, the focus is on the rainfall-runoff rela-tionships for 13 selected major flash flood events (8 from the North-Western area and 5 from the South-Eastern area) for which rainfall and runoff properties are available. These flash floods are characterised in terms of climatic features of the impacted catchments, duration and amount of the gener-ating rainfall, and runoff ratio. Results show that the rainfall duration is shorter and the rainfall depth lower in the South-Eastern region. The runoff ratios are rather low in both re-gions, whereas they are more variable in the South-Eastern area. No clear relationship between runoff ratio and rainfall
depth is observed in the sample of floods, showing the major influence of rainfall intensity and the initial wetness condi-tion in the runoff generacondi-tion for these events.
1 Introduction
The large diversity in climate, synoptic conditions and hy-drological properties across the Mediterranean regions leads to large variability in the flash flood regimes. This hetero-geneity combines with differences in social, economical and institutional characteristics at local, regional and national level to generate a complex pattern of impacts, responses, and mitigation policies for flash flood risk across the Mediter-ranean region. A better characterization of flash flood events and their regimes in diverse areas of the Mediterranean re-gion is sought in this work as an important aspect of cli-mate and hydro-meteorological science. Two Mediterranean areas are considered in this work: the North-Western area (including Catalonia, Southern France and Northern Italy, termed Western region hereinafter) and South-Eastern (Is-rael), termed Eastern region hereinafter. The two regions shows contrasting aspects in climate, synoptic conditions and hydrological properties, while exhibiting similar characteris-tics in terms of the hydro-meteorological monitoring infras-tructure, which permits us to ensure homogeneity in the data collection procedures. This is particularly important, given the small space-time scales of flash floods, relative to the sampling characteristics of conventional rain and discharge measurement networks, which also makes these events par-ticularly difficult to observe and to predict (Borga et al., 2008).
The aim of this work is to characterise the flash flood regimes in the two regions. The analysis is articulated into two parts. In the first part, we examine the peak flow distri-bution and the seasonality characteristics. For this we iden-tified the major flash floods in the two regions in the last 5– 6 decades. 99 events were identified in this way and the fol-lowing data were collated: occurrence data, location, peak discharge, catchment area. These data are termedprimary data hereinafter, because they represent the minimal data structure required to qualify a flash flood event (Gaume et al., 2009). In the second part, we focus on the more detailed analysis of 13 selected major flash flood events, for which accurate measurements of rainfall and runoff response are available. These flash floods are characterised in terms of climatic features of the impacted catchments, duration and amount of the generating rainfall, and runoff ratio.
The paper is organised as follows. Section 2 describes the synoptic conditions leading to heavy precipitation events in the two Mediterranean regions. Section 3 describes the pri-mary data characterising the collected flash floods in the two areas and the corresponding climatological features. Sec-tion 4 examines the rainfall-runoff properties for selected major events. Section 5, finally, reports discussion and conclusions.
2 The prevailing synoptic conditions leading to heavy precipitation events in the two study areas
The relationship between atmospheric patterns and precipi-tation has been widely studied for the Mediterranean region (Romero et al., 1999; Rudari et al., 2005; Ziv et al., 2006; Lana et al., 2007; Martinez et al., 2007; Vicente-Serrano et al., 2009; Nuissier et al., 2011, among others). Different cat-egories of precipitation systems are observed in the Mediter-ranean areas, according to the season, region and mecha-nisms of formation. These systems include orographic pre-cipitation, rainy frontal systems, meso-scale convective sys-tems (MCSs) and isolated thunderstorms.
Heavy precipitation events and ensuing flash floods have different characteristics in the two regions considered in this study. These variations are reflected in different seasonal-ity features, with most of the intense precipitation events oc-curing during the autumn season over the Western Mediter-ranean region, whereas the peak of heavy precipitation over the Eastern Mediterranean occurs between December and May (Xoplaki et al., 2004).
of wet Mediterranean air flow or a marked convergence. The location of the Mediterranean low determines where these meteorological factors are presented (Jans`a et al., 2001). The Italian and French regions, northeastern Spain and the islands (the Balearics and Corsica) are the areas mostly affected by HEP in association to this group (Martinez et al., 2008).
Israel, located at the Southeastern corner of the Mediter-ranean, represents in general drier climatic conditions rela-tive to the northwest, with rainfall occurring between Oc-tober and May and a sharp climatic gradient that changes from Mediterranean climate in the North and center to semi-arid and semi-arid in the southern and eastern parts of the region. Over the Mediterranean climate areas of Israel, HPE and extreme flash floods are mainly associated with the Cyprus Low, which is a winter extratropical cyclone synoptic system (Sharon and Kutiel, 1986; Alpert et al., 1990; Krichak et al., 2004; Ziv et al., 2006; Wittenberg et al., 2007; Saaroni et al., 2010). The cold air masses gain moisture while moving over warmer Mediterranean waters and become condition-ally unstable. The cyclone dynamics and the intersection of the westerly flow with the shoreline and with the mountain ridges may result in intensive rainfall over the area (Sharon and Kutiel, 1986; Ziv et al., 2006; Saaroni et al., 2010). An upper-level trough extending toward southwestern Turkey in-duces cold advection aloft enhancing cyclogenic conditions over the Cyprus Low region. A second synoptic system re-sponsible for HPE in the semi-arid and arid regions of Is-rael over its eastern and southern parts mostly during au-tumn but also during spring is the Active Red Sea Trough (ARST). The ARST appears as a surface low-pressure trough extending from eastern Africa along the Red Sea towards the Middle East (Ashbel, 1938; Kahana et al., 2002; Dayan and Morin, 2006). Under these circumstances, the Levant region is subjected to a hot and dry south-easterly flow at lower atmospheric levels. This trough is accompanied by an up-per level trough extending from the eastern Mediterranean toward the delta of the Nile River leading to cold advec-tion aloft. This differential warming with a large tempera-ture lapse rate throughout the majority of the troposphere en-hances static instability stimulating deep convection (Dayan et al., 2001). Over the semi-arid and arid climate regions of Israel (southern and eastern parts) both synoptic systems, the ARST and the Cyprus Low might occur, though the former is more dominant (Kahana et al., 2002; Dayan and Morin; 2006). In addition, since the south-eastern parts of Israel are located on the transition zone between tropical and extrat-ropical systems, some cases associated with the penetration of tropical air masses generating intense rainfall inducing ex-treme flash floods were detected over these regions (e.g. Ziv, 2001; Morin et al., 2007).
In both areas, mesoscale factors, still poorly understood, contribute to the organization of the convection in a variety of forms ranging from shallow convection associated with the orography to deep convection associated with orographical and/or dynamical forcings which may present a regenerative
and stationary character, enhancing their severity. From the hydrological point of view, such HPE events affect small and steep mountainous and coastal watersheds with a high degree of vulnerability due to the increasing anthropogenic pres-sure, which make their socio-economical impact very severe at times, especially when the soils are already saturated by antecedent rain events.
3 Flash flood events: selection and analysis of primary data
A definition of flash flood event was required as a working principle to develop the archive and select the events. An ini-tial definition of flash flood event was based on the duration of the causative rainfall, the size of the catchment impacted by the flood, and the severity of the event. Consistent with the rules adopted by Gaume et al. (2009), duration of the storm event was limited to 24 h and maximum size of the catchment area was set to 1000 km2. Rainstorm duration is defined here as the time duration of the flood-generating rain-fall episodes which are separated by less than 6 h of rainrain-fall hiatus. As a follow up, these rules were slightly relaxed to include one event with a larger catchment size (Gard event in France, 2002, with a maximum basin area of 1856 km2)
(Braud et al., 2010). In order to maximise the information content, we used no more than two different catchments for each flood event. These conditions were relaxed in specific conditions to allow the inclusion of some extreme data for small (less than 10 km2)and large (few hundreds and more km2)catchments to the list. For the Western area, the
orig-inal data collected by Gaume et al. (2009) were updated by including more recent events collected in the frame of the HYDRATE project (Borga et al., 2010).
Analysis of peak flow distribution and seasonality was car-ried out by collating and compiling the primary data about the reported flash floods occurred during the last 5–6 decades in the two study regions. Primary data represent the minimal data structure required to qualify a flash flood event: occur-rence data, location, peak discharge, catchment area. De-tailed precipitation data are often missing, due to the relevant estimation difficulties under flash flood conditions.
0.1 1 10 100 1000
0.1 1 10 100 1000 10000
West‐Med East‐Med
Envelope Curve West Med Envelope Curve East Med
Unit
peak
dischar
g
e
Qu
(m
3s
‐
1km
‐
2)
Watershed area A (km2)
97 .
7 .
Fig. 1. Peak unit discharges of extreme flash floods in the two re-gions and envelope curves.
Western area we analysed 69 events, whereas 30 events are considered for the Eastern area.
Envelope curves have been used in this study to appraise the upper bound of flood events in the two areas. An enve-lope curve shows the relationship between the flood of record of a gauge site and its catchment area in a log-log-diagram. Envelope curves have been widely used in past publications on extreme floods (Gaume et al., 2009; Castellarin, 2007; Herschy, 2005; Costa et al., 1987; Meirovich et al., 1998) and have the advantage of being relatively unaffected by the data compilation density because they are determined by the maximum values of a sample. Figure 1 shows the data and the corresponding envelope curves for the two regions in a log-log representation. The envelope curve equation is as follows:
Qu=qrAβ (1)
whereQuis the unit discharge in (m3s−1km−2),A(km2)
is the catchment area,qr is a coefficient supposed to be
in-dependent on the catchment area also called “reduced” dis-charge in (m3s−1km−2(1+β)), and β is a negative scaling
exponent. As suggested by Castellarin (2007), the value of the exponentβ has been estimated through a linear regres-sion between log(Qu)and log(A)based on each of the
re-fined data sets. The relationship is drawn for basins with area exceeding 10 km2. For smaller areas, too few data are available and the relationship is not reported. Examination of Fig. 1 shows that the envelope curve for the Eastern re-gion exhibits a more pronounced decreasing with catchment size with respect to the curve of the Western region. A value of β= −0.4 appears to be the best suited for the Western Med region and is equal to the value previously estimated by Gaume et al. (2009), showing the robustness of those find-ings which remain unchanged after inclusion of more data concerning recent events. A value ofβ= −0.62 provides a better fit for the data from the Eastern Med region. Both val-ues lie in the range of previously calibrated envelope curve parameters for various climatic contexts (Castellarin, 2007;
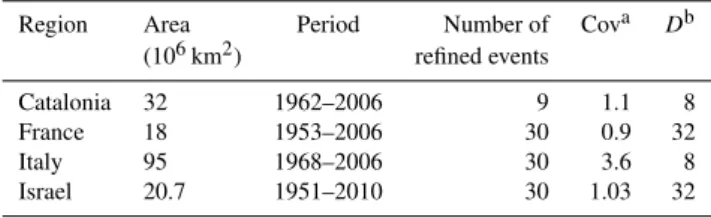
Table 1. Number of flash flood events listed in the database for each region.
Region Area Period Number of Cova Db
(106km2) refined events
Catalonia 32 1962–2006 9 1.1 8
France 18 1953–2006 30 0.9 32
Italy 95 1968–2006 30 3.6 8
Israel 20.7 1951–2010 30 1.03 32
aCov: coverage in year Area.bD: density in record year−1Area−1.
Jarvis, 1926; Yanovich et al., 1996). The difference between the two relationships may be due both to the effects of storm coverage and to hydrological characteristics. In the East-ern Mediterranean region, the effect of storm coverage may cause a pronounced reduction of the specific peak discharge for large catchments (larger than 100 km2), which could lead to a larger slope of the envelope curve. Moreover, for some of the semi-arid and arid catchments in the Eastern Mediter-ranean region, losses of flood water into channel alluvium may be also an important factor that tends to reduce the spe-cific peak discharge with increasing the catchment area, es-pecially for large catchments with relatively long channels (Shentsis et al., 1999; Dahan et al., 2007). While channel losses might be relatively insignificant immediately down-stream of an extreme thunderstorm, the relative significance of channel losses will increase with increasing the travel distances.
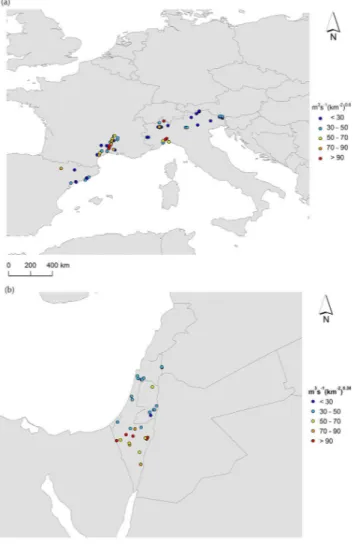
The spatial distribution of the reduced flash flood peaks is reported in Fig. 2a and b for the Western and the East-ern region, respectively. Figure 2a shows that events with high flash flood magnitude (events characterized byqrlarger
than 70 m3s−1km−2(1+β)), which are those which control
the shape of the envelope curve) concentrate over Central-Southern France and North-Western Italy. The proportion of high intensity events amounts to 23 % for Italy, 20 % for France and 11 % for Catalonia. The proportion of high intensity events is higher in the Eastern Mediterranean re-gion, with a percentage amounting to 27 %. Examination of Fig. 2b shows that in this region, the high intensity events tend to cluster in the semi arid and arid regions in the south-ern portion of the country. This shows that in general, semi-arid and arid catchments in Israel have the potential to produce higher specific peak discharges comparing to the Mediterranean portion of the same region. This may be spec-ulatively attributed to their lower infiltration rates, high gra-dients, and high rain rates during extreme events (Greenbaum et al., 2006).
Fig. 2.Atlas of reduced peak dischargeQuof extreme flash floods
in the two Mediterranean regions: (a) Western Region (Spain,
France, Italy);(b)Eastern Region (Israel).
in autumn, with a possible slight shift to the summer sea-son (May and June). In the Eastern Region these extremes tend to occur in the autumn and winter seasons (October– February) with some events also occurring in spring (March– May). This difference in the seasonality shows that the most extreme flash floods in the two Mediterranean Regions are not induced by the same types of meteorological events, hence confirming the influences of the general circulation patterns summarized in Sect. 2. The shift in seasonality from autumn to winter months when moving from the North-Western to South-Eastern Mediterranean confirms the find-ings of Koutroulis et al. (2010), who analysed the seasonality of floods in the island of Crete.
Number
of
ev
en
ts
0 5 10 15 20 25
Jan
u
ar
y
F
e
br
ua
ry
Ma
rc
h
Ap
ri
l
Ma
y
Ju
n
e
Ju
ly
Au
g
u
st
S
e
pt
e
m
be
r
Oc
to
b
e
r
No
v
e
m
b
e
r
De
c
e
m
b
e
r
West‐Med East‐Med
Month
Fig. 3.Number of flash flood occurrences in each month.
4 Examination of rainfall-runoff properties for selected extreme events
For the examination of the rainfall-runoff properties, a lim-ited set of major flood events was identified out of the sam-ples collated in the first step of the analysis. For these ma-jor events, high-resolution rainfall data and streamgauge data were available. Discharge data availability affords exami-nation of the hydrograph shape as well as estimation of the runoff depth. The quantitative precipitation estimation prob-lem is particularly crucial and difficult in the context of flash floods since the causative rain events may develop at very short space and time scales (Krajewski and Smith, 2002; Bouilloud et al., 2009; Zoccatelli et al., 2011). A methodol-ogy was specifically devised for rainfall estimation with the use of radar and raingauge data (Morin and Gabella, 2007; Bouilloud et al., 2009). Depending on the relative locations of the impacted regions and the radar systems available, as well as their operating protocols and maintenance, the quality of the radar datasets may vary a lot for such “event-driven” analyses. The methodology was therefore based on: (1) de-tailed collection of data and metadata about the radar systems and the raingauge networks (including raingauge data from amateurs and from bucket analysis), (2) analysis of the de-tection domain and the ground/anthropic clutter for the con-sidered case (Pellarin et al., 2002), (3) implementation of corrections for range-dependent errors, (e.g. screening, at-tenuation, vertical profiles of reflectivity), and (4) optimisa-tion of the rainfall estimaoptimisa-tion procedure by means of radar-raingauge comparisons at the event duration scale (Bouilloud et al., 2009).
0.1 0.2 0.4 0.8 1.6
0.1 0.2 0.4 0.8 1.6 3.2 6.4 12.8 25.6
West‐Med East‐Med
E/P
Ep/P
Fig. 4.Budyko diagram.
introduce some uncertainty in the final statistics. The selec-tion of the 50-yr recurrence amount as a threshold for event selection ensures consistency of the study archive with earlier archives of extreme rainfall events (Hershfield, 1961; Schu-macher and Johnson, 2006). For some events, either rainfall or peak discharge return period exceeded 500 yr (and some-times 1000 yr), for the events of Fella (Italy, 2003) (Norbiato et al., 2007), Gard (France, 2002) (Gaume et al., 2010), and Selska Sora (Slovenia, 2007) (Zanon et al., 2010). Table 2 re-ports the essential data for the 13 selected flash flood events: 8 from the Western Region and 5 from the Eastern region. For the latter group, 4 are from semi-arid and arid areas and 1 is from the Mediterranean climate area. The seasonality of the events reflects the patterns identified in the previous sec-tion, with most events in the Western area occurring during the summer-autumn season, and most events in the Eastern area occurring during autumn-winter.
4.1 Climate and annual water balance
The climatic characterisation carried out in this section aims to evaluate the range of climates of the considered case stud-ies and to identify the distribution of the events under dif-ferent climatic conditions. Flash flood generation may be influenced by climate variability in two ways: in a direct way through the variability of storm characteristics, and indi-rectly through the seasonality of rainfall and evapotranspira-tion fluxes which then affect the antecedent catchment con-ditions for individual storm events (Sivapalan et al., 2005). Moreover, climate may impact in an indirect way upon the runoff generation processes by controlling the geomorpho-logical structure of catchments, through soil formation and erosion processes. An example of the role of climate on the geomorphological properties of catchments is provided by the positive relationship between drainage density and mean annual precipitation (Gregory and Gardiner, 1975).
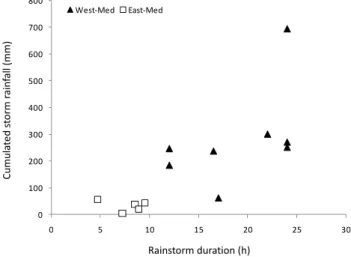
0 100 200 300 400 500 600 700 800
0 5 10 15 20 25 30
West‐Med East‐Med
Cumula
te
d
sto
rm
ra
in
fa
ll
(mm)
Rainstorm duration (h)
Fig. 5.Rainstorm characteristics: rainstorm duration versus cumu-lated event rainfall.
The climatic characterisation of the study catchments is provided here by means of Budyko’s climatic classification scheme (Budyko, 1974) (Fig. 4). The diagram represents the ratio of evaporation to precipitation versus the ratio of poten-tial evaporation to precipitation thereby combining a metric of the annual water balance and a dryness index. The location of a given catchment on this general relationship represents the relative degree of water versus energy limitation and can inform the interpretation of the controls on catchment runoff. Figure 4 shows clearly that the catchments in the West-ern region are concentrated under energy-limited conditions, whereas the catchments in the Eastern region are concen-trated under water limited conditions. A number of stud-ies have shown that both the coefficient of variation and the skewness of the distribution of the runoff coefficient increase with increasing the dryness index (Norbiato et al., 2009). Based on these results, we can expect more variable runoff coefficients in the Eastern Mediterranean area than in the Western one. Both areas are characterized by a markedly out of phase seasonal behavior of rainfall and temperature, which may induce important transient soil moisture dynamics.
4.2 Flood-generating rainfall: amount and duration
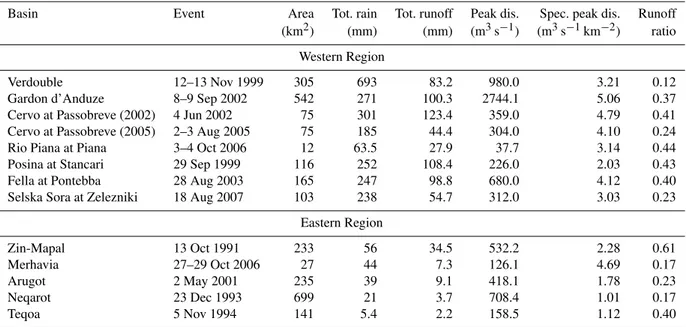
Table 2.Rainfall and runoff properties for selected events in the two Mediterranean regions.
Basin Event Area Tot. rain Tot. runoff Peak dis. Spec. peak dis. Runoff
(km2) (mm) (mm) (m3s−1) (m3s−1km−2) ratio
Western Region
Verdouble 12–13 Nov 1999 305 693 83.2 980.0 3.21 0.12
Gardon d’Anduze 8–9 Sep 2002 542 271 100.3 2744.1 5.06 0.37
Cervo at Passobreve (2002) 4 Jun 2002 75 301 123.4 359.0 4.79 0.41
Cervo at Passobreve (2005) 2–3 Aug 2005 75 185 44.4 304.0 4.10 0.24
Rio Piana at Piana 3–4 Oct 2006 12 63.5 27.9 37.7 3.14 0.44
Posina at Stancari 29 Sep 1999 116 252 108.4 226.0 2.03 0.43
Fella at Pontebba 28 Aug 2003 165 247 98.8 680.0 4.12 0.40
Selska Sora at Zelezniki 18 Aug 2007 103 238 54.7 312.0 3.03 0.23
Eastern Region
Zin-Mapal 13 Oct 1991 233 56 34.5 532.2 2.28 0.61
Merhavia 27–29 Oct 2006 27 44 7.3 126.1 4.69 0.17
Arugot 2 May 2001 235 39 9.1 418.1 1.78 0.23
Neqarot 23 Dec 1993 699 21 3.7 708.4 1.01 0.17
Teqoa 5 Nov 1994 141 5.4 2.2 158.5 1.12 0.40
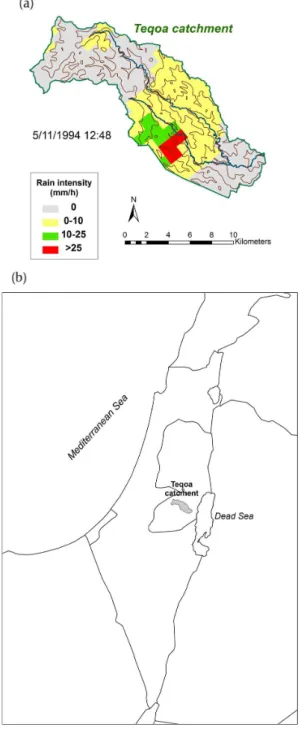
For these storms, the precipitation amount ranges from around 5.4 mm (Teqoa event, November 1994) to 693 mm in 24 h (Verdouble, November 1999). It should be noted that the rainfall amounts (Table 2 and Fig. 5) represent water-shed areal averages. For some cases, the focus on gauged basins imposes an observation scale which is poorly related to actual hydrological processes. This is particularly the case for those events which were caused by high intensity rainfall cores dispersed within the gauged watershed (for a more in depth analysis of these cases, see for example Morin et al., 2007 and Yakir and Morin, 2011). This is for instance the case of the Teqoa event of November 1994, for which 5.4 mm rainfall are reported over an area of 141 km2(Fig. 6). The runoff is mainly generated by the rainfall core which covers just a small percentage of the watershed. In cases of small rainfall cores like this one the uncertainty affecting rainfall estimation is potentially large because the gauge-adjustment methods use rain gauges often located outside the main cores. Examination of Fig. 5 shows that the events can be clearly grouped into two different classes according to the climatic and geographic conditions of the two regions. The first group, which includes the events collected in the East Med region, includes storm events which lasted up to ten hours. The corresponding rainfall amount is less than 100 mm, and almost all these events occurred under a dry or semi-arid cli-mate. The second group includes storm events collected in the Western Med Region, and is comprised of events with duration from ten to 24 h. The maximum rainfall amount re-ported for these events is around 693 mm. An implication from this analysis is that rainfall estimates used for the anal-ysis of the Eastern study area are likely to incorporate huge spatial variability which may obscure the large local values the precipitation may exhibit.
4.3 Runoff coefficient
The event runoff coefficient is a key concept in hydrology and an important diagnostic variable for catchment response. Examination of runoff coefficients is useful for catchment comparison to understand how different landscapes filter rainfall into event-based runoff. A specific question in the case of flash floods concerns the relationship with the rain-fall amount.
Fig. 6.Teqoa Event occurring in November 1994.(a)Radar-based rainfall intensities over the Teqoa catchment for 12:48 (local time), brown contour lines represent elevation (0–900 m in 100 m
inter-vals), and,(b)general location of the Teqoa catchment.
The relation between event runoff coefficient and the event cumulative rainfall is reported in Fig. 7.
The event runoff coefficients of the extreme flash flood events considered here are rather low, with a mean value of 0.33 for the events observed in the Western region and of 0.32 for those considered in the Eastern area. This agrees with earlier results obtained by Marchi et al. (2010) for flash
0 0.1 0.2 0.3 0.4 0.5 0.6 0.7 0.8 0.9 1
0 100 200 300 400 500 600 700 800
West‐Med East‐Med
Runof
f
co
ef
fi
ci
e
n
t
(
‐
)
Cumulated event rainfall (mm)
Fig. 7. Relation between event runoff coefficient and event cumu-lated rainfall.
floods observed in Europe. As expected, the variability of the runoff ratio is larger for the Eastern Med events (with a 0.17–0.61 range) than for the Western Med events (with a 0.12–0.44 range). The larger variability reported for the Eastern Med events may be due to the scale of rainfall ob-servation for gauged basins, which may not be completely relevant to explain the actual hydrological processes, and the potential larger uncertainty in rainfall estimation, as re-ported above. This problem is more acute for the Eastern Med events, which are characterised by a smaller spatial ex-tent of flood-triggering storms with respect to the Western Med cases.
5 Conclusions
Primary data concerning 99 flash flood events occurring in the Western and Eastern region of the Mediterranean basin and high-resolution hydrological data concerning 13 major flash floods were collected and examined to explore differing flood seasonality, relationship between flood peak and basin size, and rainfall-to-runoff properties. The main results are summarised below.
– Examination of data shows a peculiar seasonality effect on flash flood occurrence, with events in the Western region (Catalonia, France, northern Italy) mostly occur-ring in autumn, whereas events in the Eastern region commonly occur in the period from October to May, re-flecting different climatic forcing.
– Results show that the envelope curve for the Eastern re-gion exhibits a more pronounced decreasing with catch-ment size with respect to the curve of the Western gion. The differences between the two relationships re-flect changes in the effects of storm coverage and hy-drological characteristics between the two regions. – Analysis of the extreme cases for which high-resolution
data are available shows that (i) rainfall duration is gen-erally shorter, and (ii) rainfall depth is lower for the events in the Eastern region with respect to those in the Western region.
– The event runoff coefficients of the extreme flash flood events considered here are rather low, with a mean value of 0.33 for the events observed in the Western region and of 0.32 for those considered in the Eastern area. This agrees with earlier results obtained by Marchi et al. (2010) for flash floods observed in Europe. This clearly points out the need to account for hydrologi-cal conditions in the forecasting of flash floods. How-ever, the variability associated to the events observed in the Eastern region is higher than that computed for the events collected in the Western area.
– In both regions, no clear relationship between runoff ra-tio and rainfall depth may be identified. This points out the major influence of rainfall intensity (with respect to rainfall depth) and of the initial wetness conditions in the generation of runoff for these events.
Acknowledgements. The authors wish to thank the following organizations for their assistance in data gathering concerning the events over Israel: E.M.S Mekorot (radar data), Israel Meteoro-logical Service (raingauge data), and Israel HydroMeteoro-logical Service (discharge data). The research presented in this paper has been carried out as part of the EU RTD Project HYDRATE (European Commission, Sixth Framework Programme, Contract No. 037024). This study would not have been possible without the support from the HYDRATE project partners for the collection and analysis of the data and observations over the North-Western Mediterranean
region. We greatly appreciate the recommendations of Silas
Michaelidis, and an anonymous reviewer for improvements to the manuscript.
Edited by: L. Garrote
Reviewed by: S. C. Michaelides and another anonymous referee
References
Alpert, P., Neeman, B. U., and Shay-El, Y.: Climatological analysis of Mediterranean cyclones using ECMWF data, Tellus, 42A, 65– 77, 1990.
Ashbel, D.: Great floods in Sinai peninsula, Palestine, Syria and the Syrian desert, and the influence of the Red Sea on their forma-tion, Q. J. Roy. Meteorol. Soc., 64, 635–639, 1938.
Borga, M., Boscolo, P., Zanon, F., and Sangati, M.: Hydrom-eteorological analysis of the 29 August 2003 flash flood in the Eastern Italian Alps, J. Hydrometeorol., 8, 1049–1067, doi:10.1175/JHM593.1, 2007.
Borga, M., Gaume, E., Creutin, J. D., and Marchi, L.: Surveying flash flood response: gauging the ungauged extremes, Hydrol. Process., 22, 3883–3885, 2008.
Borga, M., Anagnostou, E. N., Bl¨oschl, G., and
Cre-utin, J.-D.: Flash Floods: observations and analysis
of hydrometeorological controls, J. Hydrol., 394, 1–3,
doi:10.1016/j.jhydrol.2010.07.048, 2010.
Bouilloud, L., Delrieu, G., Boudevillain, B., Borga, M., and Zanon, F.: Radar rainfall estimation for the post-event analysis of a Slovenian flash-flood case: application of the Mountain Refer-ence Technique at C-band frequency, Hydrol. Earth Syst. Sci., 13, 1349–1360, doi:10.5194/hess-13-1349-2009, 2009. Braud, I., Roux, H., Anquetin, S., Maubourguet, M.-M., Manus,
C., Viallet, P., and Dartus, D: The use of distributed hydrological models for the Gard 2002 flash flood event: Analysis of associ-ated hydrological processes, J. Hydrol., 394, 162–181, 2010. Budyko, M. I.: Climate and life, Academic, New York, 1974. Castellarin, A.: Probabilistic envelope curves for design flood
es-timation at ungauged sites, Water Resour. Res., 43, W044006, doi:10.1029/2005WR004384, 2007.
Collier, C.: Flash flood forecasting: what are the limits of pre-dictability?, Q. J. Roy. Meteorol. Soc., 133, 3–23, 2007. Costa, J. E.: A comparison of the largest rainfall-runoff floods in
the Unites States with those of the People’s Republic of China and the world, J. Hydrol., 96, 101–115, 1987.
Dahan, O., Shani, Y., Enzel, Y., Yechieli, Y., and
Yakire-vich, A.: Direct measurements of floodwater infiltration
into shallow alluvial aquifers, J. Hydrol., 344, 157–170, doi:10.1016/j.jhydrol.2007.06.033, 2007.
Davolio, S., Buzzi, A., and Malguzzi, P.: Orographic triggering of long lived convection in three dimensions, Meteorol. Atmos. Phys., 103, 35–44, 2009.
Dayan, U. and Morin, E.: Flash flood-producing rainstorms over the Dead Sea: A review, in: New Frontiers in Dead Sea Paleoenvi-ronmental Research, edited by: Enzel, Y., Agnon, A., and Stein, M., Geological Society of America Special Paper 401, 53–62, 2006
Gaume, E., Livet, M., Desbordes, M., and Villeneuve, J. P.: Hydro-logical analysis of the river Aude, France, flash flood on 12 and 13 November 1999, J. Hydrol., 286, 135–154, 2004.
Gaume, E., Valerie, B., Pietro, B., Newinger, O., Barbuc, M., Bateman, A., Blaˇskovicov´a, L., Bl¨oschl, G., Borga, M., Du-mitrescu, A., Daliakopoulos, J., Garcia, J., Irimescu, A., Kohnova, S., Koutroulis, A., Marchi, L., Matreata, S., Med-ina, V., Preciso, E., Sempere-Torres, D., Stancalie, G., Szol-gay, J., Tsanis, I., Velasco, D., and Viglione, A.: A compila-tion of data on European flash floods, J. Hydrol., 367, 70–78, doi:10.1016/j.jhydrol.2008.12.028, 2009.
Gaume, E., Ga´al, L., Viglione, A., Szolgay, J., Kohnov´a, S., and Bl¨oschl, G. : Bayesian MCMC approach to regional flood frequency analyses involving extraordinary flood events at un-gauged sites, J. Hydrol., 394, 101–117, 2010.
Giorgi, F.: Climate change hot-spots, Geophys. Res. Lett., 33, L08707, doi:10.1029/2006GL025734, 2006.
Greenbaum, N., Ben-Zvi, A., Haviv, I., and Enzel, Y.: The hydrol-ogy and paleohydrolhydrol-ogy of the Dead Sea tributaries, in: New Frontiers in Dead Sea Paleoenvironmental Research, edited by: Enzel, Y., Agnon, A., and Stein, M., Geological Society of Amer-ica Special Paper 401, 63–93, 2006.
Gregory, K. J. and Gardiner, V.: Drainage density and climate, Z. Geomorphol. N. F., 19, 287–298, 1975.
Herschy, R. W.: The world’s maximum observed floods, Flow Meas. Instrum., 13, 231–235, 2005.
Hershfield, D. M.: Rainfall Frequencies Atlas of the United States for Durations from 30 Minutes to 24 Hours and Return Periods from 1 to 100 Years, Technical Paper No. 40, Washington, DC, US Weather Bureau, 1961.
Jans`a, A., Genov´es, A., Picornell, M., Campins, J., and Riosalido, O. C. R.: Western Mediterranean cyclones and heavy rain. Part 2: statistical approach, Meteorol. Appl., 8, 43–56, 2001. Jarvis, C. S.: Flood flow characteristics, T. Am. Soc. Civ. Eng., 89,
985–1032, 1926.
Kahana, R., Ziv, B., Enzel, Y., and Dayan, U.: Synoptic climatology of major floods in the Negev Desert, Israel, Int. J. Climatol., 22, 867–822, 2002.
Koutroulis, A. G., Tsanis, I. K., and Daliakopoulos, I. N.: Season-ality of floods and their hydrometeorologic characteristics in the island of Crete, J. Hydrol., 394, 90–100, 2010.
Krajewski, W. F. and Smith, J. A.: Radar hydrology: Rainfall esti-mation, Adv. Water Res., 25, 1387–1394, 2002.
Krichak, S. O., Alpert, P., and Dayan, M.: The role of atmospheric processes associated with hurricane Olga in the December 2001 Floods in Israel, J. Hydrometeorol., 5, 1259–1270, 2004. Lana, A., Campins, J., Genov´es, A., and Jans`a, A.: Atmospheric
patterns for heavy rain events in the Balearic Islands, Adv. Geosci., 12, 27–32, doi:10.5194/adgeo-12-27-2007, 2007. Llasat, M. C., Llasat-Botija, M., Prat, M. A., Porc´u, F., Price,
C., Mugnai, A., Lagouvardos, K., Kotroni, V., Katsanos, D., Michaelides, S., Yair, Y., Savvidou, K., and Nicolaides, K.: High-impact floods and flash floods in Mediterranean coun-tries: the FLASH preliminary database, Adv. Geosci., 23, 47–55, doi:10.5194/adgeo-23-47-2010, 2010.
Marchi, L., Borga, M., Preciso, E., and Gaume, E.: Character-isation of selected extreme flash floods in Europe and impli-cations for flood risk management, J. Hydrol., 394, 118–133, doi:10.1016/j.jhydrol.2010.07.017, 2010.
Mart`ınez, M. D., Lana, X., Burgueno, A., and Serra, C.: Spatial and temporal daily rainfall regime in Catalonia (NE Spain) derived from four precipitation indices, years 1950–2000, Int. J. Clima-tol., 27, 123–138, 2007.
Meirovich, L., Ben-Zvi, A., Shentsis, I., and Yanovich, E.: Fre-quency and magnitude of runoff events in the arid Negev of Is-rael, J. Hydrol., 207, 204–219, 1998.
Montz, B. E. and Gruntfest, E.: Flash flood mitigation: recommen-dations for research and applications, Environ. Hazards, 4, 15– 22, 2002.
Morin, E. and Gabella, M.: Radar-based quantitative precipitation estimation over Mediterranean and dry climate regimes, J. Geo-phys. Res., 112, D20108, doi:10.1029/2006JD008206, 2007. Morin, E., Harats, N., Jacoby, Y., Arbel, S., Getker, M., Arazi,
A., Grodek, T., Ziv, B., and Dayan, U.: Studying the extremes: hydrometeorological investigation of a flood-causing rainstorm over Israel, Adv. Geosci., 12, 107–114, doi:10.5194/adgeo-12-107-2007, 2007.
Norbiato, D., Borga, M., Sangati, M., and Zanon, F.: Regional fre-quency analysis of extreme precipitation in the eastern Italian Alps and the August 29, 2003 flash flood, J. Hydrol., 345, 149– 166, doi:10.1016/j.jhydrol.2007.07.009, 2007.
Norbiato, D., Borga, M., Merz, R., Bl¨oschl, G., and Carton, A.: Controls on event runoff coefficients in the eastern Italian Alps, J. Hydrol., 375, 312–325, 2009.
Nuissier, O., Joly, B., Joly, A., Ducrocq, V., and Arbogast, P.: A statistical downscaling to identify the large-scale circula-tion patterns associated with heavy precipitacircula-tion events over southern France, Q. J. Roy. Meteorol. Soc., 137, 1812–1827, doi:10.1002/qj.866, 2011.
Pellarin, T., Delrieu, G., Saulnier, G. M., Andrieu, H., Vignal, B., and Creutin, J. D.: Hydrologic visibility of weather radar systems operating in mountainous regions: case study for the Ardeche catchment (France), J. Hydrometeorol., 3, 539–555, 2002. Romero, R., Sumner, G., Ramis, C., and Genove, A.: A
classifica-tion of the atmospheric circulaclassifica-tion patterns producing significant daily rainfall in the Spanish Mediterranean area, Int. J. Climatol., 19, 765–785, 1999.
Rudari, R., Entekhabi, D., and Roth, G.: Large-scale atmospheric patterns associated with mesoscale features leading to extreme precipitation events in Northwestern Italy, Adv. Water Res., 28, 601–614, 2005.
Saaroni, H., Halfon, N., Ziv, B., Alpert, P., and Kutiel, H.: Links between the rainfall regime in Israel and location and intensity of Cyprus lows, Int. J. Climatol., 30, 1014–1025, 2010. Sharon, D. and Kutiel, H.: The distribution of rainfall intensity in
Israel, its regional and seasonal variations and its climatological evaluation, J. Climatol., 6, 277–291, 1986.
Shentsis, I., Meirovich, L., Ben-Zvi, A., and Rosenthal, E.: As-sessment of transmission losses and groundwater recharge from runoff events in a Wadi under shortage of data on lateral inflow, Negev, Israel, Hydrol. Process., 13, 1649–1663, 1999.
Schumacher, R. S. and Johnson R. H.: Characteristics of U.S. ex-treme rain events during 1999–2003, Weather Forecast., 21, 69– 85, 2006.
L.: Tropical storms and the flood hydrology of the central Ap-palachians, Water Resour. Res., 37, 2143–2168, 2001.
Tallaksen, L. M.: A review of baseflow recession analysis, J. Hy-drol., 165, 349–370, 1995.
Vicente-Serrano, S. M., Beguer´ıa, S., L´opez-Moreno, J. I., El Ke-nawy, A. M., and Angulo Mart´ınez, M.: Daily atmospheric cir-culation events and extreme precipitation risk in Northeast Spain: the role of the North Atlantic Oscillation, Western Mediterranean Oscillation, and Mediterranean Oscillation, J. Geophys. Res. At-mos., 114, D08106, doi:10.1029/2008JD011492, 2009. Wittenberg, L., Kutiel, H., Greenbaum, N., and Inbar, M.:
Short-term changes in the magnitude, frequency and temporal distribu-tion of floods in the Eastern Mediterranean region during the last 45 years – Nahal Oren, Mt. Carmel, Israel, Geomorphology, 84, 181–191, 2007.
Wood, E. F., Sivapalan, M., and Beven, K.: Similarity and scale in watershed storm response, Rev. Geophys., 28, 1–18, 1990. Xoplaki, E., Gonzalez-Rouco, J. F., Luterbacher, J., and Wanner,
H.: Wet season Mediterranean precipitation variability: influence of large-scale dynamics and trends, Clim. Dynam., 23, 63–78, 2004.
Yakir, H. and Morin, E.: Hydrologic response of a semi-arid wa-tershed to spatial and temporal characteristics of convective rain cells, Hydrol. Earth Syst. Sci., 15, 393–404, doi:10.5194/hess-15-393-2011, 2011.
Yanovich, E., Ben-Zvi, A., and Shentsis, I.: Enveloping curves for maximum discharges in the Negev wadis. Rep. HYD/6/96, Israel Hydrological Service, Jerusalem, Israel (in Hebrew), 1996. Zanon, F., Borga, M., Zoccatelli, D., Marchi, L., Gaume, E.,
Bon-nifait, L., and Delrieu, G.: Hydrological analysis of a flash flood across a climatic and geologic gradient The September 18, 2007 event in Western Slovenia, J. Hydrol., 394, 182–197, doi:10.1016/j.jhydrol.2010.08.020, 2010.
Ziv, B.: A subtropical rainstorm associated with a tropical plume over Africa and the Middle East, Theor. Appl. Climatol., 69, 91– 102, doi:10.1007/s007040170037, 2001.
Ziv, B., Dayan, U., Kushnir, Y., Roth, C., Enzel, Y., and Ziv, B.: Regional and global atmospheric patterns governing rainfall in the southern Levant, Int. J. Climatol., 26, 55–73, 2006.