Comparative study of the soft tissue of young
Japanese-Brazilian, Caucasian and Mongoloid patients
Thais Maria Freire Fernandes1, Arnaldo Pinzan2, Renata Sathler3, Marcos Roberto de Freitas4, Guilherme Janson4, Fabiano Paiva Vieira5
How to cite this article: Fernandes TMF, Pinzan A, Sathler R, Freitas MR, Janson G, Vieira FP. Comparative study of the sot tissue of young Japanese-Brazilian, Caucasian and Mongoloid patients. Dental Press J Orthod. 2013 Mar-Apr;18(2):116-24.
Submitted: March 18, 2009 - Revised and accepted: August 16, 2009
» Patients displayed in this article previously approved the use of their facial and in-traoral photographs.
Contact address: Thais Maria Freire Fernandes
Alameda Octávio Pinheiro Brisolla, 9-75 – Bauru/SP – Brazil CEP: 17.012-901 – E-mail: [email protected]
1 PhD and Postdoc in Orthodontics, Bauru Dental School - University of São
Paulo (FOB-USP).
2 Associate Professor, Department of Pediatric Dentistry, Orthodontics and
Public Health, Bauru Dental School, FOB-USP.
3 MSc in Orthodontics, USP.
4 Head Professor, Department of Pediatric Dentistry, Orthodontics and Public
Health, FOB-USP.
5 Head Professor, Department of Pediatric Dentistry, Orthodontics and Public
Health, FOB-USP.
» The author reports no commercial, proprietary or financial interest in the products or companies described in this article.
Objective:To determine the normality mean values in the sot tissue cephalometric measurements of young Jap-anese-Brazilian, with normal occlusion and compare the results of the variables with compatible samples of young Caucasians and Mongoloids. Methods: Forty radiographs of young Caucasians, 32 of Japanese-Brazilians and 33 of Mongoloids were used. The three samples presented individuals with normal occlusion and well-balanced face. The samples were divided by gender due to the sot tissue characteristics and to facilitate comparison. The following sta-tistical tests were performed: Analysis of variance (ANOVA) and analysis of covariance (ANCOVA) with p < 0.05.
Results: The Japanese-Brazilian sample of females showed thinner soft tissues in the nasion region and smaller nose when compared to the Caucasians. The Mongoloid sample showedthinner tissues in the supramentonian and pogonion regions. In males, the Japanese-Brazilians had thinner tissues in the nasion region; thicker lower lip and supramentonian region in comparison to the Caucasian sample. For the Mongoloid, soft tissue was thicker in the glabella and ANS-Sn regions. Conclusion: It is necessary to use speciic sot tissue standards for this mixed race.
Keywords: Ethnic groups. Reference values. Orthodontics.
Objetivo:determinar os valores médios de normalidade das grandezas cefalométricas tegumentares de jovens mesti-ços nipo-brasileiros com oclusão normal, e compará-los com amostras compatíveis de jovens brasileiros leucodermas e xantodermas. Métodos: foram utilizadas 40 telerradiograias de jovens leucodermas, 32 de nipo-brasileiros e 33 de xantodermas. As três amostras apresentavam indivíduos com oclusão normal e face bem balanceada. As amostras foram divididas por sexo devido às características do tecido mole e para facilitar a comparação. Foram realizados os testes estatísticos análise de variância a um critério (ANOVA) e a análise de covariância (ANCOVA) com p < 0,05.
Resultados: a amostra nipo-brasileira para o sexo feminino apresentou menor espessura na região do násio e menor nariz em relação aos leucodermas. Em relação à amostra xantoderma, menor espessura na região supramentoniana e pogônio. No sexo masculino, os nipo-brasileiros apresentaram menor espessura na região do násio, maior espessura do lábio inferior e da região supramentoniana em relação à amostra leucoderma. Em relação aos xantodermas, maior espessura na região da glabela e da ENA-Sn. Conclusão: veriicou-se a necessidade de se utilizar normas de tecido mole especíicas para essa raça miscigenada.
INTRODUCTION
Orthodontics has the cephalometric analysis as a great diagnostic aid. Since the advent of the cephalostat, many authors have focused on establishing analyses that facilitate orthodontic planning. These studies were ini-tially conducted in Caucasians, but it has been shown that diferent races have diferent12 cephalometric
stan-dards, thus making it necessary to establish normative values for the diferent racial and ethnical groups.
In multicultural societies such as Brazil, the ra-cial differences have assumed great importance.12
The Brazilian population is presented today with a lot of intermingled people, making it necessary to recognize that the best esthetic and functional re-sults cannot be found when using as a guide another race or ethnicity.22 Although many studies are found
in the scientific literature about the soft tissue pro-file, there is no research on this subject comparing young Japanese-Brazilians with other races. Brazil is currently considered the country with the largest number of Japanese outside Japan and has different generations of nipponic origin,27 and a lot of
mis-cegenation, thus it is believed that a more specific study is necessary for this ethnic group.
This study aimed to determine the normality of mean values in the sot tissue proile of young Japanese-Brazilians, with normal occlusion, as well as Brazilians and Japanese descendants comparing these results with samples of young Caucasian Brazilians and young Mon-goloid Brazilians.
MATERIAL AND METHODS
Material
The sample consisted of 105 radiographs of young Japanese-Brazilians, Caucasians and Mongoloids, with normal occlusion and balanced face. The Japanese-Bra-zilian sample was selected by 3 researchers in diferent schools ofBauru (Brazil), and the other two samples were collected from iles of the Department of Orthodontics of the Bauru Dental School - University of São Paulo. The total study sample included40 young Caucasians (20 of each gender), 32 young Japanese-Brazilian adults (17 females and 15 males) and 33 young Mongoloid adults (17 females and 16 males). The means and standard de-viations of patients’ ages are shown in Table 1.
All individuals had the upper and lower permanent teeth in occlusion, with or without second and third
molars; showing a balanced growth pattern; harmonic proile, satisfactory occlusion or Angle Class I maloc-clusion with dental casts showing a discrepancy of up to 2 mm in the lower anterior region. None of them went through prior orthodontic treatment.
The Caucasian group consisted of Mediterranean de-scendents and the Mongoloid group of individuals with Japanese ancestries. These two samples did not include indi-viduals of mixed heritage. For the Japanese-Brazilian group, the individuals should be children or grandchildren resulting from the union of Caucasian Brazilians and Japanese (Fig 1), not including individuals from the island of Okinawa, since it was colonized by Chinese people.
Methods
Cephalometric radiographs were taken from all sam-ple individuals in maximum intercuspation (MHI), as it is known that the diferences between this mandibular position and centric relation (CR) are minimal at this age, and they minimally interfere in the cephalometric results, especially in cases of normal occlusion.30
The cephalogram tracings and measurements were made by the same researcher. The images were scanned through a latbed Numonics, AccuGrid A30TL (Nu-monics Corporation, Montgomeryville, PA, USA) con-nected to a PC with 700MHz Intel P3 processor, to ob-tain the cephalometric measurements, and subsequent data transfer to the Dentofacial Planner 7.02 sotware (Dentofacial Planner Sotware Inc., Toronto, Ontario, Canada). The correction of the magniication factor due to the use of diferent radiographic equipment (6% for the Caucasian sample, 9.8% for Japanese-Brazilian, and from 7% to 8% for the Mongoloid sample) was performed by the sotware itself.
Ater obtaining the lateral cephalometric radio-graphs, the anatomic design and location of classic cephalometric points was performed. To determine the linear horizontal measurements,9,11,13 representing the
sot tissue thickness, some measurements were made perpendicular to the N-perp line, taking the points of the sot tissue facial proile and their respective points in the dentoskeletal structures (Table 2, Fig 2).
Method error
Table 1 - Number of individuals (n) in each group, the distribution by gender, sample mean age and standard deviations (SD).
Groups Total Females Males Mean age SD
Caucasian 40 20 20 13.64 0.97
Japanese-Brazilian 32 17 15 13.96 1.28
Mongoloid 33 17 16 15.61 2.44
Figure 1 - Extraoral photographs of young Japanese-Brazilian female.
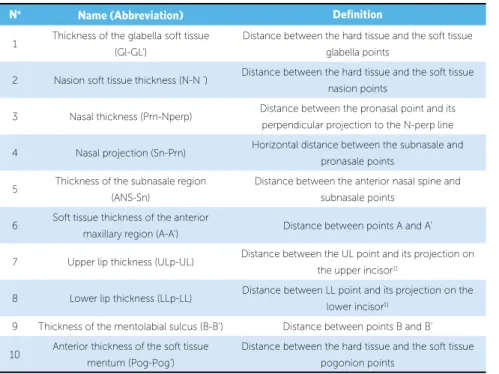
Table 2 - Linear horizontal measurements.
No Name (Abbreviation) Definition
1 Thickness of the glabella soft tissue (Gl-GL’)
Distance between the hard tissue and the soft tissue
glabella points
2 Nasion soft tissue thickness (N-N ‘) Distance between the hard tissue and the soft tissue nasion points
3 Nasal thickness (Prn-Nperp) Distance between the pronasal point and its
perpendicular projection to the N-perp line
4 Nasal projection (Sn-Prn) Horizontal distance between the subnasale and
pronasale points
5 Thickness of the subnasale region
(ANS-Sn)
Distance between the anterior nasal spine and subnasale points
6 Soft tissue thickness of the anterior
maxillary region (A-A’) Distance between points A and A’
7 Upper lip thickness (ULp-UL) Distance between the UL point and its projection on
the upper incisor11
8 Lower lip thickness (LLp-LL) Distance between LL point and its projection on the
lower incisor11
9 Thickness of the mentolabial sulcus (B-B’) Distance between points B and B’
10 Anterior thickness of the soft tissue mentum (Pog-Pog’)
Distance between the hard tissue and the soft tissue pogonion points
Figure 2 - Horizontal linear measurements.
one of the cephalometric measurements, the systematic and random errors were evaluated, independently. The
t test was used to calculate the dependent systematic
er-ror at a signiicance level of 5%. To estimate the random
error, the formula proposed by Dahlberg (Se2= ∑d2/2n)
was applied, where Se2 is the error variation, d is the
dif-ference between the irst and second measurement and n is the number of double measurements.
1 2
3 4 5 6
7 8 9
Statistical analysis
Descriptive statistics was used (mean and standard deviation). The Kolmogorov-Smirnov test demon-strated normal distribution for all variables allowing the use of parametric tests. Thus, for comparative sta-tistical analysis of the data, the following parametric tests were used: ANOVA, analysis of variance with a criterion for comparison of ages, and Ancova, analy-sis of covariance for comparison of cephalometric variables between the samples (Caucasian, Japanese-Brazilian and Mongoloid).
Due to the lack of age compatibility in the samples, the analysis of covariance (ANCOVA) was used to verify the inluence of age on the results. The analysis of covariance aims to assess the efect of one or more explanatory factors rated in nature (in this research,
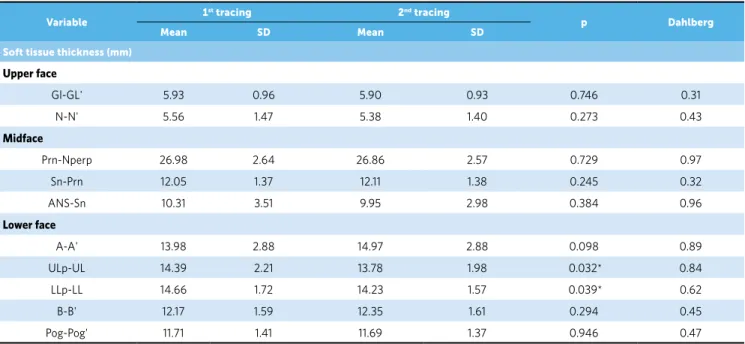
Table 3 - Evaluation of systematic and random errors by dependent t test and Dahlberg’s formula.
* Statistically signiicant at p < 0.05.
Variable 1
st tracing 2nd tracing
p Dahlberg
Mean SD Mean SD
Soft tissue thickness (mm)
Upper face
Gl-GL' 5.93 0.96 5.90 0.93 0.746 0.31
N-N' 5.56 1.47 5.38 1.40 0.273 0.43
Midface
Prn-Nperp 26.98 2.64 26.86 2.57 0.729 0.97
Sn-Prn 12.05 1.37 12.11 1.38 0.245 0.32
ANS-Sn 10.31 3.51 9.95 2.98 0.384 0.96
Lower face
A-A' 13.98 2.88 14.97 2.88 0.098 0.89
ULp-UL 14.39 2.21 13.78 1.98 0.032* 0.84
LLp-LL 14.66 1.72 14.23 1.57 0.039* 0.62
B-B' 12.17 1.59 12.35 1.61 0.294 0.45
Pog-Pog' 11.71 1.41 11.69 1.37 0.946 0.47
the race) in a given variable, excludingthe inluence of possible quantitative factors (in this case, the age) that may inluence the variables. The results were consid-ered statistically signiicant for p < 0.05. The tests were performed using the Statistica sotware for Windows 6.0 (Statistica for Windows 6.0, Copyright StatSot, Inc. Tulsa, USA).
RESULTS
The systematic and random errors are shown in Table 3. Only two variables showed a systematic er-ror and for the random erer-ror all variables showed ac-ceptable values of less than 1 mm (Table 3). There were significant differences regarding age for both genders (Table 4) and for this reason the analysis of covariance was performed (Tables 5 and 6).
Table 4 - Comparison of mean ages between the diferent races, in males and females included in the samples, by analysis of variance (ANOVA).
* Statistically signiicant at p < 0.05
Diferent letters show signiicant diferences between means by Tukey test.
Gender Caucasian Japanese-Brazilian Mongoloid p
n Mean SD n Mean SD n Mean SD
Female 20 13.70a 0.87 17 13.22a 1.04 17 15.65b 2.44 0.000*
Male 20 13.57a 1.03 15 14.79a.b 1.01 16 15.56b 2.51 0.002*
Table 6 -Comparison of variables between the male samples (ANCOVA and Tukey’s test).
Variable Caucasian (n = 20) Japanese-Brazilian (n = 17) Mongoloid (n = 17) p Age p
Mean SD Mean SD Mean SD
Soft tissue thickness (mm)
Upper face
Gl-GL' 5.87 0.49 6.01 0.68 5.94 0.87 0.196 0.652
N-N' 7.01a 0.88 6.14b 1.19 5.87b 1.01 0.744 0.005*
Midface
Prn-Nperp 28.83a 3.75 26.35a.b 2.52 24.90b 3.29 0.939 0.005*
Sn-Prn 14.52a 1.45 12.01b 1.48 11.73b 1.66 0.128 0.000*
ANS-Sn 10.07 1.93 9.64 1.48 8.84 1.96 0.504 0.115
Lower face
A-A' 14.38a 1.92 13.10a.b 1.58 12.65b 1.45 0.941 0.010*
ULp-UL 12.80 1.35 13.50 1.85 12.66 1.86 1.000 0.386
LLp-LL 13.82 1.09 13.79 1.19 14.11 1.63 0.555 0.944
B-B' 11.23a 1.49 10.71a 0.63 13.02b 1.84 0.475 0.002*
Pog-Pog' 11.47a 1.26 11.22a 1.36 12.25b 2.20 0.002* 0.003*
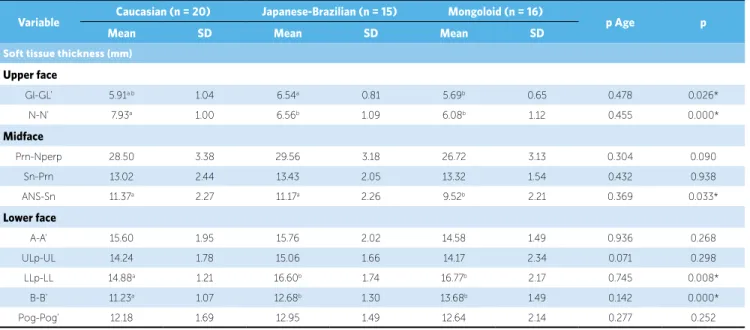
Table 5 - Comparison of variables between the female samples (ANCOVA and Tukey’s test).
Diferent letters show signiicant diferences between means by Tukey test. * Statistically signiicant at p < 0.05.
Diferent letters show signiicant diferences between means by Tukey test. * Statistically signiicant at p < 0.05.
Variable Caucasian (n = 20) Japanese-Brazilian (n = 15) Mongoloid (n = 16) p Age p
Mean SD Mean SD Mean SD
Soft tissue thickness (mm)
Upper face
Gl-GL' 5.91a.b 1.04 6.54a 0.81 5.69b 0.65 0.478 0.026*
N-N' 7.93a 1.00 6.56b 1.09 6.08b 1.12 0.455 0.000*
Midface
Prn-Nperp 28.50 3.38 29.56 3.18 26.72 3.13 0.304 0.090
Sn-Prn 13.02 2.44 13.43 2.05 13.32 1.54 0.432 0.938
ANS-Sn 11.37a 2.27 11.17a 2.26 9.52b 2.21 0.369 0.033*
Lower face
A-A' 15.60 1.95 15.76 2.02 14.58 1.49 0.936 0.268
ULp-UL 14.24 1.78 15.06 1.66 14.17 2.34 0.071 0.298
LLp-LL 14.88a 1.21 16.60b 1.74 16.77b 2.17 0.745 0.008*
B-B' 11.23a 1.07 12.68b 1.30 13.68b 1.49 0.142 0.000*
Pog-Pog' 12.18 1.69 12.95 1.49 12.64 2.14 0.277 0.252
DISCUSSION
The same appearance is not always appropriate for all races and ethnic groups, however, normative stud-ies of cephalometric variables are important for pre-cisely determining the variations of what is normal.22
There are some studies about sot tissue in Caucasians and Mongoloids, but no speciic study about Japanese-Brazilians and the comparison of these three groups.
Besides, it is diicult to compare cephalometric studies in diferent races due to sample characteristics, statistical methods, geographic distribution and racial deinitions. The groups that were used in this study met the same inclusion criteria, especially regarding race, which was strictly evaluated.
variables for men and women.4,17 The subdivision by
gender and racial group has received support in other studies,14,22 that emphasized that the accurate use of
cephalometrics, should consider these aspects. In this study, the genders were analyzed separately for better comparison of sot tissue proile.
Thickness alterations on the sot tissue proile vary with age and gender.29 Besides this fact, the
dento-skel-etal changes can directly inluence the desired esthetics. The sot tissue may also vary in thickness, length and position, which makes the study of the outline of these tissues necessary, in order to achieve a total facial har-mony.8 According to Arnett et al,4 the thickness
mea-surements of the upper lip, lower lip, point B region, pogonion, and chin alter the facial proile. As well as the variation of lip thickness, especially during retraction or dental protraction.8 Diferences found in the sot tissue
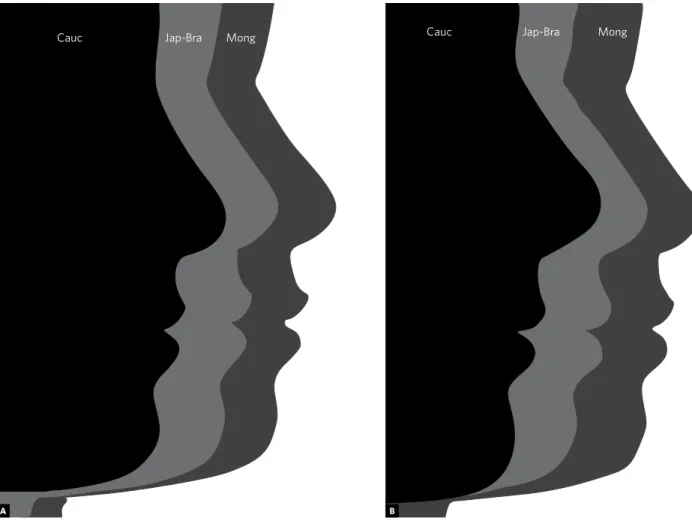
proile in this study can be seen in the pictures of the mean proile of the three samples (Figs 3A and B).
Cauc Jap-Bra Mong Cauc Jap-Bra Mong
Only the variables that showed statistically sig-niicant diference ater comparison with a sample of Caucasian and Mongoloid, will be discussed (Ta-bles 5 and 6). These magnitudes were grouped accord-ing to their representation and to facilitate the under-standing, divided into upper, middle and lower face. The results are discussed focusing on the Japanese-Brazilian sample and their diferences to the Mongol-oid and Caucasian samples.
Upper face
Considering the upper face a diference was ob-served in the thinnest region of the nasion (N-N’) for the Mongoloid (female 5.87 mm, female 6.08) and Japanese-Brazilian groups (female 6.14 mm, 6 male, 56 mm) when compared to the Caucasian sample (fe-male 7.01 mm, 7.93 mm fe(fe-male). This may be related to the fact that the sot tissues of the Japanese individu-als in these regions are more irmly attached and have
Figure 3 -Illustrative comparison of the proile means between Caucasian, Japanese-Brazilian and Mongoloid groups: (A) female, (B) male.
more subtle growth when compared to the Caucasian sample.29 The expectation that Japanese descendents
have a latter area in the region of the nasion and this appearance can be associated to a thinner sot tissue is, therefore, conirmed.
Also regarding the upper face, males of the Japa-nese-Brazilian sample showed statistically higher val-ues of sot tissue thickness (6.54 mm) in the glabella region (Gl-Gl’) when compared to the Mongoloid sample (5.69 mm). This increased thickness empha-sizes even more the lattening found for Japanese-Bra-zilians in the region of nasion (N-N’). This variable quantiies the thickness in the nasion region and pre-sented particular characteristics regarding the ethnic-ity for both genders. In most cases, the thickness in the nasion region is greater in men than in women and in both genders, the thickness of this area tends to remain constant or decrease slightly with age.25,29
Although the upper face area is not an area of direct action for the orthodontist and it will not be changed with orthodontic treatment itself, the practitioner must be aware of the general proile aspect.
Midface
As for the thickness of sot tissues in this region in females, it was observed that the Japanese-Brazilian sample showed intermediate values for variables Sn-Prn and Sn-Prn-Nperp. When compared to Caucasians (14.52 mm), statistically lower values for the size of the nose (Prn-Sn) were found in the Japanese-Brazilian sample (12.01 mm) and Mongoloids (11.73 mm), which can be conirmed by previous indings that Asians have smaller noses when compared to other populations.1
Corroborating with these indings, the smallest nose size was also evidenced by the variable Prn-Nperp in the Mongoloid sample (24.90 mm) when compared to Caucasians (28.83 mm).
The only variable for males that showed a signiicant diference in this region of the face was the ANS-Sn which showed intermediate values for Japanese-Brazil-ians (11.17 mm) but similar to the values found for the Caucasians (11.37 mm). This variable is also related to the nose and conirmed the trend of Mongoloids hav-ing smaller noses (9.52 mm) when compared to other races.1,24 As the amount of increase in nasal projection
(Prn-Nperp and Sn-Prn) in boys occurs in older ages,6,8
it is speculated that this is the reason for the lack of
dif-ference for this genderin this research, since Japanese individuals, even older, show a smaller nose (26.72 mm) when compared to other samples.
Angle, in his book published in 1907, stated that the amount of nose development may inluence the inal treatment result, and correction of isolated dental dis-harmonies can oten detract the proile.l3 Thus, the nose
size is a factor that should be evaluated in terms of treat-ment25 because irreversible procedures such as
extrac-tions and retracextrac-tions may afect facial proile esthetics.
Lower face
The lower face is the actual area of orthodontic ac-tion and this requires strict evaluaac-tion, which justiies the fact that most of the variables in this study are related to this region.
Subspinale region (A-A‘)
The thickness of the subspinale region (A-A’) di-rectly affects the shape of the soft tissue profile and only females showed significant differences between the races. The Caucasian sample showed the high-est value (14.38 mm) and it is known that the in-creased thickness of soft tissues in this region, may mask a dental protrusion.9 In this Japanese-Brazilian
sample, the thickness was numerically intermediate (13.10 mm) and the lowest value was found in the Mongoloid sample (12.65 mm) which, associated to the small nose in this group, may evidence even more a lip protrusion in Japanese descendents.
According to Subtelny25 the thickness of this region
grows on average 5 mm, from 3 to 18 years old, and comparatively, there is more sot tissue covering point A region then there is covering the nasion and pogonion regions. Thiswas also found in this study for all samples, in both genders. Thus, the sot proile tends to change more in the direction of increased thickness than in the reduction of facial convexity. This may partly explain why the sot tissue, without the inclusion of the nose, tends to get progressively less convex over the age, as occurs in the skeletal proile.25
Lower lip (LLp-LL)
thick-ness probably also contributes to the appearance of a more convex proile in the Asian descents.28 The
in-creased thickness of the lower lip can mask a Class II relation and promote a more straight proile, bring-ing at least esthetic beneits to Asian descendants with malocclusions such as these.
Over the years, the lips sufer a redirection that causes a wilted appearance. The decrease in thickness is compensated with a proportional increase in height of the lips, allowing the volume to remain the same.15
Based on this, fact, orthodontic planning can be estab-lished more thoroughly in young patients with gingival smile, considering these changes during growth.
The thickness, height and position of the lips, par-ticular characteristics of the individuals, can inluence the response of the sot tissue to retraction movement. Patients with thicker lips respond diferently to orth-odontic treatment than patients with thinner lips.20
Patients with thinner lips have a higher correlation be-tween changes in hard tissue and these changes’ relect in the sot tissue. It is important to note that orthodon-tists should be aware of the thickness of the lips in the treatment plan, not to overestimate the changes that may occur in sot tissue.
Supramentonian region (B-B‘) and pogonion (Pog-Pog’)
Japanese-Brazilian girls had less thickness in the su-pramentonian region (10.71 mm) and the Mongoloid sample had more thickness (13.02 mm) in this region. In this aspect, the girls had similar characteristics to the Caucasians. Unlike males, the supramentonian region (B-B’) showed greater thickness in Japanese-Brazilians (12.68 mm) and Mongoloids (13.68 mm), which contributes to a straighter mentolabial sulcus. For these races, the greater thickness of the lower lip and mentolabial sulcus features, emphasize the care that the orthodontist should have with relapses, since it is known that muscle behavior, depending on the intensity, has a greater chance of recurrence7 and more
stretched muscles tend to act even more.
The pogonion region for girls was statistically sig-nificant, both for the race factor as for the age fac-tor, suggesting the need for attention to this variable, because the difference occurs even for the same ages. A smaller thickness of this region for the Japanese-Brazilians (11.22 mm) and greater for the Mongoloid
sample(12.25 mm) was found, which is also the sam-ple of older peosam-ple. Thus, the greater thickness of this area, may be related to higher mean age of Japanese women (15.65 years), since the tendency is that the pogonion thickness increases with age, when evaluat-ing only the thickness itself.5,21
The previous aspects clearly show that soft tissues do not form a layer of uniform thickness that simply molds to the configuration of the underlying dento-skeletal structures. Therefore, it must be considered that individual variability on the thickness of soft tis-sues may reflect greatly on facial profile harmony, making the evaluation of this factor necessary during the diagnosis and planning of orthodontic treatment.8
FINAL CONSIDERATIONS
When performing comparisons such as the one performed in this study, it is emphasized that people should not be obsessed with numbers, but should ob-serve the characteristics of each person. It is known that the period and environment in which people live has a direct inluence on the concept of beauty. Al-calde et al2 reported that Japanese living in Japan, have
diferent expectations regarding the treatment of those living in other regions of the world, due to their social diferences and cultural inluences. Still, Miyajima et al19 reported the revival of a sense of ethnic pride,
es-pecially in big cities. Besides, patient demands have in-creased in the search of an exclusive orthodontic treat-ment, which is based on standards derived from their race or speciic ethnic group.16
Given the anthropological differences of facial and dental standards, Miura, Inoue and Suzuki18
conclud-ed that, besides having different values, the treatment target for the Japanese should also be different from the Caucasian. Although respecting the patient’s ex-pectations, it is important to make them aware of the effects that certain changes may bring. Many times, what is normal for a race may not be so for another race, and this has to be considered. In clinical terms, it is known that besides the labial biprotrusion, it is normal for the Asian descendants to show dental double protrusion1,16,23,26 Thus, a combination of
dif-ferent individualized brackets prescriptions10 could
used for Class III malocclusion have greater buccal torque for the upper incisors.10
Recognizing that racial inluences and character-istics have an important role in guiding the goals of orthodontic treatment and their esthetic results is criti-cal to understand the value and necessity of individu-alized orthodontic treatment and the study of speciic standards for each ethnic group. Thus, common sense should prevail, since it is oten not possible to achieve the “ideal standard”. The amount of tooth movement, tissue damage and increased risk of recurrence may contraindicate an action that seeks only the rigorous esthetic imposed by social environment. It is necessary to safeguard the conditions of muscle balance and no-tice what is acceptable for each individual.
CONCLUSION
Based on the methodology and results of this research, it can beconcluded that the mixed race sample of Japa-nese-Brazilians has its own characteristics, such as:
» Females:
• Reduced thickness in the nasion and lower nose regions in relation to Caucasians.
• Reduced thickness in the supramentonian and po
-gonion regions compared to Mongoloids. » Males:
• Reduced thickness in the nasion region, greater thickness of the lower lip and the supramentonian regions in relation to Caucasians.
• Greater thickness in the glabella and the ANS-Sn
regions compared to Mongoloids.
1. Alcalde RE, Jinno T, Orsini MG, Sasaki A, Sugiyama RM, Matsumura T. Soft tissue cephalometric norms in Japanese adults. Am J Orthod Dentofacial Orthop. 2000;118(1):84-9.
2. Alcalde RE, Jinno T, Pogrel MA, Matsumura T. Cephalometric norms in Japanese adults. J Oral Maxillofac Surg. 1998;56(2):129-34.
3. Angle EH. Treatment of malocclusion of the teeth. Angle’s system. Phipadelphia: Angle; 1907.
4. Arnett GW, Jelic JS, Kim J, Cummings DR, Beress A, Worley CM Jr, et al. Soft tissue cephalometric analysis: diagnosis and treatment planning of dentofacial deformity. Am J Orthod Dentofacial Orthop. 1999;116(3):239-53.
5. Behrents RG. An atlas of growth in the aging craniofacial skeleton [monograph]. Arbor: Center for Human Growth and Development; 1985.
6. Bishara SE, Hession TJ, Peterson LC. Longitudinal soft-tissue proile changes: a study of three analyses. Am J Orthod. 1985;88(3):209-23.
7. Brock RA 2nd, Taylor RW, Buschang PH, Behrents RG. Ethnic diferences in upper lip response to incisor retraction. Am J Orthod Dentofacial Orthop. 2005;127(6):683-91; quiz 755.
8. Burstone CJ. The integumental proile. Am J Orthod Dentofacial Orthop. 1958;44(1):1-25.
9. Burstone CJ. Integumental contour and extension patterns. Angle Orthod. 1959;29(2):93-104.
10. Capelozza Filho L, Silva Filho O, Ozawa TE, Cavassan A. Individualização de braquetes na técnica de straight-wire: revisão de conceitos e sugestão de indicações para uso. Rev Dental Press Ortod Ortop Facial. 1999;4(4):87-106. 11. Dainesi EA. A inluência dos padrões extremos de crescimento da face sobre
o peril tegumentar, analisada cefalometricamente em jovens leucodermas brasileiros [tese]. Bauru (SP): Universidade de São Paulo; 1998.
12. Freitas LM, Pinzan A, Janson G, Freitas KM, Freitas MR, Henriques JF. Facial height comparison in young white and black Brazilian subjects with normal occlusion. Am J Orthod Dentofacial Orthop. 2007;131(6):706.e1-6. 13. Holdaway RA. A soft-tissue cephalometric analysis and its use in orthodontic
treatment planning. Part I. Am J Orthod. 1983;84(1):1-28.
14. Huang WJ, Taylor RW, Dasanayake AP. Determining cephalometric norms for Caucasians and African Americans in Birmingham. Angle Orthod. 1998;68(6):503-11; discussion 512.
15. Iblher N. Changes in the aging upper lip — a photomorphometric and MRI-based study (on a quest to ind the right rejuvenation approach). J Plast Reconstr Aesthet Surg. 2008;61(10):1170-6.
16. Ioi H, Nakata S, Nakasima A, Counts A. Efect of facial convexity on antero-posterior lip positions of the most favored Japanese facial proiles. Angle Orthod. 2005;75(3):326-32.
REFERENCES
17. Kalha AS, Latif A, Govardhan SN. Soft-tissue cephalometric norms in a South Indian ethnic population. Am J Orthod Dentofacial Orthop. 2008;133(6):876-81. 18. Miura F, Inoue N, Suzuki K. Cephalometric standards for Japanese according to
the Steiner analysis. Am J Orthod. 1965;51:288-95.
19. Miyajima K, McNamara JA Jr, Kimura T, Murata S, Iizuka T. Craniofacial structure of Japanese and European-American adults with normal occlusions and well-balanced faces. Am J Orthod Dentofacial Orthop. 1996;110(4):431-8. 20. Oliver BM. The inluence of lip thickness and strain on upper lip response to
incisor retraction. Am J Orthod. 1982;82(2):141-9.
21. Pecora NG, Baccetti T, McNamara JA Jr. The aging craniofacial complex: a longitudinal cephalometric study from late adolescence to late adulthood. Am J Orthod Dentofacial Orthop. 2008;134(4):496-505.
22. Pinzan A. “Upgrade” nos conceitos da interpretação das medidas cefalométricas. In: Sakai E, Cotrim-Ferreira FA, Martins NS. Nova visão em ortodontia, ortopedia funcional dos maxilares. São Paulo: Ed. Santos; 2006. p. 41-9.
23. Sathler RC. Estudo comparativo do padrão cefalométrico de jovens mestiços nipo-brasileiros: grandezas dentárias e esqueléticas [dissertação]. Bauru (SP): Universidade de São Paulo; 2009.
24. Scavone H Jr, Trevisan H Jr, Garib DG, Ferreira FV. Facial proile evaluation in Japanese-Brazilian adults with normal occlusions and well-balanced faces. Am J Orthod Dentofacial Orthop. 2006;129(6):721.e1-5.
25. Subtelny JD. A longitudinal study of soft-tissue facial structures and their proile characteristics deined in relation to underlying skeletal structures. Am J Orthod Dentofacial Orthop. 1959;45(7):481-507.
26. Takahashi R. Padrão cefalométrico FOB-USP para jovens nipo-brasileiros com oclusão normal [dissertação]. Bauru (SP): Universidade de São Paulo; 1998. 27. Tomita NE, Chinellato LEM, Franco LJ, Iunes M, Freitas JAS, Lopes ES.
Condições de saúde bucal e diabetes mellitus na população nipo-brasileira de Bauru-SP. J Appl Oral Sci. 2003;11(1):15-20.
28. Utsuno H, Kageyama T, Deguchi T, Umemura Y, Yoshino M, Nakamura H, et al. Facial soft tissue thickness in skeletal type I Japanese children. Forensic Sci Int. 2007;172(2-3):137-43.
29. Utsuno H, Kageyama T, Uchida K, Yoshino M, Miyazawa H, Inoue K. Facial soft tissue thickness in Japanese female children. Forensic Sci Int. 2010;199(1-3):109.e1-6.