Predictors of Global Left Ventricular Function in Metabolic Syndrome
Branislava Aleksa Ivanovic, Marijana Vaso Tadic, Dragan Vojislav Simic
Clinic for Cardiology, Clinical Centre of Serbia, Belgrade - SerbiaMailing address: Branislava Aleksa Ivanovic •
Bul.Mihaila Pupina 151 - 11070 Novi Beograd - 11000 - Belgrade - Serbia E-mail: [email protected]
Manuscript received July 14, 2010; revised manuscript received October 25, 2010; accepted December 3, 2010.
Abstract
Background: The metabolic syndrome (MS) represents a cluster of cardiovascular risk factors that act synergistically.
Objective: The aim of this study was to determine which parameters were independently associated with the global left
ventricular (LV) function in subjects with MS estimated with the Tei index.
Methods: The study included 234 subjects with MS and 96 controls adjusted by age. MS was defined by the presence
of three or more of ATP-NCEP III criteria. All subjects underwent laboratory blood tests and two-dimensional, pulsed and tissue Doppler echocardiography. Appropriate tissue Doppler time intervals for the estimation of the Tei index were also assessed.
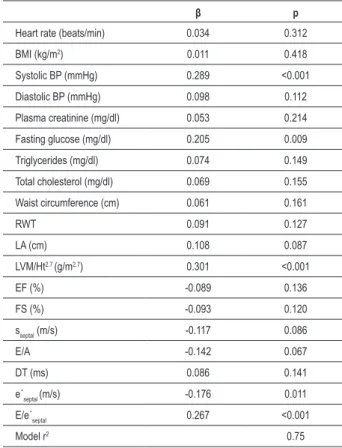
Results: The Tei index was increased in subjects with MS (0.35 ± 0.05 vs 0.49 ± 0.10, p < 0.001). Multiple regression
analysis of the clinical parameters showed that systolic blood pressure (β = 0.289, p < 0.001), fasting glucose (β = 0.205, p = 0.009), LV mass index (β = 0.301, p < 0.001), E/e’septal (β = 0.267, p < 0.001), and e’septal (β = -0.176, p = 0.011) were independently associated with the global left ventricular function estimated by Tei index.
Conclusion: MS has a significant impact on LV global function. Systolic blood pressure, fasting glucose, LV mass index,
E/e’septal, and e’septal were independently associated with the LV global function. (Arq Bras Cardiol 2011;96(5):377-385)
Keywords: Ventricular function left; metabolic syndrome; myocardial ischemia; risk factors.
Methods
The investigation included 330 subjects divided into two groups: the first group involved 234 subjects (125 women and 109 men) with MS, while the control group included 96 subjects (52 women and 44 men) with no risk factors of MS. Patients with clinical or laboratory signs of heart failure, coronary artery disease, previous cerebrovascular insult, valvular heart disease, secondary hypertension or other chronic diseases such as cirrhosis of the liver, kidney failure, or endocrinological diseases (except diabetes mellitus type 2) were excluded from the study. MS was defined by the presence of three or more of the National Cholesterol Education Program’s Adult Treatment Panel III (NCEP-ATP-III) criteria from 20018: abdominal obesity (waist circumference ≥102 cm in
men and ≥ 88 cm in women), fasting triglycerides ≥150 mg/
dl, decreased HDL cholesterol (< 40 mg/dl in men and < 50
mg/dl in women), high blood pressure (≥ 130/85 mmHg or antihypertensive therapy) and fasting glucose ≥ 110 mg/dl.
The anthropometric measures (height, weight, waist circumference) were obtained from all subjects included in the study in order to calculate body surface area (BSA) and body mass index (BMI). Regarding laboratory analyses, fasting glucose, hemoglobin A1c, total cholesterol, low and high-density lipoprotein cholesterol (HDL, LDL), triglycerides, uric acid and serum creatinine levels were measured.
Arterial blood pressure values were obtained by measuring the average value of two consecutive measurements in the
Introduction
The myocardial performance index (the Tei index) reflects systolic and diastolic function of the left and right ventricles1.
It could be impaired in patients with various risk factors such as hypertension2, diabetes3, and obesity4. The influence of the
metabolic syndrome (MS) on global left ventricular function has not been completely determined. There are different opinions on this problem; on the one hand, there are authors who believe that MS is the cluster of risk factors and therefore the alteration of global left ventricular function is an expected and logical sequence5,6. On the other hand, some investigators
have shown that the Tei index is not significantly altered in patients with a high prevalence of obesity, hypertension and diabetes, which are the important risk factors of metabolic syndrome7. A few studies have assessed the impact of
sitting position with a five-minute interval in the morning hours, using a conventional sphygmomanometer.
The diagnosis of diabetes was based on the criteria of the World Health Organization published in 20069 and arterial
hypertension according to the recommendations of the European Association for Hypertension in 200710. The protocol
was approved by the Research Ethics Committee of the Faculty of Medicine, University of Belgrade. Informed consent was obtained from all participants.
Echocardiography
Echocardiographic examination was performed on an Acuson Sequoia 256 ultrasound system by using a 2-to-4 MHz transducer. The values of all echocardiographic parameters were obtained as the average value of five consecutive cardiac cycles. The left ventricular end-systolic (LVESD) and end-diastolic diameters (LVEDD), the left ventricular posterior wall (PWT) and interventricular septum thickness (IVS) were determined according to the recommendations of the American Society of Echocardiography11. End-systolic and
end-diastolic volumes and parameters of systolic function (ejection fraction - EF and fractional shortening - FS) were estimated by using the Teicholz formula. Relative wall thickness (RWT) was calculated as (2xPWT)/LVEDD.
The left ventricular mass (LVmass) was calculated by using Penn formula: LV mass = 1.04x[(LVEDD+ PWTD+IVS)3-
(LVEDD)3] - 13,6 g12. The left ventricular mass index (LVmass/
Ht2,7) was calculated as the ratio of the left ventricular mass and
height2,7. The left ventricular hypertrophy was defined as LVmass/
Ht2,7 ≥ 51 g/m2,7 for men and ≥ 49.5 g/m2,7 for women13.
The analysis of transmitral inflow velocities was obtained by pulsed-wave Doppler in the apical four-chamber view with the sample volume placed at the mitral valve leaflet tips14. Measurements included the transmitral early diastolic
(E-wave) and atrial (A-wave) velocities to calculate E/A ratio and E-wave deceleration time (DT)13.
Tissue Doppler imaging was used to obtain LV myocardial velocities in the apical four-chamber view with a 2-mm sample volume placed at the septal segment of the mitral annulus during early diastole (e´septal) and systole (sseptal)
14. The E/e´ septal
ratio was determined using previously estimated values of E and e´septal flow velocities during early diastole obtained by pulsed and tissue Doppler.
The parameters necessary for the calculation of the Tei index were obtained by tissue Doppler in the apical four-chamber view15. A 2-mm sample volume was placed at the lateral corner
of the mitral annulus. The isovolumetric contraction time (IVCT) and isovolumetric relaxation time (IVRT) were measured from the end of the mitral annular velocity pattern to the onset of the S-wave and from the end of the S-wave to the onset of the mitral annular velocity pattern, respectively. The ejection time (ET) was defined as the duration of the LV outflow Doppler velocity profile. The Tei index was calculated according to the formula: Tei index = (IVCT + IVRT)/ET1.
Statistical analyses
Continuous variables were presented as mean ± standard deviation (SD) and were compared by t-test for two
independent samples, as they showed a normal distribution. Differences in proportions were compared by using χ² test. Pearson´s correlation coefficient was used for determination of correlation between the Tei index and different clinical and echocardiographic parameters. The same test was used for correlation determination between these parameters and tissue Doppler intervals, which were required for the calculation of the Tei index (IVRT, IVCT and ET). Stepwise multiple variable regression analysis determined which parameters, clinical and echocardiographic, were independently associated with the Tei index or its components (IVRT, IVCT and ET). Heart rate and the variable which had p < 0.10 in correlation analyses entered in the stepwise multiple regression analysis. We also determined which MS components correlated with and which components were independently associated with the Tei index. A p-value < 0.05 was considered statistically significant.
Results
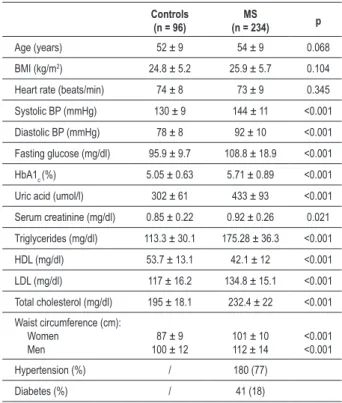
There was no statistically important difference in mean age between the subjects with MS and controls (52 ± 9 vs 54 ± 9 years, p > 0.05). All clinical parameters of the study group are shown in Table 1. Values of all the parameters of MS were significantly higher in patients with MS compared to controls (Table 1). We also found that the levels of hemoglobin A1c, uric acid, serum creatine, LDL cholesterol and total cholesterol were significantly higher in the population of patients with MS (Table 1).
There were no statistically important differences between the observed groups regarding LV diameters, ejection fraction and fractional shortening (Table 2). Relative wall thickness and LV mass index were significantly increased in the MS group (Table 2). Compared to the control group, MS subjects had significantly higher percentage of LV hypertrophy (Table 2).
The systolic function parameter obtained by tissue Doppler (sseptal) demonstrated normal LV systolic function in subjects with MS. However, the LV diastolic function parameters such as E/A, DT, e’septal and E/e’septal were significantly deteriorated in the group with MS (Table 2).
The parameters required for calculation of the Tei index were also altered in subjects with MS. IVRT and IVCT were significantly prolonged, while the ET was shortened in the MS group, which determined the increased value of the Tei index (Table 2).
Univariate correlation analyses showed that heart rate, systolic and diastolic blood pressure, levels of glucose, triglycerides, total cholesterol and serum creatinine, and waist circumference were associated with LV global function estimated by the Tei index (Table 3). Among the echocardiographic parameters, univariate correlation analyses found that relative wall thickness, the left atrial diameter, the left ventricular mass index, E/A ratio, sseptal, e’septal and E/e’septal ratio correlated with the myocardial performance
Table 1 - Clinical characteristics of the study population
Controls
(n = 96) (n = 234)MS p
Age (years) 52 ± 9 54 ± 9 0.068
BMI (kg/m2) 24.8 ± 5.2 25.9 ± 5.7 0.104
Heart rate (beats/min) 74 ± 8 73 ± 9 0.345
Systolic BP (mmHg) 130 ± 9 144 ± 11 <0.001
Diastolic BP (mmHg) 78 ± 8 92 ± 10 <0.001
Fasting glucose (mg/dl) 95.9 ± 9.7 108.8 ± 18.9 <0.001
HbA1c (%) 5.05 ± 0.63 5.71 ± 0.89 <0.001
Uric acid (umol/l) 302 ± 61 433 ± 93 <0.001
Serum creatinine (mg/dl) 0.85 ± 0.22 0.92 ± 0.26 0.021
Triglycerides (mg/dl) 113.3 ± 30.1 175.28 ± 36.3 <0.001
HDL (mg/dl) 53.7 ± 13.1 42.1 ± 12 <0.001
LDL (mg/dl) 117 ± 16.2 134.8 ± 15.1 <0.001
Total cholesterol (mg/dl) 195 ± 18.1 232.4 ± 22 <0.001
Waist circumference (cm):
Women Men
87 ± 9 100 ± 12
101 ± 10 112 ± 14
<0.001 <0.001
Hypertension (%) / 180 (77)
Diabetes (%) / 41 (18)
MS - metabolic syndrome, BMI - body mass index, BP - blood pressure, HbA1c - glycated hemoglobin, HDL - high-density lipoprotein cholesterol, LDL-low - density lipoprotein cholesterol.
Table 2 - Echocardiographic parameters of left ventricular structure and function in the study population
Controls
(n = 96) (n = 234)MS p
Left ventricular structure
LVEDD (cm) 4.86 ± 0.54 4.93 ± 0.49 0.254
LVESD (cm) 2.97 ± 0.45 3.07 ± 0.53 0.105
RWT 0.38 ± 0.08 0.43 ± 0.09 <0.001
LA (cm) 3.6 ± 0.6 4.1 ± 0.7 <0.001
LVM/Ht2.7 (g/m2.7) 40.7 ± 8.3 46.7 ± 9.1 <0.001
LV hypertrophy (%) 4 (4) 70 (30) <0.001
Left ventricular systolic function
EF (%) 67 ± 6 68 ± 5 0.121
FS (%) 39 ± 4 38 ± 5 0.082
sseptal (m/s) 0.081 ± 0.017 0.077 ± 0.019 0.075
Left ventricular diastolic function
E (m/s) 0.78 ± 0.17 0.82 ± 0.20 0.086
A (m/s) 0.61 ± 0.14 1.11 ± 0.22 <0.001
E/A 1.30 ± 0.22 0.75 ± 0.18 <0.001
DT (ms) 202 ± 35 234 ± 31 <0.001
e´septal (m/s) 0.12 ± 0.04 0.09 ± 0.03 <0.001
E/e´septal 6.63 ± 1.58 9.21 ± 1.77 <0.001
Global left ventricular function
IVRT (ms) 82 ± 15 94 ± 18 <0.001
IVCT (ms) 34 ± 4 55 ± 6 <0.001
ET (ms) 326 ± 26 311 ± 24 <0.001
Tei index 0.35 ± 0.05 0.49 ± 0.10 <0.001 MS - metabolic syndrome, LVEDD - left ventricle end-diastolic dimension, LVESD - left ventricle end-systolic dimension, RWT - relative wall thickness, LA - left atrium, LVM - left ventricle mass, Ht - height, EF - ejection fraction, FS - fractional shortening, sseptal - systolic low velocity across the septal segment of
mitral annulus obtained by tissue Doppler, E - transmitral low velocity during early diastole obtained by pulse Doppler, A - transmitral low velocity during late diastole obtained by pulse Doppler, DT - deceleration time, e´septal- early diastolic low velocity across the septal segment of mitral annulus obtained by tissue Doppler, IVRT - isovolumetric relaxation time, IVCT - isovolumetric contraction time, ET - ejection time.
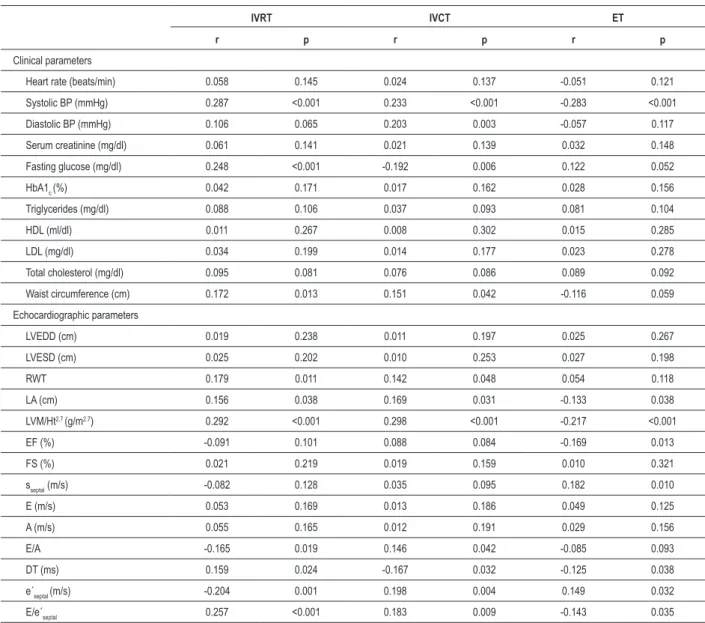
Additionally, we determined which parameters were associated with all time intervals used in the Tei index equation (IVRT, IVCT and ET).
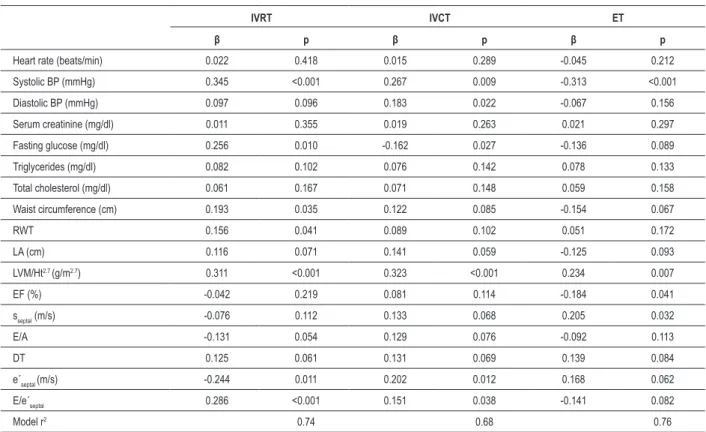
The univariate analysis of clinical and echocardiographic parameters in the MS group showed that systolic blood pressure, fasting glucose level, waist circumference, relative wall thickness, left atrial diameter, left ventricular mass index, E/A ratio, deceleration time, e’septal and E/e’septal ratio were associated with IVRT (Table 5). Moreover, all these parameters except the left atrial diameter, E/A ratio and deceleration time were independently associated with IVRT (Table 6).
The correlation analysis revealed that systolic and diastolic blood pressure, fasting glucose level, waist circumference, relative wall thickness, left atrial diameter, left ventricular mass index, E/A ratio, deceleration time, e’septal and E/e’septal ratio were associated with IVCT (Table 5). All
mentioned parameters, except diastolic blood pressure, were independently associated with IVCT (Table 6).
The univariate analysis also demonstrated that systolic blood pressure, left atrial diameter, left ventricular mass index, ejection fraction, sseptal, deceleration time, e’septal and E/e’septal ratio were associated with ET (Table 5). However,
only systolic blood pressure, left ventricular mass index, ejection fraction, and sseptal were independently associated with ET (Table 6).
Correlation analysis showed that all components of MS except HDL were associated with the Tei index, but only systolic blood pressure, fasting glucose and levels of
triglycerides were independently associated with this global LV function parameter (Table 7).
Discussion
The Tei index is a unique echocardiographic parameter that simultaneously shows the systolic and diastolic function of a ventricle.
There is no absolute agreement about the impact of age and heart rate on the Tei index2,3,5,7,16. Our research showed that the
Table 3 - Correlation coeficients of the Tei index and other clinical and echocardiographic parameters of subjects with metabolic syndrome
r p
Clinical parameters
Age (years) -0.017 0.577
BMI (kg/m2) 0.082 0.121
Heart rate (beats/min) 0.138 0.035
Systolic BP (mmHg) 0.402 <0.001
Diastolic BP (mmHg) 0.132 0.037
Fasting glucose (mg/dl) 0.382 <0.001
HbA1c (%) 0.098 0.105
Uric acid (umol/l) 0.071 0.156
Serum creatinine (mg/dl) 0.119 0.047
Triglycerides (mg/dl) 0.292 <0.001
HDL (mg/dl) -0.084 0.117
LDL (mg/dl) 0.064 0.196
Total cholesterol (mg/dl) 0.234 0.008
Waist circumference (cm) 0.188 0.014
Echocardiographic parameters
LVEDD (cm) 0.062 0.212
LVESD (cm) 0.021 0.552
RWT 0.175 0.019
LA (cm) 0.167 0.022
LVM/Ht2.7 (g/m2.7) 0.564 <0.001
EF (%) -0.108 0.078
FS (%) -0.111 0.067
sseptal (m/s) -0.185 0.015
E (m/s) -0.087 0.112
A (m/s) 0.101 0.085
E/A -0.201 0.013
DT (ms) 0.105 0.081
e´septal (m/s) -0.288 <0.001
E/e´septal 0.498 <0.001
BMI - body mass index, BP - blood pressure, HbA1c - glycated hemoglobin, HDL - high-density lipoprotein cholesterol, LDL - low-density lipoprotein cholesterol, LVEDD - left ventricle diastolic dimension, LVESD - left ventricle end-systolic dimension, RWT - relative wall thickness, LA - left atrium, LVM - left ventricle mass, Ht - height, EF - ejection fraction, FS - fractional shortening, sseptal - systolic low velocity across the septal segment of mitral annulus obtained by tissue Doppler, E - transmitral low velocity during early diastole obtained by pulse Doppler, A - transmitral low velocity during late diastole obtained by pulse Doppler, DT - deceleration time, e´septal- early diastolic low velocity across the
septal segment of mitral annulus obtained by tissue Doppler.
Table 4 - Stepwise multiple variable regression models of Tei index for clinical and echocardiographic parameters in metabolic syndrome group
β p
Heart rate (beats/min) 0.034 0.312
BMI (kg/m2) 0.011 0.418
Systolic BP (mmHg) 0.289 <0.001
Diastolic BP (mmHg) 0.098 0.112
Plasma creatinine (mg/dl) 0.053 0.214
Fasting glucose (mg/dl) 0.205 0.009
Triglycerides (mg/dl) 0.074 0.149
Total cholesterol (mg/dl) 0.069 0.155
Waist circumference (cm) 0.061 0.161
RWT 0.091 0.127
LA (cm) 0.108 0.087
LVM/Ht2.7 (g/m2.7) 0.301 <0.001
EF (%) -0.089 0.136
FS (%) -0.093 0.120
sseptal (m/s) -0.117 0.086
E/A -0.142 0.067
DT (ms) 0.086 0.141
e´septal (m/s) -0.176 0.011
E/e´septal 0.267 <0.001
Model r2 0.75
BP - blood pressure, RWT - relative wall thickness, LA - left atrium, LVM - left ventricle mass, Ht - height, EF - ejection fraction, sseptal - systolic low velocity across the septal segment of mitral annulus obtained by tissue Doppler, E - transmitral low velocity during early diastole obtained by pulse Doppler, A - transmitral low velocity during late diastole obtained by pulse Doppler, e´septal -early diastolic low velocity across the septal segment of mitral annulus obtained by tissue Doppler.
Arterial hypertension changes the myocardial structure, primarily due to abnormal accumulation of collagen in the extracellular space, resulting in a decrease of compliance and occurrence of LV diastolic dysfunction18.
There is no universal opinion about the influence of systolic and diastolic arterial blood pressure on the global LV function and the Tei index. Some authors showed that the Tei index correlated with the arterial blood pressure5,15,19,
while others have disagreed2,17. Our investigation revealed
that the systolic and diastolic blood pressure correlated with the myocardial performance index, but only systolic blood pressure was independently associated with the Tei index. The same result was obtained when we considered only MS criteria. Moreover, systolic blood pressure was shown to be the strongest independent predictor of the Tei index among MS criteria with the highest statistical significance (p < 0.001).
Table 5 - Correlation analysis of tissue Doppler intervals needed for Tei index calculation and clinical and echocardiographic parameters in metabolic syndrome group
IVRT IVCT ET
r p r p r p
Clinical parameters
Heart rate (beats/min) 0.058 0.145 0.024 0.137 -0.051 0.121
Systolic BP (mmHg) 0.287 <0.001 0.233 <0.001 -0.283 <0.001
Diastolic BP (mmHg) 0.106 0.065 0.203 0.003 -0.057 0.117
Serum creatinine (mg/dl) 0.061 0.141 0.021 0.139 0.032 0.148
Fasting glucose (mg/dl) 0.248 <0.001 -0.192 0.006 0.122 0.052
HbA1c (%) 0.042 0.171 0.017 0.162 0.028 0.156
Triglycerides (mg/dl) 0.088 0.106 0.037 0.093 0.081 0.104
HDL (ml/dl) 0.011 0.267 0.008 0.302 0.015 0.285
LDL (mg/dl) 0.034 0.199 0.014 0.177 0.023 0.278
Total cholesterol (mg/dl) 0.095 0.081 0.076 0.086 0.089 0.092
Waist circumference (cm) 0.172 0.013 0.151 0.042 -0.116 0.059
Echocardiographic parameters
LVEDD (cm) 0.019 0.238 0.011 0.197 0.025 0.267
LVESD (cm) 0.025 0.202 0.010 0.253 0.027 0.198
RWT 0.179 0.011 0.142 0.048 0.054 0.118
LA (cm) 0.156 0.038 0.169 0.031 -0.133 0.038
LVM/Ht2.7 (g/m2.7) 0.292 <0.001 0.298 <0.001 -0.217 <0.001
EF (%) -0.091 0.101 0.088 0.084 -0.169 0.013
FS (%) 0.021 0.219 0.019 0.159 0.010 0.321
sseptal (m/s) -0.082 0.128 0.035 0.095 0.182 0.010
E (m/s) 0.053 0.169 0.013 0.186 0.049 0.125
A (m/s) 0.055 0.165 0.012 0.191 0.029 0.156
E/A -0.165 0.019 0.146 0.042 -0.085 0.093
DT (ms) 0.159 0.024 -0.167 0.032 -0.125 0.038
e´septal (m/s) -0.204 0.001 0.198 0.004 0.149 0.032
E/e´septal 0.257 <0.001 0.183 0.009 -0.143 0.035
BP - blood pressure, HbA1c - glycated hemoglobin, HDL - high-density lipoprotein cholesterol, LDL - low-density lipoprotein cholesterol, RWT - relative wall thickness, LA - left atrium, LVM - left ventricle mass, Ht - height, EF - ejection fraction, sseptal - systolic low velocity across the septal segment of mitral annulus obtained by tissue Doppler, E - transmitral low velocity during early diastole obtained by pulse Doppler, A - transmitral low velocity during late diastole obtained by pulse Doppler, e´septal- early diastolic low velocity across the septal segment of mitral annulus obtained by tissue Doppler.
diastolic dysfunction, and subsequently, in LV hypertrophy. Pattoneri et al3 showed that people with recently diagnosed
type 2 diabetes mellitus have abnormal global LV function. There is a dilemma as to whether the levels of glucose and glycated hemoglobin affect the global LV function. Studies have confirmed that this correlation exists3,5,19, which was also
the result of our study. The separate analysis of the influence MS components in our study also showed that fasting glucose levels, in addition to systolic blood pressure and triglycerides levels, were independently associated with the Tei index.
The investigations that assessed individual and simultaneous effects of hypertension and diabetes on global LV function did not agree as to whether these factors synergistically lead to greater LV damage. Cho et al21 showed that the concurrent
effects of these factors changed global LV function more than individual factors separately. Other authors disagree and believe that differences between the individual and the simultaneous effects of these two factors do not exist3,17.
There is no absolute agreement on the impact of obesity on the Tei index. Levent et al4 studied the effect
Table 6 - Stepwise multiple variable regression models of tissue Doppler intervals needed for Tei index calculation for clinical and echocardiographic parameters in metabolic syndrome group
IVRT IVCT ET
β p β p β p
Heart rate (beats/min) 0.022 0.418 0.015 0.289 -0.045 0.212
Systolic BP (mmHg) 0.345 <0.001 0.267 0.009 -0.313 <0.001
Diastolic BP (mmHg) 0.097 0.096 0.183 0.022 -0.067 0.156
Serum creatinine (mg/dl) 0.011 0.355 0.019 0.263 0.021 0.297
Fasting glucose (mg/dl) 0.256 0.010 -0.162 0.027 -0.136 0.089
Triglycerides (mg/dl) 0.082 0.102 0.076 0.142 0.078 0.133
Total cholesterol (mg/dl) 0.061 0.167 0.071 0.148 0.059 0.158
Waist circumference (cm) 0.193 0.035 0.122 0.085 -0.154 0.067
RWT 0.156 0.041 0.089 0.102 0.051 0.172
LA (cm) 0.116 0.071 0.141 0.059 -0.125 0.093
LVM/Ht2.7 (g/m2.7) 0.311 <0.001 0.323 <0.001 0.234 0.007
EF (%) -0.042 0.219 0.081 0.114 -0.184 0.041
sseptal (m/s) -0.076 0.112 0.133 0.068 0.205 0.032
E/A -0.131 0.054 0.129 0.076 -0.092 0.113
DT 0.125 0.061 0.131 0.069 0.139 0.084
e´septal (m/s) -0.244 0.011 0.202 0.012 0.168 0.062 E/e´septal 0.286 <0.001 0.151 0.038 -0.141 0.082
Model r2 0.74 0.68 0.76
BP - blood pressure, RWT - relative wall thickness, LA - left atrium, LVM - left ventricle mass, Ht - height, EF - ejection fraction, sseptal - systolic low velocity across the septal segment of mitral annulus obtained by tissue Doppler, E - transmitral low velocity during early diastole obtained by pulse Doppler, A - transmitral low velocity during late diastole obtained by pulse Doppler, e´septal - early diastolic low velocity across the septal segment of mitral annulus obtained by tissue Doppler.
Table 7 - Correlation coeficients and stepwise multiple variable regression model of Tei index for each component of the metabolic syndrome in metabolic syndrome group
r p β p
Systolic BP (mmHg) 0.526 <0.001 0.337 <0.001
Diastolic BP (mmHg) 0.194 <0.001 0.087 0.134
Fasting glucose
(mg/dl) 0.451 <0.001 0.256 0.008
Triglycerides (mg/dl) 0.327 <0.001 0.178 0.035
HDL (mg/dl) -0.105 0.125 -0.042 0.421
Waist circumference
(cm) 0.225 <0.001 0.112 0.096
Model r2 0.70
BP - blood pressure, HDL - high-density lipoprotein cholesterol.
improving myocardial function through weight reduction22.
There is a controversial study that showed that obesity did not worsen, but improved global LV function23. However,
the authors did not suggest possible mechanisms for this “protective” effect of increased body weight. Our research showed that BMI did not correlate with the Tei index, in contrast with waist circumference, which was an independent
predictor of global LV function. These findings were expected, as there was no significant difference in BMI between the MS and control group, while waist circumference was significantly higher in MS subjects. Voulgari et al19 obtained similar results.
In this study, we showed that the levels of LDL and HDL cholesterol were not correlated with the Tei index, while the levels of total cholesterol and triglycerides correlated with this parameter. Triglycerides levels were not independently associated with the Tei index when all clinical and echocardiographic parameters were considered. However, when only MS criteria were considered, triglycerides were independently associated with this index, which is consistent with the findings of other authors5,19. Fuentes et
al24 were the first to show that subjects with increased levels
of triglycerides had significantly impaired LV diastolic function and increased LV mass, when compared to the control group. This is explained by the fact that the triglycerides accumulated in extracellular space reduce LV compliance, hence their lipotoxic effects on cardiomyocytes and high energy consumption, which is necessary for their metabolism.
Our investigation also showed that renal function estimated by serum creatinine was elevated in MS subjects and correlated with the Tei index which is in agreement with some authors25, but is contradictory to others26. However, serum
The relationship between various echocardiographic parameters and the Tei index was evaluated in patients with hypertension, diabetes or those who had both risk factors2,3,17,
but this assessment had not been previously carried out in subjects with metabolic syndrome. Most authors believe that impaired global LV function in metabolic syndrome is actually a consequence of damaged diastolic function5,6,19, which is
mostly the result of the LV systolic function identification only by the systolic ejection fraction and/or the left ventricular fractional shortening. However, there have been studies that showed that these parameters could also be altered in subjects with MS26. The tissue Doppler imaging introduced new LV
systolic function parameters, which showed its impairment in the MS group27. Our investigation showed that the LV
systolic function estimated by the ejection fraction and sseptal was preserved in the MS group, although with borderline statistical significance.
All the LV diastolic function parameters (E/A, DT, e’septal and E/e’septal) assessed in our study confirmed the existence of diastolic dysfunction. Relative wall thickness and LV mass index, left atrial diameter, E/A ratio, sseptal, e’septal and E/e’ septal
were correlated with global LV function estimated by the Tei index; however the LV mass index, e’septal and E/e’septal were independently associated with the Tei index. Similar results were obtained by Masugata et al2 in patients with hypertension.
Anderson et al17 discovered a correlation of the Tei index and
DT and E/A ratio in patients with hypertension and diabetes, while Pattoneri et al3 found a correlation of IVCT and ET with
this index in patients with recently diagnosed diabetes. Additionally, we studied the impact of different clinical and echocardiographic parameters in the MS group on tissue Doppler intervals needed for the calculation of the Tei index (IVRT, IVCT and ET). Systolic blood pressure, fasting glucose level, waist circumference, relative wall thickness, LV mass index, e’septal and E/e’septal were independently associated
with IVRT. The multivariate analysis showed that systolic and diastolic blood pressure, fasting glucose level, LV mass index, e’septal and E/e’septal were independently associated with IVCT. These parameters simultaneously represent LV systolic and diastolic function in the Tei index equation. On the other hand ET, a parameter of systolic function in this equation, was independently associated with systolic blood pressure, LV mass index, ejection fraction, and sseptal. Apparently, almost the same factors that are associated with IVRT, IVCT and ET in MS correlated with the Tei index as a parameter of global LV function. These findings are important, as we have shown that it is not necessary to determine risk factors for individual components of the Tei index.
As the LV systolic function was preserved in subjects with metabolic syndrome in our research, whereas LV diastolic function was damaged, the logical conclusion is that the
impairment of global LV function is actually the result of altered diastolic function. However, a larger study group would possibly have shown that systolic LV function is also altered in MS subjects, as the statistical value in our research was borderline (p = 0.075).
The limitation of this study was a large number of MS subjects with arterial hypertension, which was controlled by different medications that could also affect the Tei index and result interpretation.. Another limitation is the fact that a few clinical trials used tissue Doppler imaging to obtain parameters of LV systolic, diastolic and global function; therefore, we could not carry out a full comparison of these parameters. Diagnostic studies demonstrated that the Tei index obtained from the pulsed and the tissue Doppler has very similar values and although it has been proven that the values estimated by the tissue Doppler are more precise and more correlated with invasive measurements obtained during cardiac catheterization, the comparison is quite reasonable28.
The third limitation concerned the preload dependence of the Tei index29.
Conclusion
Metabolic syndrome leads to subclinical cardiac damage, reducing the global LV function. The Tei index is a relatively simple way to estimate global LV function and therefore, a valuable parameter in everyday clinical practice. Multiple regression analysis of clinical parameters showed that systolic blood pressure, fasting glucose, LV mass index, E/e’septal, and
e’septal were independently associated with LV global function estimated by the Tei index. We have also shown that almost the same factors which are associated with IVRT, IVCT and ET in MS group are also associated with the Tei index. The impaired LV diastolic function is the main reason for deterioration of the global LV function in MS, according to our research. Additionally we showed that, among the components of MS, only systolic blood pressure, fasting glucose and triglycerides levels were independently associated with LV global function.
Potential Conflict of Interest
No potential conflict of interest relevant to this article was reported.
Sources of Funding
There were no external funding sources for this study.
Study Association
References
1. Tei C, Ling LH, Hodge DO, Bailey KR, Oh JK, Rodeheffer RJ, et al. New index of combined systolic and diastolic myocardial performance: a simple and reproducible measure of cardiac function-a study in normals and dilated cardiomyopathy. J Cardiol. 1995;26(6):357-66.
2. Masugata H, Senda S, Goda F, Yamasami A, Okuyama H, Kohno T, et al. Independent determinants of the Tei index in hypertensive patients with preserved left ventricular systolic function. Int Heart J. 2009;50(3):331-40.
3. Pattoneri P, Sozzi FB, Catellani E, Piazza A, Iotti R, Michelini M, et al. Myocardial involvement during the early course of type 2 diabetes mellitus: usefulness of myocardial performance index. Cardiovasc Ultrasound. 2008;6:27-33.
4. Levent E, Gökşen D, Ozyürek AR, Darcan S, Coker M. Usefulness of the myocardial performance index (MPI) for assessing ventricular function in obese pediatric patients. Turk J Pediatr. 2005;47(1):34-8.
5. Masugata H, Senda S, Goda F, Yoshihara Y, Yoshikawa K, Fujita N, et al. Left ventricular diastolic dysfunction as assessed by echocardiography in metabolic syndrome. Hypertens Res. 2006;29(11):897-903.
6. Turhan H, Yasar AS, Yagmur J, Kurtoglu E, Yetkin E. The impact of metabolic syndrome on left ventricular function: evaluated by using the index of myocardial performance. Int J Cardiol. 2009;132(3):382-6.
7. Mishra RK, Kizer JR, Palmieri V, Roman MJ, Galloway JM, Fabsitz RR, et al. Utility of the myocardial performance index in a population with high prevalences of obesity, diabetes, and hypertension: the Strong Heart Study. Echocardiography. 2007;24(4):340-7.
8. Executive Summary of the Third Report of the National Cholesterol Education Program (NCEP) Expert Panel on detection, evaluation, and treatment of high blood cholesterol in adults (Adult Treatment Panel III). JAMA. 2001;285(19):2486-97.
9. WHO Guideline Development Committee. Definition and diagnosis of diabetes mellitus and intermediate hyperglicaemia. Report of a WHO/IDF Consultation, Geneve; 2006.
10. Mancia G, De Backer G, Dominiczak A, Cifkova R, Fagard R, Germano G, et al. 2007 Guidelines for the Management of Arterial Hypertension: The Task Force for the Management of Arterial Hypertension of the European Society of Hypertension (ESH) and of the European Society of Cardiology (ESC). J Hypertens. 2007;25(6):1105-87.
11. Schiller NB, Shah PM, Crawford M, DeMaria A, Devereux R, Feigenbaum H, et al. Recommendations for quantitation of the left ventricle by two-dimensional echocardiography. American Society of Echocardiography committee on standards, subcommittee on quantitation of two-dimensional echocardiograms. J Am Soc Echocardiogr. 1989;2(5):358-67.
12. Devereux RB, Reichek N. Echocardiographic determination of left ventricular mass in man: anatomic validation of the method. Circulation. 1977;55(4):613-8.
13. de Simone G, Daniels SR, Devereux RB, Meyer RA, Roman MJ, de Divitiis O, et al. Left ventricular mass and body size in normotensive children and adults: assessment of allometric relations and impact of overweight. J Am Coll Cardiol. 1992;20(5):1251-60.
14. Quinones MA, Otto CM, Stoddard M, Waggoner A, Zoghbi WA. Recommendations for quantification of Doppler echocardiography: a
report from the Doppler quantification task force of the nomenclature and standards committee of the American Society of Echocardiography. J Am Soc Echocardiogr. 2002;15(2):167-84.
15. Keser N, Yildiz S, Kurtoglu N, Dindar I. Modified TEI index: a promising parameter in essential hypertension? Echocardiography. 2005;22(4):296-304.
16. Spencer K, Kirkpatrick J, Mor-Avi V, Decara J, Lang R. Age dependency of the Tei index of myocardial performance. J Am Soc Echocardiogr. 2004;17(4):350-2.
17. Andersen NH, Poulsen SH, Helleberg K, Ivarsen P, Knudsen ST, Mogensen CE. Impact of essential hypertension and diabetes mellitus on left ventricular systolic and diastolic performance. Eur J Echocardiogr. 2003;4(4):306-12.
18. Berk BC, Fujiwara K, Lehoux S. ECM remodelling in hypertensive heart disease. J Clin Invest. 2007;117(3):568-75.
19. Voulgari C, Moyssakis I, Papazafiropoulou A, Perrea D, Kyriaki D, Katsilambros N, et al. The impact of metabolic syndrome on left ventricular myocardial performance. Diabetes Metab Res Rev. 2010;26(2):121-7.
20. Marwick T. Diastolic disturbances in diabetes mellitus. In: Smiseth OA, Tendera M. (eds.). Diastolic heart failure. London: Springer-Verlag; 2008. p. 271-84.
21. Cho KI, Park JH, Lee CK, Kim SH, Ahan JM, Kim S, et al. Isolated and combined influences of diabetes and hypertension on the myocardial function and geometry. Korean Circ J. 2006;36(6):411-7.
22. Dayi SU, Kasikcioglu H, Uslu N, Tartan Z, Uyarel H, Terzi S, et al. Influence of weight loss on myocardial performance index. Heart and Vessels. 2006;21(2):84-8.
23. Valocik G, Mitro P, Zapachova J, Majercak I, Mudrakova K. Relation of various degrees of body mass index to systolic and diastolic dysfunctions. Bratisl Lek Listy. 2008;109(2):52-6.
24. de las Fuentes L, Waggoner AD, Brown AL, Dávila-Román VG. Plasma triglyceride level is an independent predictor of altered left ventricular relaxation. J Am Soc Echocardiogr. 2005;18(12):1285-91.
25. de Simone G, Devereux RB, Chinali M, Roman MJ, Lee ET, Resnick HE, et al. Metabolic syndrome and left ventricular hypertrophy in the prediction of cardiovascular events: the Strong Heart Study. Nutr Metab Cardiovasc Dis. 2009;19(2):98-104.
26. Chinali M, Devereux RB, Howard BV, Roman MJ, Bella JN, Liu JE, et al. Comparison of cardiac structure and function in American Indians with and without the metabolic syndrome (the Strong Heart Study). Am J Cardiol. 2004;93(1):40-4.
27. de las Fuentes L, Brown A, Mathews S, Waggoner A, Soto P, Gropler R, et al. Metabolic syndrome is associated with abnormal left ventricular diastolic function independent of left ventricular mass. Eur Heart J. 2007,28(5):553-9.
28. Su HM, Lin TH, Voon WC, Lee KT, Chu CS, Yen HW, et al. Correlation of Tei index obtained from tissue Doppler echocardiography with invasive measurements of left ventricular performance. Echocardiography. 2007;24(3):252-7.