, v.60, n.2, p.253-258, Abr./Jun. 2003
TILLERING DOES NOT INTERFERE ON WHITE
OAT GRAIN YIELD RESPONSE TO PLANT DENSITY
Milton Luiz de Almeida1,3*; Luís Sangoi1,3; Márcio Ender1; Anderson Fernando Wamser2,3
1
UDESC/CAV - Depto. de Fitotecnia, C.P. 281 - 88520-000 - Lages, SC - Brasil. 2
UFRGS/FA - Depto. de Plantas de Lavoura - C.P. 776 - 91501-970 - Porto Alegre, RS - Brasil. 3
CNPq scholar.
*Corresponding author <[email protected]>
ABSTRACT: Plant density is one of the cropping practices that has the largest impact on individual plant
growth. This work was conducted to evaluate the response of white oat (Avena sativa) cultivars with contrasting
tillering patterns to variations in plant density. Two field experiments were carried out in Lages, SC, Brazil, during the 1998 and 1999 growing seasons. A split plot experimental design was used. Four oat cultivars were tested in the main plots: UFRGS 14, UFRGS 18, UPF 16 and UPF 17 using five plant densities split
plots: 50, 185, 320, 455 and 550 plants m-2
. Five plant samples were taken 25, 34, 48, 58 and 70 days after plant emergence to assess the treatment effects on dry matter partition between main stem and tillers. UFRGS 18 promoted dry matter allocation to tillers whereas UPF 17 directed dry mass mostly to the main stem. Differences in dry mass allocation between the main stem and tillers had no impact on grain yield, UPF 16 presenting the highest values for both growing seasons. The lack of interaction between population density and cultivar and the small effect of plant population on grain yield indicates that the oat tillering ability is not fundamental to define its grain yield.
Key words: dry mass accumulation, yield components, cultivars
O AFILHAMENTO NÃO INTERFERE NA RESPOSTA DO
RENDIMENTO DE GRÃOS DE AVEIA À DENSIDADE DE PLANTAS
RESUMO: A densidade é uma das práticas de manejo que mais afeta o crescimento individual das plantas.
Este trabalho foi conduzido objetivando avaliar a resposta de cultivares de aveia branca (Avena sativa) com
diferentes padrões de afilhamento à densidade de plantas. Foram conduzidos dois experimentos em Lages, SC, nos anos de 1998 e 1999. Utilizou-se o delineamento experimental de parcelas subdivididas. Na parcela principal alocou-se quatro cultivares: UFRGS 14, UFRGS 18, UPF 16 e UPF 17. Nas subparcelas
testaram-se cinco densidades de plantas (50, 185, 320, 455 e 590 planta m-2
). Em 1998 efetuaram-se amostragens de plantas até 70 dias após a emergência para analisar o acúmulo de massa seca no colmo principal (CP) e afilhos. O cultivar UFRGS 18 alocou mais massa seca aos afilhos enquanto que a UPF 17 concentrou mais fitomassa no colmo principal 70 dias após a emergência. As diferenças na partição de assimilados entre CP e afilhos não se manifestaram no rendimento de grãos, sendo o cultivar UPF 16 mais produtivo nos dois anos agrícolas. A ausência de interação entre densidade e cultivares e o pequeno efeito da densidade sobre o rendimento de grãos indicam que o afilhamento não é uma característica fundamental à definição da produtividade da aveia branca.
Palavras-chave: acúmulo de massa seca, componentes do rendimento, cultivar
INTRODUCTION
Plant density is one of the management practices that affects the most individual plant growth and its in-teractions in the community (Loomis & Connor, 1992). The ideal number of individuals per unit area must al-low maximum yield, without the risk of lack or excess of plants that would hamper grain yield (Mundstock, 1999).
Plant density recommended for oat cropping in the south of Brazil ranges from 200 to 300 viable seeds per square meter (Comissão Brasileira de Pesquisa de Aveia, 2000). This recommendation does not take into
, v.60, n.2, p.253-258, Abr./Jun. 2003
The influence of density on agronomic charac-ters, associated with the release of cultivars with greater yield potential, reassures the relevance of this subject as a priority research focus. This is particularly impor-tant for oat cropping, where breeding programs have put great effort into developing more productive cultivars, capable of better exploiting the available environment (Thomé et al., 2001). This breeding effort may have changed traits such as plant height, dry mass accumu-lation, leaf area and tillering potential in the new culti-vars, possibly interfering with their response to plant density.
The ability to emit fertile tillers is one of the traits that have the greatest impact on the ideal oat plant den-sity. The utilization of high population densities can de-crease tillering potential as a result of excessive compe-tition between stalks. On the other hand, the utilization of low densities could be an alternative to explore the tillering ability of the cultivars. In this case, there is a greater possibility that all main stems are productive and, under good environmental conditions, the tillers can also produce panicles. Besides emission, tiller survival is an-other trait that has been overlooked in determining den-sity in oat cropping. Tillers are only productive when their developmental rate is similar to the main stem develop-ment rate (Almeida & Mundstock, 2001). The increase in competition between plants for environmental factors accelerates the main stem development, in detriment to tillers (Almeida & Mundstock, 2001).
Another aspect that has not been considered to determinate ideal density of oat plants is dry mass yield in the period that precedes flowering. This yield repre-sents the potential that the community has to invest in grain formation, as long as its harvest index is taken into account. Individuals with greater plant mass can present a large photosynthetic area for carbohydrate production, as well as large panicles, and heavier grains (Boukerrou & Rasmusson, 1990).
This work was conducted with the objectives of assessing grain yield response to population increase in oat cultivars, identifying the ideal plant density and veri-fying whether yield response to density is related to dry mass accumulation in stems and tillers in the beginning of the crop cycle.
MATERIAL AND METHODS
The experiments were carried out during 1998 and 1999, in Lages, SC, Brazil. This city is located in the southern plain of the State of Santa Catarina, 27º52’30’’ S and 50º18’20’’ W, at a mean altitude of 930 m, presenting climatic conditions that are favorable for oat growth and development (EPAGRI, 2001). The soil of the experimental area was classified a Dystrupept.
The experimental design was set up as completely randomized blocks arranged in split-plots, with four rep-licates. Four white oat cultivars (UPF 16, UPF 17, UFRGS 14 and UFRGS 18) were allocated to main plots. Five plant densities (50, 185, 320, 455, and 590 plants m-2) were tested in the split-plots. In the first year, plants were sampled in five different seasons, which were con-sidered as split-split-plots. Cultivars were chosen based on visual observations of cultivars assessed in the Bra-zilian Assay of Recommended Oat Cultivars (Ensaio Brasileiro de Cultivares Recomendadas de Aveia), which took place in Lages, in previous years. Cultivars were chosen based on their contrasting tillering ability. Culti-var UFRGS 18 was selected by its great number of tillers, UPF 17 by its low tillering capacity, and cultivars UPF 16 and UPF 14 because of the in intermediate tillering ability.
Soil tillage followed conventional procedures, with one plowing and two harrowings to level the soil. Mainte-nance fertilization was performed in the sowing furrow, and the fertilizer was incorporated before seed deposition. Fer-tilization was performed according to soil analysis, follow-ing technical recommendations for oat croppfollow-ing (Comissão Brasileira de Pesquisa de Aveia, 2000).
Sowing was carried out on July 14, 1998 and on July 15, 1999. The amount of seeds was determined ac-cording to the desired density for each treatment and re-sults of the germination test previously made for each cul-tivar. The spacing between rows was 0.20 m and the sow-ing depth was 0.05 m. Nitrogen was sidedressed at stage 3.1 in the Haun (1973) scale, at a rate of 30 kg ha-1
. Weeds, diseases and pests were controlled a way to not interfere with crop development. The experiments were conducted under natural precipitation conditions.
During the first year of experiment, each split-plot consisted of 10 rows, five meters in length. In the sec-ond year, each split-plot consisted of six rows, five meters in length. The usable area in the split-plots was 3.2 m2, comprising rows number 2, 3, 4, and 5, discarding 0.5 m at the end of each row. Rows numbered 7, 8, and 9 were utilized to collect plants in 1998. Five samples were taken 25, 34, 48, 58, and 70 days after emergence of each cul-tivar, to determine the pattern of accumulation of dry mather (DM) in the main stem (MS) and in the tillers (T). One linear meter was sampled in each collection, leav-ing 20 cm as a border crop between adjacent collections taken from the same row. The DM of MS and T were de-termined for each sampling season.
, v.60, n.2, p.253-258, Abr./Jun. 2003
Data were submitted to analysis of variance, and when statistic significance was attained, cultivar means were compared by the Duncan test (P = 0.05). A poly-nomial regression analysis was performed for plant den-sity and DM sampling season, and the equation which best fitted the original data was selected.
RESULTS AND DISCUSSION
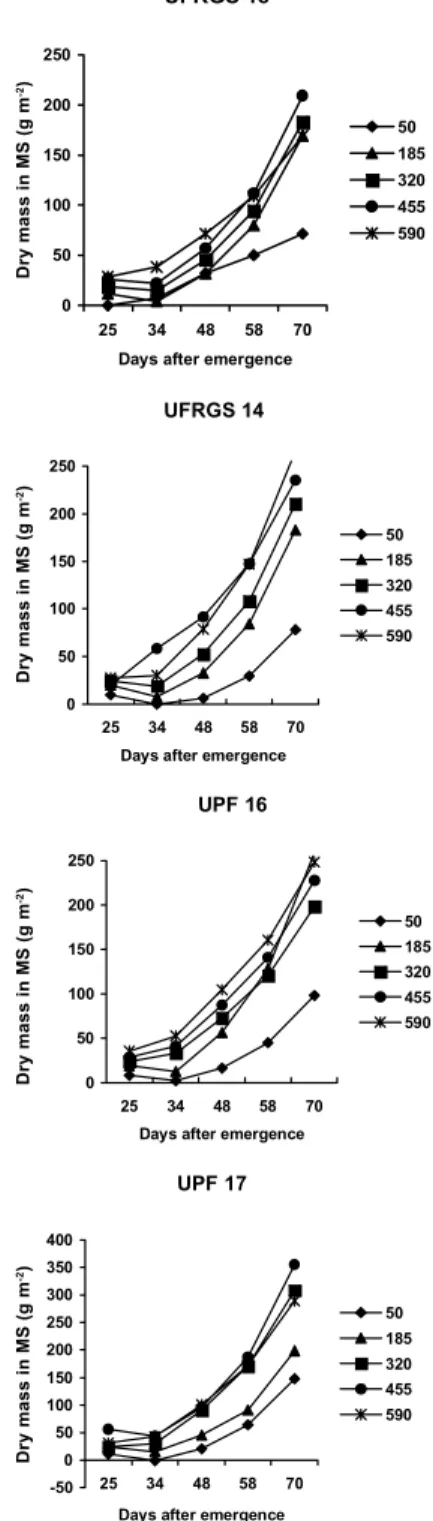
Confirming differences previously observed that motivated the choice of genotypes utilized in this work, the cultivars showed a distinct pattern of DM accumula-tion in the MS and in T during 1998 (Figures 1 and 2). The increase in DM of MS and T varied in relation to cultivar and density (Figures 1 and 2). Cultivar UFRGS 18 allocated more DM to T 70 days after emergence, at the lowest sowing densities (Figure 2). Cultivar UPF 17 concentrated the allocation of DM to MS in detriment to T (Figures 1 and 2).
The differences in DM accumulation pattern of MS and T for the different cultivars, as the population increased, did not reflect on grain yield, which was not affected by the interaction between cultivars and densi-ties for the two growing seasons too. In 1998, only a single effect of cultivar was observed, while in 1999 the effects of cultivar and density individually interfered with productivity (P < 0.05). Cultivar UPF 16 was the most productive in both cropping seasons, presenting yields higher than 3,000 kg ha-1 (Table 1). On the other hand, the smallest nominal values of grain yield were recorded for cultivar UFRGS 18, which allocated a smaller amount of DM to the MS and a greater amount to T (Table 1 and Figures 1 and 2).
Plant density quadratically increased cultivar grain yield in 1999 (Figure 3). The optimal density to maximize grain yield was 404 plants m-2
. This value is higher than the presently recommended density of 200 to 300 plants m-2 for Brazil (Comissão Brasileira de Pesquisa de Aveia, 2000). However, when the obtained values are analyzed, the productivities recorded for the population range com-prised between 185 and 590 plants m-2 were very similar.
r a v i t l u
C Grainyield 8
9 9
1 1999 a
h g k
-- -1------------
-6 1 F P
U 3093a 3241a 4
1 S G R F
U 3026ab 2347b 7
1 F P
U 2523b 2535b 8
1 S G R F
U 2511b 2110b N
A E
M 2788 2559 )
% ( V
C 11.4 12.9
Table 1- Grain yield of four white oat cultivars, mean of five plant densities for the 1998 and 1999 cropping seasons.
The absence of significant interaction between density and cultivar, and the moderate effect of density on grain yield in a wide range of plant populations, show that the distinct tillering patterns for cultivars in the beginning of the cycle were not essential to define their final yield. This provides evidence that the evaluated genotypes had adjustment mechanisms for yield components available during the reproductive stage, and that exerted greater in-fluence on grain yield than the differences recorded dur-ing initial growth.
Figure 1- Dry mass of the main stem (MS) of four white oat cultivars at five plant densities as a function of five sampling seasons, 1998.
UFRGS 18
0 50 100 150 200 250
25 34 48 58 70 Days after emergence
50 185 320 455 590
UFRGS 14
0 50 100 150 200 250
25 34 48 58 70 Days after emergence
50 185 320 455 590
UPF 16
0 50 100 150 200 250
25 34 48 58 70 Days after emergence
50 185 320 455 590
UPF 17
-50 0 50 100 150 200 250 300 350 400
25 34 48 58 70 Days after emergence
50 185 320 455 590
Dry mass in MS (g m
-2)
Dry mass in MS (g m
-2)
Dry mass in MS (g m
-2)
Dry mass in MS (g m
, v.60, n.2, p.253-258, Abr./Jun. 2003
The increase in density induced reductions in the number of panicles produced per plant and in the num-ber of grains present in each harvested panicle (Figures 4 and 5). The reduction rates for these yield components varied with cultivar in 1998, while in 1999 there was no interaction between cultivar and density. The oppo-site behavior was detected for the number of panicles harvested per area, which increased with the increase in density. The increase was quadratic and similar among cultivars in the first cropping season, and linear but dif-ferentiated between genotypes in the second season (Figure 6).
The mass of 1,000 grains present greater varia-tions; depending rather on cultivar and density than the other yield components. In 1998 the mass of 1,000 grains for cultivar UPF 16 decreased with the increase in den-sity (Figure 7). In 1999, however, there was a reduction in grain mass for cultivar UFRGS 14 and an increase for cultivar UPF 17 with the increase in density. The small-est values for mass of 1,000 grains were recorded for cul-tivar UFRGS 18, especially in the 1999 cropping season. The grain yield response to increases in plant den-sity depends on morphological, physiological, and allo-metric mechanisms of compensation of spaces and on their reflexes over the differentiation and development of reproductive structures in crops (Sangoi, 2001). Species
Figure 3 - Grain yield at five plant densities, mean of four white oat cultivars, 1999.
1800 2000 2200 2400 2600 2800 3000
50 185 320 455 590
Plant density (pl m-2)
y = 1928 + 4.28x – 0.053x2 r2 = 0.58
Figure 2 - Dry mass accumulated by tillers (T) of four white oat cultivars at five plant densities as a function of five sampling seasons, 1998.
UFRGS 18
0 30 60 90 120
25 34 48 58 70 Days after emergence
50 185 320 455 590
UFRGS 14
0 30 60 90 120
25 34 48 58 70 Days after emergence
50 185 320 455 590
UPF 16
0 30 60 90 120
25 34 48 58 70 Days after emergence
50 185 320 455 590
UPF 17
0 30 60 90 120
25 34 48 58 70 Days after emergence
50 185 320 455 590
Dry mass in T (g m
-2)
Dry mass in T (g m
-2)
Dry mass in T (g m
-2)
Dry mass in T (g m
-2)
Grain yield (kg ha
-1)
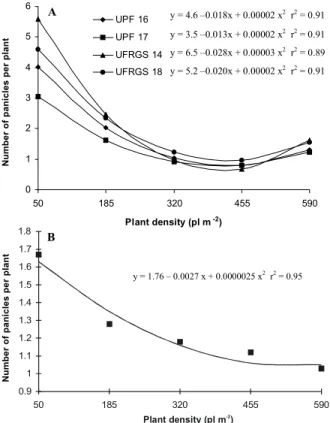
Figure 4 - Number of panicles per plant of white oat cultivars for five plant densities in 1998 (a) and 1999 (b).
0.9 1 1.1 1.2 1.3 1.4 1.5 1.6 1.7 1.8
50 185 320 455 590
Plant density (pl m )-2
y = 1.76 – 0.0027 x + 0.0000025 x2
r2
= 0.95
B
0 1 2 3 4 5 6
50 185 320 455 590
Plant density (pl m-2)
UPF 16
UPF 17
UFRGS 14
UFRGS 18
y = 4.6 –0.018x + 0.00002 x2 r2 = 0.91 y = 3.5 –0.013x + 0.00002 x2 r2 = 0.91 y = 6.5 –0.028x + 0.00003 x2 r2 = 0.89 y = 5.2 –0.020x + 0.00002 x2 r2 = 0.91
A
Number of panicles per plant
, v.60, n.2, p.253-258, Abr./Jun. 2003
such as oat and soybean show great space compensa-tion capacity when grown at low populacompensa-tions, incresing tiller production and plant ramification, respectively.
This plasticity is translated into a greater dilution of re-productive meristems, reducing apical dominance and favoring compensation between yield components (Vega et al., 2001).
This type of adjustment did occur in the present work. At a density of 50 plants m-2 the number of panicles produced per plant ranged between 1.5 and 5.0, depend-ing on the cultivar and the croppdepend-ing season (Figure 4). On the other hand, the utilization of densities higher than 320 plants m-2 limited the production of panicles per plant to 1.0, regardless of the cultivar’s genetic aptitude for tiller emission. The increase in competition for environ-mental resources in the reproductive stage, as a conse-quence of greater densities, eliminated any gain that the greater production of tillers in cultivar UFRGS 18 could provide to grain yield, since these tillers were not capable of producing panicles (Figures 2 and 5). The effects of increaseing plant density on grain yield and number of panicles produced per oat plant show that species that belong to the same family could display different re-sponses to variation in intraspecific competition. In maize, Tollenaar et al. (1994) and Sangoi (2001) reported in-creases in productivity as population density increased, as a result of genotype abilities to adapt to denser stands without drastically reducing the number of ears produced per plant.
Figure 5 - Number of grains per plant of white oat cultivars for five plant densities in 1998 (a) and 1999 (b).
10 20 30 40 50 60 70 80 90
50 185 320 455 590
Plant density (pl m-2)
UPF 16
UPF 17
UFRGS 14
UFRGS 18
y = 94.9 –0.25x + 0.00024x2
r2
= 0.93
y = 80.9 –0.19x + 0.00016x2
r2
= 0.99
y = 43.4 –0.041x r2
= 0.83
y = 53.2 –0.15x + 0.00017x2
r2
= 0.92
0 10 20 30 40 50 60 70
50 185 320 455 590
Plant density (pl m-2)
y = 69.7 –0.25x + 0.00026x2
r2
= 0.97
A
B
Number of grains per plant
Number of grains per plant
Figure 7 - Mass of one thousand grains of white oat cultivars for five plant densities in 1998 (a) and 1999 (b).
25 27 29 31 33 35 37 39 41 43 45
50 185 320 455 590
UPF 16
UPF 17
UFRGS 14
UFRGS 18
y = 42.6- 0.043x + 0.000055x2 r2 = 0.93 A
35 37 39 41 43 45 47 49 51
50 185 320 455 590
Plant density (pl m-2)
UPF 16 UPF 17 UFRGS 14 UFRGS 18
y = 46.4 + 0.0053 r2 = 0.80
y = 47.3 - 0.0051 x r2 = 0.73
B
Mass of thousand grains (g)
Mass of thousand grains (g)
Plant density (pl m-2)
Figure 6 - Number of panicles per square meter of white oat cultivars for five plant densities in 1998 (a) and 1999 (b).
0 100 200 300 400 500 600 700
50 185 320 455 590
UPF 16 UPF 17 UFRGS 14 UFRGS 18
y = 65.6 + 0.94 x r2 = 0.99
y = 46.6 + 0.93 x r2 = 0.98
y = 38.8 + 1.12 x r2 = 0.95
y = 54.6 + 0.91 x r2 = 0.99 B
0 100 200 300 400 500 600 700
50 185 320 455 590
2
y = 192.6 +0.18x + 0.00082x2 r2 = 0.99
A
Plant density (pl m-2)
Plant density (pl m-2)
Number of panicles per square meter
, v.60, n.2, p.253-258, Abr./Jun. 2003
Received April 02, 2002 Grain yield in oat is a sequential process where
the number of panicles produced per plant is defined firstly, followed by the number of grains fertilized per in-florescence and by the dry mass of grains produced per panicle. When the behavior of yield components shown in Figures 4-7 is analyzed and correlated with yields re-corded for the cultivars (Table 1), the most important components that define final yield can be identified. When the most productive cultivar in both cropping sea-sons (UPF 16) is compared to the cultivar that had the lowest yield (UFRGS 18), the highest productivity val-ues in the first were associated to the greater number of grains produced per plant in 1998 (Figure 5a) and with the greater number of panicles produced per unit area in 1999 (Figure 6b). Therefore, in both years, cultivar UPF 16 yielded greater number of grains per hectare, corrobo-rating ponderations made by Andrade et al. (2000), that this is the yield component that determines the final per-formance of most crop plants.
Greater tillering capacity is an important trait of compensation of spaces by several grasses under low sowing density, contributing to a better utilization of en-vironmental resources and to increased grain yield (Gardner et al., 1985). The behavior of tiller dry mass, grain yield and components of oat cultivars tested in 1998 show that this compensatory mechanism was not effec-tive in the present work. In general, cultivar UFRGS 18 allocated more dry mass to tillers than cultivar UPF 16, in the five densities tested (Figure 2). However, this fact did not assure greater productivity, since grain yield for UPF 16 was 23% higher than for UFRGS 18 in that year. This occurred because the differences in number of panicles produced per plant between the two cultivars were small (Figure 4), showing that the greater concen-tration of dry mass in tillers did not translate into greater effective tillering. On the other hand, UPF 16 expressed greater grain yield ability per plant, which was decisive for its productive superiority.
The low grain yield response of cultivars to in-creases in density shows that it is necessary to look for ways of increasing crop tolerance to intraspecific com-petition at the end of the cycle, when a reduction in yield per plant can be compensated by a greater number of plants present in the area. The genetic differences in tillering ability were not important in defining the pro-ductive potential of the tested materials, regardless of the population. The utilization of stands greater than those presently recommended (200 to 300 plants m-2
) caused all cultivars to yield approximately one panicle per plant. Genetic modifications in tillering ability is probably not the best strategy to obtain greater productivities of this crop.
CONCLUSIONS
No differential response can be obtained in grain yield of oat cultivars by increasing plant density. Tillering potential is not an essential trait for defining productiv-ity in white oat.
REFERENCES
ALMEIDA, M.L. de; MUNDSTOCK, C.M. A qualidade de luz afeta o afilhamento em plantas de trigo, quando cultivadas sob competição.
Ciência Rural, v.31, p.401-408, 2001.
ANDRADE, F.H.; CIRILO, A.; ECHARTE, L. Factors affecting kernel number in maize. In: OTEGUI, M.; SLAFFER, G.A. (Ed.) Physiological
bases for maize improvement. New York: Haworth Press, 2000. cap.5,
p.59-71.
BOUKERROU, L.; RASMUSSON, D.C. Breeding for high biomass yield in spring barley. Crop Science, v.30, p.31-35, 1990.
COMISSÃO BRASILEIRA DE PESQUISA DE AVEIA. Recomendações
técnicas para a cultura da aveia. Porto Alegre: UFRGS, 2000. 69p.
EMPRESA CATARINENSE DE PEQUISA AGROPECUÁRIA. Avaliação de cultivares para o estado de Santa Catarina 2001/2002.
Florianópolis: EPAGRI, 2001. 149p. (Boletim Técnico, 117) GARDNER, F.P.; PEARCE, R.B.; MITCHELL, R.L. Physiology of crop
plants. Ames: Iowa State University, 1985. 327p.
HAUN, J.R. Visual quantification of wheat development. Agronomy
Journal, v.65, p.116-119, 1973.
HORN, L.F.; SCHUCH, L.O.B.; SILVEIRA, E.P.; ANTUNES, I.F.; VIEIRA, J.C. MARCHIORO, G.; MEDEIROS, D.F.; SCHWENGBER, J.E. Avaliação de espaçamentos e populações de plantas de feijão visando à colheita mecanizada direta. Pesquisa Agropecuária Brasileira, v.35, p.41-46, 2000.
LOOMIS, R.S.; CONNOR, D.J. Crop Ecology: productivity and management in agricultural systems. New York: Cambridge University Press, 1992. 538 p.
MUNDSTOCK, C.M. Planejamento e manejo integrado da lavoura de
trigo. Porto Alegre: UFRGS, 1999. 228p.
SANGOI, L. Understanding plant density effects on maize growth and development: an important issue to maximize grain yield. Ciência Rural, v.31, p.159-168, 2001.
SILVA, P.R.F. da; ALMEIDA, M.L. de. Resposta de girassol à densidade em duas épocas de semeadura e dois níveis de adubação: II Características de planta associadas à colheita. Pesquisa Agropecuária Brasileira, v.29, p.1365-1371, 1994.
TOLLENAAR, M.; McCULLOUGH, D.E.; DWYER, L.M.P. Physiological basis of the genetic improvement of corn. In: SLAFER, G.A. Genetic
improvement of field crops. New York: Marcel Dekker, 1994. chap.4,
p.183-236.
THOMÉ, G.C.H.; MILACH, S.C.K.; FEDERIZZI, L.C. Resistência parcial à ferrugem da folha em genótipos de aveia. Pesquisa Agropecuária
Brasileira, v.36, p.393-398, 2001.