DOI: http://dx.doi.org/10.5007/1980-0037.2012v14n4p377
original article
RBCDH
Licence Creative Commom
CC
1 Pontifícia Universidade Católica do Paraná. School of Health and Biosciences. Curso de Educação Física. Curitiba, PR. Brasil. 2 Pontifícia Universidade Católica do Paraná. Grupo de Pesquisa em Atividade Física e Qualidade de Vida. Curitiba, PR. Brasil. 3 Universidade Federal do Paraná. Programa de Pós-Graduação em Educação Física. Curitiba, PR. Brasil.
Received: 26 December 2011 Accepted: 01 February 2012
Individual and environmental factors
associated with park and plaza use in
adults from Curitiba, Brazil.
Fatores individuais e ambientais associados ao uso de
parques e praças por adultos de Curitiba-PR, Brasil.
Rogério César Fermino1,2,3
Rodrigo Siqueira Reis1,2,3
Ana Carina Cassou3
Abstract– he aim of this study was to identify individual and environmental factors associated with park and plaza use in adults from Curitiba, state of Paraná, Brazil. A cross-sectional study was conducted in 2008 with 749 participants (59.9% men) selected in areas for physical activity (PA) in four parks and four plazas. Poisson regression was used to examine the associations of sociodemographic (sex, age, education) and health (body mass index, perceived health) variables, company for park/plaza use, access (percep-tion of distance, access and commuting to the places), and leisure time PA (walking and moderate/vigorous PA - MVPA) with frequent use of parks and plazas (≥1 time/wk). he percentage of park and plaza use was 68%, and company (PR: 0.74; CI95%: 0.62-0.89) and higher levels of walking (PR: 1.30; CI95%: 1.03-1.64) and MVPA (PR: 1.39, CI95%: 1.07-1.80) were associated with the use of the places. hese results can be used to guide interventions aimed at providing services and facilities for PA practice in parks and plazas.
Key words: Green areas; Motor activity. Epidemiological studies; Health promotion.
INTRODUCTION
Regular physical activity (PA) may reduce the risk of non-communicable chronic diseases and increase population’s physical itness and quality of life1,2. Due to this fact, there is an increasing concern with the
develop-ment of strategies for encouraging an active lifestyle in the community3.
he most efective interventions to promote PA are those that act on several levels to change psychological, social, political and environ-mental variables3,4; among those, the last two are the most promising5.
Environmental characteristics like the presence of and access to high quality recreational areas in the neighborhood, such as parks and plazas, can facilitate PA3,6.
In this sense, parks are considered adequate and valued places for lei-sure and PA practices7,8. Additionally, their use is associated with a better
physical, psychological and social well-being, as well as higher PA levels among their users6,8. In Brazil, the proximity and diversity of recreational
facilities in the neighborhood are associated with population’s PA prac-tice9-11. herefore, it is important to invest in and provide facilities in parks
to promote PA at the community level12.
In the United States, around 50% of the population use parks on a weekly basis and 1/3 regularly exercise in these places13,14. Individual (sex
and age) and environmental factors (proximity to residence, esthetics, and safety) are associated with PA in parks8,15. he few studies on park
use in Brazil are limited to intentionally selected places in few cities, which hampers the extrapolation of the results. In general, these places are used by male and physically active adults and factors such as friends’ support, location, esthetics, and the facilities provided stimulate PA in parks7,16-18.
Curitiba is internationally recognized by adopting urban planning strategies that give priority to the construction of and access to recrea-tional spaces such as parks, plazas, walking trails, and bicycle paths19,20.
Among the facilities available, parks and plazas are the most used21.
Plazas difer from parks due to their central location, smaller total area
and a higher number of areas for PA22. Some characteristics may explain
the greater use of these places by men, besides the diferences in the
pat-tern of the PA performed in the places22. For example, the greater use by
men can be explained by the availability of areas for structured sports (≥51%); similarly, the practice of walking in parks can be explained by the higher availability of trails when both places are compared (parks:
13% vs. plazas: 6%)22.
Although there is no evidence on individual and environmental factors
METHODS
Curitiba, the capital of Paraná state, is located in the southern region of Brazil, has a population of 1,746,896 inhabitants (52.3% women), and is the 8th most populated city in the country (100% urban). Currently, 17 urban
forests, 22 parks, 16 recreational axes (linear parks) (eixos de animação), 31 environmental preservation areas, 454 plazas, and 114 km of bicycle paths are dispersed in the 75 neighborhoods and help the city to reach the index of 64.5 m2 of green area per inhabitant, one of the highest in the
country. In addition, 29 sports and recreational centers ofer structured activities to the community. he interventions in PA and another healthy habits are coordinated by the Municipal Secretary of Sports, Leisure and Youth (MSSLY) and the Municipal Health Secretary (MHS), and part of the actions occurs in some of the abovementioned places19.
Selection of parks and plazas
Despite the high number of parks and plazas, some places are not designed for PA. Places with potential for PA practice were selected in neighbor-hoods with diferent environmental and economical conditions, in order to better represent the population. As a irst step, the 75 neighborhoods were classiied in nine strata based on the socioeconomic status (SES) and on a built and social environment score (ENV) for PA19,22. Neighborhoods
from the four extreme clusters (high ENV and high SES; high ENV and low SES; low ENV and high SES; low ENV and low SES) were selected. he parks and plazas from these neighborhoods were listed, and the list was sent to coordinators from the MSSLY and the MHS, who should indicate a park and a plaza in each neighborhood where there were interventions of their secretaries. Ater three rounds of consulting, four parks and four plazas were selected for evaluation, through the consensus obtained in the consultation.
Participants
Data collection took place in 2008, in two phases with similar climates (March-April and October-November). In the irst stage, interviews were conducted during two weeks, on six days of the week (except Fridays), in three periods of the day (7.00-8.00 a.m., 11.00 a.m.-12.00 p.m., 5.00-6.00 p.m.), with adults who were in the target areas for PA22. Participants were
intentionally selected and interviewers should perform two interviews per period of the day. In case there were no people in the areas, interviewers stayed 30 minutes in the place trying to perform the interview.
Sample size calculation was performed with the equation below, consid-ering a standard error of 3%, α=0.05, and power of 80%23. he proportions
of frequent users included in the equation were those obtained in the irst
study phase (Pa=75.7% and P
0=58.9%).
In which: Zα=1.96; Zβ=1.26; P0=0.59; Pa=0.76
he equation allowed estimating the minimum sample size of 28 individuals to be interviewed in each place. Ten percent were added to compensate for possible losses and 15% to increase the power of the mul-tivariable analyses; thus, 35 individuals were needed in each place. We opted to interview 40 individuals, in order to increase the power of the sample (parks: n=303; P=0.59; RP=1.2; Beta=0.8 / plaza n=446; P=0.74; RP=1.15; Beta=0.8).
As a strategy to guarantee users’ representativeness, 10 subjects were interviewed in the morning and 10 in the aternoon on Saturdays and Sundays, on two consecutive weekends.
Instrument
he instrument was based on a questionnaire translated from the original and adapted to the Brazilian context13. here were questions on the use of
the places, distance from residence, access, company, and reasons for use. Sociodemographic information and questions on leisure time PA were added. Twelve interviewers received theoretical and practical training on selection and inclusion criteria, approach to participants, conduction of the interview, and completion of the forms. he number of people approached and the refusal rate were computed.
Outcome variable
he use of the places was assessed with the question: How oten do you come to this park/plaza? he scale had seven answer choices: “irst time”, “few times/year”, “1 time/month”, “a couple of times/month”, “1-2 times/wk”, “3-4 times/wk”, and “daily”. he last three answer choices were grouped to characterize the variable “frequent use” (≥1 times/wk).
Independent variables
• Sociodemographic variables
Age was divided into three age groups (18-39, 40-59, and ≥60 years), and edu-cation, obtained in a question on personal education level, grouped in three categories (“elementary school”, “high school degree”, and “university degree”).
• Health variables
mass and height, and classiied into “<24.9 kg/m2” and “≥25 kg/m2”24.
Health perception was assessed with the question: “How do you consider
your health?”, having as an answer choice a ive-point Likert scale (“very poor”, “poor”, “good”, “very good”, and “excellent”)25. he answer choices
“poor” and “very poor”, as well as the choices “very good” and “excellent”, were grouped for analysis.
• Company
Company for the use of the places was assessed by a dichotomous answer (yes/no) for the question: “When do you come to this park/plaza, do you usually come with a companion?”.
• Access
he perceived distance from residence to the place was assessed with the question: “What is the distance from your residence to this park/plaza?”, in which individuals could choose between four options (“<500 m”, “500 m-1 km”, “1-2 km”, and “>2 km”). he answers “1-2 km” and “>2 km” were grouped for analysis.
he facility of access to the place was assessed with the question: “How easy is for you to get to this park/plaza?”, which had ive answer choices (“very easy”, “easy”, “diicult”, “very diicult”, and “impossible”).he op-tions “diicult”, “very diicult”, and “impossible” were grouped for analysis. he means of transportation to the place was assessed with the ques-tion: “How do you usually get to the park/plaza?”, and individuals could choose between four answer options (“bus or other public transport”, “car”, “bicycle”, and “walk”). he options “bicycle” and “walk” were grouped to characterize active transportation to the place.
Leisure time physical activity
PA level was assessed with the leisure domain of the International Physi-cal Activity Questionnaire, long version, translated and validated to the Brazilian population26. Individuals reported their weekly frequency and
the time spent walking and engaging in moderate and vigorous activities on a typical week. Moderate/vigorous PA (MVPA) was computed adding the minutes of walking, moderate PA and vigorous PA (*2) per week19. he
engagement in walking and MVPA was assessed on three levels: “0 min/wk, “1-149 min/wk” and “≥150 min/wk”1. It is believed that diferent PA patterns
may be associated with the use of the places. For example, parks have a higher number of walking trails, while the number of areas for structured sports like soccer, basketball, and volleyball is higher in plazas. herefore, we chose to analyze the engagement in walking and MVPA independently.
Statistical analysis
compared with the chi-square test (c2) for heterogeneity and linear trend.
he association between the independent variables and the outcome vari-able was tested with Poisson regression. A bivariate analysis was performed and the variables with p<0.20 were selected for adjustment in the multi-variate model as possible confounding factors. he multimulti-variate analysis used a multiple model generated from a hierarchical structure with the following levels and variables: level 1 – sociodemographic variables; level 2 – health variables; level 3 – company; level 4 – access; and level 5 – PA. Analyses were carried out on STATA 11 sotware and the signiicance level was set up at 5%.
he study was approved by the Research Ethics Committee of Pontifícia Universidade Católica do Paraná, process number 1762/08, and the pro-tocols followed the recommendations of the Brazilian System of Research Ethics (Sistema Nacional de Ética em Pesquisa).
RESULTS
A total of 749 individuals (59.9% men) were interviewed and the refusal rate was 9.5%. he majority of participants was aged between 18-39 years, had completed high school, and had normal BMI and positive health perception (table 1). Overall, seven out of 10 participants referred to visit the places on a regular basis. hree and six out of 10 respondents practiced ≥150 min/ wk of walking and MVPA respectively. he population interviewed in the parks showed a higher proportion of men and of people aged 18-39 years, with “very good/excellent” health perception, and who visit the places with a companion (p<0.05). Plaza users reported greater proximity from residence, facility of access, active commuting, and frequent use of places compared with park users (p<0.05).
In the bivariate analysis (table 2), frequent use of parks and plazas was inversely associated with reported distance from residence and facility of access to the places, but showed a positive association with active com-muting and higher levels of leisure time walking and MVPA. Company was inversely associated with frequent park use in the grouped analysis of both places (p<0.05).
Table 1. Characteristics of park and plaza users. Curitiba, Brazil, 2008 (n=749).
Variable Category Parks (n=303) Plazas (n=446)
c2 p Total (n=749)
n % n % n %
Sociodemographic variables
Sex Female 104 34.3 196 43.9 7.0h 0.008 300 41.1
Male 199 65.7 250 56.1 449 59.9
Age (years) 18-39 188 62.3 250 56.2 3.9t 0.048 438 58.6
40-59 86 28.5 185 30.3 221 29.6
≥60 28 9.3 60 13.5 88 11.8
Education level Elementary school 66 21.9 57 12.9 5.3t 0.022 123 16.6
High school degree 127 42.2 213 48.2 340 45.8
University degree 108 35.9 172 38.9 280 37.7
Health variables
BMI (kg/m2) <24.9 175 58.1 282 63.8 2.4
h 0.119 457 61.5
>25.0 126 41.9 160 36.2 286 38.5
Health perception Very good/excellent 158 52.5 175 39.5 12,7t 0.002 333 44.8
Good 130 43.2 249 56.2 379 50.9
Poor/very poor 13 4.3 19 4.3 32 4.3
Company
Visits the place with a companion No 65 21.5 190 42.7 36.2h <0.001 255 34.1
Yes 238 78.5 255 57.3 493 65.9
Access
Distance from residence <1 km 77 26.2 264 59.6 79.3h <0.001 341 46.3
≥1 km 217 73.8 179 40.4 396 53.7
Facility of access Easy/very easy 263 87.7 414 93.0 6.2h 0.013 677 90.9
Diicult/very diicult 37 12.3 31 7.0 68 9.1
Means of transportation Car/bus 186 61.4 130 29.1 76.9h <0.001 316 42.2
Walking/bicycle 117 38.6 316 70.9 433 57.8
Leisure time PA
Walking 0 min/wk 152 50.2 173 38.8 14.5t 0.001 325 43.4
1-149 min/wk 61 20.1 142 31.8 203 27.1
≥150 min/wk 90 29.7 131 29.4 221 29.5
MVPA 0 min/wk 71 23.4 98 22.0 4.9t 0.086 164 22.6
1-149 min/wk 38 12.5 83 18.6 121 16.2
≥150 min/wk 194 64.0 265 59.4 459 61.3
Frequency in the places <1 time/wk 125 41.3 114 25.6 20.5h <0.001 239 31.9
≥1 times/wk 178 58.7 332 74.4 510 68.1
Table 2. Bivariate analysis of individual and environment factors associated with frequent use* of parks and plazas. Curitiba, Brazil, 2008 (n=749)
Variables Category Parks (n=303) Plazas (n=446) Total (n=749)
% PR CI95% % PR CI95% % PR CI95%
Sociodemographic variables
Sex Female 55.8 1 76.5 1 67.3 1
Male 60.3 1.8 0.79-1.48 72.8 0.95 0.76-1.18 69.3 0.97 0.81-1.16
Age (years) 18-39 54.3 1 71.6 1 64.2 1
40-59 66.3 1.22 0.88-1.69 74.1 1.03 0.81-1.32 71.0 1.11 0.91-1.35 ≥60 67.9 1.25 0.77-2.04 86.7 1.21 0.89-1.65 80.7 1.26 0.97-1.63
Education level Elementary school 53.0 1 75.4 1 63.4 1
High school
degree 55.1 1.04 0.69-1.56 73.7 0.98 0.70-1.37 66.8 1.05 0.81-1.36 University degree 66.7 1.26 0.84-1.88 74.4 0.99 0.70-1.39 71.4 1.12 0.87-1.46
Health variables
BMI (kg/m2) <24.9 60.6 1 74.8 1 69.4 1
≥25.0 55.6 0.92 0.68-1.24 73.8 0.99 0.79-1.24 65.7 0,95 0,79-1,14
Health perception Very
good/excel-lent 66.5 1 76.0 1 71.5 1
Good 50.0 0.75 0.55-1.03 75.1 0.99 0.79-1.23 66.5 0.93 0.78-1.11 Poor/very poor 53.8 0.81 0.38-1.74 47.4 0.62 0.32-1.22 50.0 0.70 0.42-1.16
Company
Visits the place with a
companion No 83.1 1 83.2 1 83.1 1
Yes 52.1 0.62 0.46-0.86 67.8 0.82 0.66-1.01 60.2 0.73 0.61-0.86
Access
Distance from residence <1 km 80.5 1 83.3 1 82.7 1
≥1 km 50.7 0.63 0.46-0.86 60.9 0.73 0.58-0.92 55.3 0.67 0.56-0.80
Facility of access Easy/very easy 62.4 1 76.8 1 71.2 1
Diicult/very
diicult 35.1 0.56 0.32-0.99 41.9 0.55 0.31-0.95 38.2 0.54 0.36-0.80
Means of transportation Car/bus 49.5 1 56.9 1 52.5 1
Walking/bicycle 73.5 1.48 1.11-1.99 81.6 1.43 1.11-1.85 79.4 1.51 1.26-1.82
Leisure time PA
Walking 0 min/wk 47.4 1 61.3 1 54.8 1
1-149 min/wk 73.8 1.56 1.07-2.26 76.1 1.24 0.95-1.62 75.4 1.38 1.11-1.71 ≥150 min/wk 67.8 1.43 1.01-2.01 90.1 1.47 1.13-1.91 81.0 1.48 1.20-1.82
MVPA 0 min/wk 43.7 1 55.1 1 50.3 1
1-149 min/wk 52.6 1.21 0.69-2.11 67.5 1.22 0.84-1.78 62.8 1.25 0.92-1.70 ≥150 min/wk 65.6 1.49 1.01-2.22 83.8 1.52 1.13-2.08 68.4 1.51 1.19-1.92
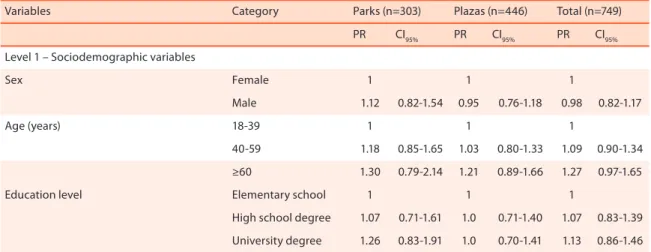
Table 3. Multivariable analysis of individual and environmental factors associated with frequent use of parks and plazas†. Curitiba, Brazil, 2008 (n=749)
Variables Category Parks (n=303) Plazas (n=446) Total (n=749)
PR CI95% PR CI95% PR CI95% Level 1 – Sociodemographic variables
Sex Female 1 1 1
Male 1.12 0.82-1.54 0.95 0.76-1.18 0.98 0.82-1.17
Age (years) 18-39 1 1 1
40-59 1.18 0.85-1.65 1.03 0.80-1.33 1.09 0.90-1.34 ≥60 1.30 0.79-2.14 1.21 0.89-1.66 1.27 0.97-1.65
Education level Elementary school 1 1 1
High school degree 1.07 0.71-1.61 1.0 0.71-1.40 1.07 0.83-1.39 University degree 1.26 0.83-1.91 1.0 0.70-1.41 1.13 0.86-1.46
Level 2 – Health variables
IMC (kg/m2) <24.9 1 1 1
≥25.0 0.81 0.58-1.12 0.98 0.76-1.25 0.90 0.74-1.10
Health perception Very good/excellent 1 1 1
Good 0.75 0.54-1.03 0.98 0.79-1.23 0.93 0.77-1.11 Poor/very poor 0.87 0.40-1.88 0.61 0.31-1.21 0.72 0.43-1.20
Level 3 – Company
Visits the place with a companion No 1 1 1
Yes 0.66 0.49-0.92 0.82 0.65-1.02 0.74 0.62-0.89
Level 4 – Access
Distance from residence <1 km 1 1 1
≥1 km 0.69 0.45-1.05 0.87 0.64-1.18 0.82 0.64-1.04
Facility of access Easy/very easy 1 1 1
Diicult/very diicult 0.72 0.40-1.30 0.65 0.35-1.20 0.66 0.44-1.01
Means of transportation Car/bus 1 1 1
Walking/bicycle 1.12 0.74-1.70 1.18 0.84-1.68 1.16 0.89-1.51
Level 5 – Leisure time PA
Walking 0 min/wk 1 1 1
1-149 min/wk 1.61 1.06-2.45 1.18 0.88-1.57 1.28 1.02-1.61 ≥150 min/wk 1.18 0.81-1.72 1.35 0.99-1.84 1.30 1.03-1.64
MVPA 0 min/wk 1 1 1
1-149 min/wk 1.14 0.64-2.03 1.21 0.81-1.79 1.17 0.85-1.62 ≥150 min/wk 1.16 0.75-1.79 1.47 1.05-2.04 1.39 1.07-1.80
†values adjusted for the variables with p<0.20 in the bivariate analysis; CI
95%: 95% conidence interval; BMI: body mass index; MVPA: moderate and
DISCUSSION
his is one of the irst studies to analyze the association of individual and
environmental factors with park and plaza use in Brazil. he methodology
used allowed to represent the places considering the social and environmental attributes of the communities, which was one of the strengths of the research.
he results show that company and PA are associated with the use of the
places. Frequent use reached 68%, which can be partially attributed to PA promotion programs developed in the city, characterized by actions taking place in parks and plazas19,21.
he support of friends and family may favor PA practice16,18,27.
How-ever, some authors highlighted the inconsistency of the association of variables related to social environment with park use and PA practice in these places28. Although 65.9% of participants reported having company
when visiting parks and plazas, this variable was inversely associated with a higher frequency to these places. he inverse association may be explained by the need and/or dependence of a companion to visit the park/plaza. Among those who visited the places with a companion, 70% reported the company of a friend or spouse (data not shown). A population-based study carried out in Pelotas-RS, Brazil, demonstrated that lack of company was one of the main barriers associated with PA29. Besides that, barriers such
as lack of time and feeling too tired were usually reported and associated with PA29. hese reasons, among others, can hamper the availability of the
companion to visit parks and engage in PA in these places and in other public recreational spaces.
Higher PA levels were associated with frequent use of the places in the grouped analysis. In fact, review studies demonstrated a positive associa-tion between these variables6,8,28. In the present study, the proportion of
individuals who reached ≥150 min/wk of walking and MVPA was higher than that found in a representative sample from Curitiba9 (walking: 29.5%
vs. 16.3%; MVPA: 61.3% vs. 32.7%). he greater availability of parks, pla-zas, walking trails and another recreational spaces in the neighborhood is associated with a higher MVPA level in the population from Curitiba9,10.
Previous investigations have already identiied that the public recreational spaces of the city are commonly used by the community for PA21,22, and
that most users were active7.
A speciic association of walking between 1-149 min/wk with park use was observed, as well as of MVPA ≥150 min/wk with plaza use. his diference can be partially explained by the infrastructure of the places. For example, walking trails represent 13% of the area available for PA in parks, while this proportion is of only 6% in plazas22. In addition, the plazas
evaluated show a higher number of areas designed for structured sports like soccer, volleyball, and basketball (plazas: mean of 9 places vs. parks: mean of 5 places)22. hese activities are more intense than walking and may
and proximity from residence with park use15,28, this hypothesis was not
conirmed in the present study. hese results indicate the need of further research for a better understanding of this behavior. In Curitiba, because of the high number of public recreational spaces, 77% of the population report the existence of a place for PA near their residence30. his
charac-teristic can partially explain the absence of association between proximity, access and use of the places.
he results of the present study should be analyzed taking some limita-tions into account. he intentional selection of adults in areas speciic for PA does not allow the extrapolation of the results to the youth population or to adults who use parks and plazas for contemplative activities such as reading and picnicking. Data collection was performed in the months of mild weather, which makes it diicult to generalize the results to others periods of the year. Finally, the cross-sectional design does not allow to establish the causal relationship between the variables.
CONCLUSION
Company and PA are associated with frequent use of parks and plazas. Policy-makers should invest in interventions to enhance social networking in these places, and also encourage the use of the infrastructure for PA of difer-ent intensities. Providing group activities that take advantage of the existing facilities could be an important strategy to increase the use of the places, besides increasing population’s PA level. Future studies should analyze the association of quality and use of parks and plazas with population’s engagement in PA.
Acknowledgments
RC Fermino is a PhD student and receives scholarship from the Brazil-ian Federal Agency for Support and Evaluation of Graduate Education
(Coordenação de Aperfeiçoamento de Pessoal de Nível Superior, CAPES).
he authors thank the collaboration of the coordinators from Municipal
Secretary of Sports, Leisure and Youth (MSSLY) and the Municipal Health Secretary (MHS), as well as for the collaboration of the members of the Research Group on Physical Activity and Quality of Life (Grupo de Pesquisa em Atividade Física e Qualidade de Vida [GPAQ]) for their assistance in data collection.
REFERENCES
1. U.S. Department of Health and Human Services Physical Activity Guidelines Ad-visory Committee Report, 2008. Washington, DC. 2008. Available from: <http:// www.health.gov/paguidelines/Report/pdf/CommitteeReport.pdf> [2009 abr 22].
2. Pucci GC, Rech CR, Fermino RC, Reis RS. Associação entre atividade física e quali-dade de vida em adultos: revisão sistemática. Rev Saúde Pública 2012;46:166-79.
4. Lyn R. Physical activity research: identifying the synergistic relationships between individual, social and environmental factors to promote active lifestyles. Health Educ Res 2010;25(2):183-4.
5. Sallis JF, Bauman A, Pratt M. Environmental and policy interventions to promote physical activity. Am J Prev Med 1998;15(4):379-97.
6. Kaczynski AT, Henderson KA. Parks and recreation settings and active living: a review of associations with physical activity function and intensity. J Phys Act Health 2008;5(4):619-32.
7. Petroski EL, Silva DAS, Reis RS, Pelegrini A. Estágios de mudança de comporta-mento e percepção positiva do ambiente para atividade física em usuários de parque urbano. Motricidade 2009;5(2):17-31.
8. Bedimo-Rung AL, Mowen AJ, Cohen DA. he signiicance of parks to physical activity and public health: a conceptual model. Am J Prev Med 2005;28(2 Suppl 2):159-68.
9. Hino AAF, Reis RS, Sarmiento OL, Parra DC, Brownson RC. he built environ-ment and recreational physical activity among adults in Curitiba, Brazil. Prev Med 2011;52(6):419-22.
10. Parra DC, Hoehner CM, Hallal PC, Ribeiro IC, Reis RS, Brownson RC, et al. Per-ceived environmental correlates of physical activity for leisure and transportation in Curitiba, Brazil. Prev Med 2011;52(3-4):234-8.
11. Florindo AA, Hallal PC, Moura EC, Malta DC. Prática de atividades físicas e fa-tores associados em adultos, Brasil, 2006. Rev Saúde Pública 2009;43(Supl 2):65-73.
12. Bull FC, Gauvin L, Bauman A, Shilton T, Kohl III HW, Salmon A. he Toronto Char-ter for Physical Activity: A Global Call for Action. J Phys Act Health 2010;7(4):421-2.
13. Cohen D, Sehgal A, Williamson S, Sturm R, McKenzie TL, Lara R, et al. Park use and physical activity in a sample of public parks in the city of Los Angeles. Techni-cal report. 2006. Available from: <http://www.rand.org/pubs/techniTechni-cal_reports/ TR357/> [2010 jan 7].
14. Eyler AA, Brownson RC, Bacak SJ, Housemann RA. he epidemiology of walking for physical activity in the United States. Med Sci Sports Exerc 2003;35(9):1529-36.
15. Cohen DA, McKenzie TL, Sehgal A, Williamson S, Golinelli D, Lurie N. Contri-bution of public parks to physical activity. Am J Public Health 2007;97(3):509-14.
16. Silva DAS, Petroski EL, Reis RS. Barreiras e facilitadores de atividades físicas em freqüentadores de parques públicos. Motriz (Rio Claro) 2009;15(2):219-27.
17. Oliveira GF, Bartholomeu T, Tinucci T, Forjaz CLM. Risco cardiovascular de usuários ativos, insuicientemente ativos e inativos de parques públicos. Rev Bras Cineantropom Desempenho Hum 2008;10(2):170-5.
18. Collet C, Muniz B, Reis RS, Nascimento JV. Fatores determinantes para a realização de atividades físicas em parque urbano de Florianópolis. Rev Bras Ativ Fís Saúde 2008;13(1):15-23.
19. Reis RS, Hallal PC, Parra DC, Ribeiro IC, Brownson RC, Pratt M, et al. Promoting physical activity through community-wide policies and planning: indings from Curitiba, Brazil. J Phys Act Health 2010;7(Suppl 2):S137-S145.
20. Hoehner CM, Soares J, Perez DP, Ribeiro IC, Joshu CE, Pratt M, et al. Physical activity interventions in Latin America: a systematic review. Am J Prev Med 2008;34(3):224-33.
21. Hallal PC, Reis RS, Hino AAF, Santos MS, Grande D, Krempel M, et al. Avaliação de programas comunitários de promoção da atividade física: O caso de Curitiba, Paraná. Rev Bras Ativ Fís Saúde 2009;14(2):104-14.
22. Hino AAF, Reis RS, Parra D, Ribeiro IC, Brownson RC, Fermino RC. Using ob-servational methods to evaluate public open spaces and physical activity in Brazil. J Phys Act Health 2010;7(Suppl 2):S146-S154.
23. Luiz RR, Magnanini MMF. A lógica da determinação do tamanho da amostra em investigações epidemiológicas. Cad Saúde Colet (Rio J) 2000;8(2):9-28.
25. VIGITEL BRASIL 2010. Vigilância de fatores de risco e proteção para doenças crônicas por inquérito telefônico. Available from: < http://portal.saude.gov.br/ portal/arquivos/pdf/vigitel_2010_preliminar_web.pdf> [2011 abr 02).
26. Matsudo SMM, Araújo TL, Matsudo VKR, Andrade DR, Andrade EL, Oliveira LC, et al. Questionário internacional de atividade física (IPAQ): estudo de validade e reprodutibilidade no Brasil. Rev Bras Ativ Fís Saúde 2001;6(2):5-18.
27. Trost SG, Owen N, Bauman AE, Sallis JF, Brown W. Correlates of adults’ participa-tion in physical activity: review and update. Med Sci Sports Exerc 2002;34(12):1996-2001.
28. McCormack GR, Rock M, Toohey AM, Hignell D. Characteristics of urban parks associated with park use and physical activity: A review of qualitative research. Health Place 2010;16:712-26.
29. Reichert FF, Barros AJ, Domingues MR, Hallal PC. he role of perceived per-sonal barriers to engagement in leisure-time physical activity. Am J Public Health 2007;97(3):515-519.
30. Prefeitura Municipal de Curitiba. Peril das doenças e agravos não transmissíveis e fatores de risco. Secretaria Municipal da Saúde. Centro de Epidemiologia. Co-ordenação de Diagnóstico em Saúde. 2008. p. 17
Corresponding author
Rogério César Fermino
Pontifícia Universidade Católica do Paraná – PUCPR
Escola de Saúde e Biociências – Curso de Educação Física
Grupo de Pesquisa em Atividade Física e Qualidade de Vida – GPAQ Rua Imaculada Conceição, 1155 – Prado Velho – 80215-901 – Curitiba-PR – Brasil