RBCDH
Licence Creative Commom
CC
1 Universidade Federal de Minas Gerais. Escola de Educação Física, Fisioterapia e Terapia Ocupacional. Belo Horizonte, MG. Brasil. 2 Universidade Federal de Ouro Preto. Centro Desportivo. Ouro Preto, MG. Brasil.
3 Centro Federal de Educação Tec-nológica de Minas Gerais. Campus Timóteo. Timóteo, MG. Brasil. 4 Universidade Federal de Viçosa. Viçosa, MG. Brasil.
Received: 27 June 2011 Accepted: 26 January 2012
Energy demand and heart rate evaluation
at different phases during a match along an
official soccer competition
Avaliação da demanda energética e frequência cardíaca
em diferentes fases durante jogos ao longo de uma
competição oficial de futebol.
Daniel Barbosa Coelho1,2
Leonardo Gomes Coelho1,3
Lucas Ávila Fleury Mortimer1
Alexandre Sérvulo Ribeiro Hudson1
João Carlos Bouzas Marins4
Danusa Dias Soares1
Emerson Silami Garcia1
Abstract – he purpose of the present study was to analyze the energy expenditure and
heart rate (HR), expressed as mean and maximal heart rate (HRmax), along matches of an oicial soccer competition. Methods: Eighteen under-20 year old (U-20) soccer players from a irst-division Brazilian soccer team were evaluated during 15 matches. he rela-tionship between HR and oxygen uptake (HR/VO2 relationship) was established, and a linear regression equation was developed for each individual player participating in the study. his equation was then used to determine the oxygen uptake and the correspond-ing energy expenditure based on the HR values measured durcorrespond-ing the games. he HR was recorded at 5-second intervals, which were clustered in phases of 15 minutes (0-15 min, 15-30 min e 30-45 min) for each half time (irst half [FH] and second half [SH]). Results: he players’ oxygen uptake was 308.3 ± 11.9 LO2/game and the energy expenditure was 17.3±1.3 Kcal.min-1 and 1,542.9±125.1 Kcal/game. he results showed that there were signiicant diferences between the HR and HRmax identiied in the irst half (FH 15-30 min) compared to the second half (SH 0-15 min and SH 30-45 min), and at FH 30-45 min compared to SH 0-15 min (p<0.05). Conclusions: We concluded that soccer should be considered as an extremely arduous activity for U-20 players due to the high energy expenditure during the matches of an oicial championship. We also concluded that, during soccer games with young players, FH 15-30 min could be considered the most intense phase, because the highest values of HR and HRmax usually occur at this phase.
Key words:Correlation; Energy expenditure; Intermittent.
Resumo– O objetivo do presente estudo foi a análise do gasto energético e da frequência cardíaca (HR), expressa pela média e pela frequência cardíaca máxima (FCmax), durante jogos de uma competição oicial de futebol. Foram avaliados, durante 15 jogos, dezoito jogadores de futebol da categoria abaixo de 20 anos de idade (Sub-20) de um time da primeira divisão de futebol brasileira. A relação entre FC e consumo de oxigênio (relação FC/VO2) foi estabe-lecida, e uma equação de regressão linear foi desenvolvida para cada jogador. Essa equação foi utilizada para determinar o consumo de oxigênio e o gasto energético correspondente a partir dos valores de FC medidos durante os jogos. O registro da FC ocorreu em intervalos de 5 segundos, agrupados em fases de 15 minutos (0-15 min, 15-30 min e 30-45 min) em cada tempo de jogo [primeiro tempo (PT) e segundo tempo (ST)]. O consumo de oxigênio dos jogadores foi de 308,3 ± 11,9 LO2/jogo e o gasto energético foi de 17,3 ± 1,3 Kcal.min-1
Energy demand and heart rate in soccer Coelho et al.
INTRODUCTION
Soccer is considered a high-intensity intermittent activity1-3 with diferent game patterns between positions4, and is characterized by short-duration high-speed runs, jumps, headings, and ball disputes, besides other activi-ties, such as jogging, low-speed running, and walks.he exercise intensity during a soccer match is about 75% of the maximal oxygen uptake (VO2max), and great part of the match occurs at anaerobic intensity zones5. It should be pointed out that the game lasts for about 90 minutes and that the players run over 10 km per game on average6,7. Due to its correlation with oxygen consumption, heart rate (HR) is considered an important tool for evaluating the energy cost of sports in which the use of indirect calorimetry during the activity is not possible8-11.
he exercise intensity monitoring takes maximal heart rate (HRmax)
percent into consideration12,13,identifying and using correct HR
max values is the key to individualized overload prescription14,15. Moreover, HR
max values are also used to estimate the energy expenditure16. HR
max should be determined in real competition situations17,18, because when it is estimated it might not be reliable12.
he energy expenditure of a single soccer player calculated from the
HR measured during a friendly game was 1,360 Kcal19. Using the same
procedure, Garcia et al.9 evaluated 23 Brazilian professional soccer players
during oicial matches and reported an average value of 11.3 Kcal.min-1
and individual values ranging from 6.4 Kcal.min-1 to 16.8 Kcal.min-1, and Stolen et al.20 reported an average value of 1,700 Kcal/game.
he knowledge of the energy expenditure during any sport competi-tion can be used by coaches, team physicians and nutricompeti-tionists as a tool for better planning the workouts, diet, and recovery activities for athletes;
moreover, the correct HR and HRmax identiication is fundamental for
training monitoring and planning. hus, the purpose of the present study
was to analyze the energy expenditure and heart rate (mean and HRmax)
along matches of an oicial soccer competition of the under-20 year-old category (U-20).
METHODS
Eighteen U-20 male athletes from a irst-division Brazilian soccer team, who participated in competitions organized by the Brazilian Soccer Confedera-tion, volunteered for the study. he HR of eight midielders, ive forwards, and ive defenders was monitored during at least eight of twelve matches. On average, the players participated in 9.5 ± 0.8 matches.
he percent body fat was calculated from skinfold measurements21 using a manual skinfold calliper (Lange®). he subjects were weighed in kilograms (to the nearest 0.1 kg) on a calibrated scale (Filizola®, Brazil). he subjects’ height was measured using a standard stadiometer connected to the scale.
he athletes’ VO2max was measured by the open-circuit spirometry
method using the Bruce protocol12 and a BIOPAC® breath-by-breath spirom-eter. his device registers the oxygen uptake in each respiratory incursion and its precision is 0.01 LO2.
he data from the VO2max test were used to establish the relationship between HR and VO2. Hence, it was possible to establish the relationship
between HR and VO2 within an activity range that encompassed from
low-intensity aerobic activity until values close to the VO2max.
All players were evaluated in the morning, and it was assured that they did not perform any intense exercise up to 72 hours before the tests. he players’ HR was recorded during matches from an oicial competi-tion in which two matches were played weekly, along two months (15 games), using a recording system (Polar Electro Oy, Team System, Fin-land). he HR data were analyzed by the Polar Precision Performance SW 3.0 sotware.
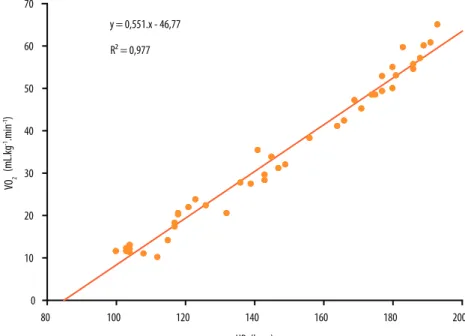
Individual regression equations were developed from the HR and VO2
measurements recorded during the progressive treadmill test. he average
correlation between the HR and VO2 of the athletes was 0.97 ± 0.05. he
igure 2 shows an example of this relationship in a soccer player.
he individual regression equations were used to calculate the VO2
(mLO2. kg-1.min-1 and LO
2 for all game and each phase) on the basis of the
HR data obtained from each soccer player during the matches. he VO2
values were then converted into kilocalories per minute (Kcal.min-1) and kilocalories per game (Kcal/game) assuming that 1 LO2 = 5.0 Kcal22. Both the total oxygen uptake and total energy expenditure of each volunteer were calculated using the actual individual playing time.
he individual athletes’ HRmax was determined as the highest HR
observed during all the matches from the same soccer player. For evalu-ation purposes, the matches were divided into phases (0-15 min, 15-30 min, and 30-45 min) for the irst (FH) and second (SH) halves, and it was
determined at which phase the HRmax was deined. Ater this, the percent
of HRmax determined at each phase was calculated.
Energy demand and heart rate in soccer Coelho et al.
Statistical analysis
he data are presented as mean and standard deviation. he HR/VO2
relationship was obtained through the correlation between the variables, using the Pearson Product Moment Correlation Coeicient. he intraclass correlation coeicient (ICC) was used to determine the within-subject reliability of energy expenditure measures among matches. he ICC was also used to determine the within-physical test reliability.
To compare HRmax, HR, oxygen uptake, and energy expenditure among
the match phases, an one-way analysis of variance (ANOVA) was applied, followed by a Tukey’s post-hoc test. he test power, which represents the chance to identify diferences among the groups, was considered at 0.80, for a level of signiicance established at p≤0.05.
RESULTS
he athletes’ age, height, weight, percent body fat, and maximal oxygen consumption were 18.3 ± 0.7 years, 177.3 ± 8.5 cm, 70.1 ± 4.9 kg, 8.8 ± 1.8% body fat, and 58.2 ± 2.3 mLO2.kg-1.min-1 respectively. he ICCs among all physical test values were between 0.94 and 0.99.
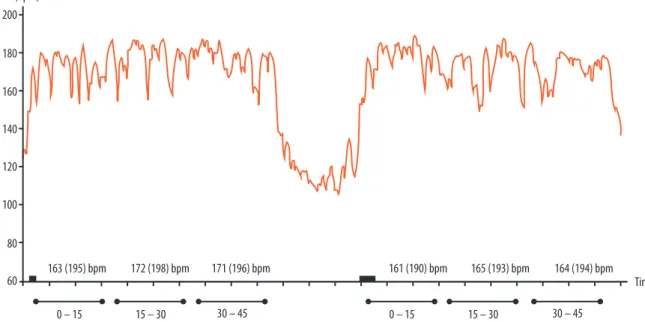
he HR recording of one athlete during a game is shown in igure 1,
as well as the match phases when the HR, expressed as mean (HRmax), was
evaluated.
he results for HRmax (table 1) show that there is a diference between FH 15-30 min when compared with SH 0-15 min (p=0.023) and SH 30-45 min (p=0.031). here is also a diference between FH 30-45 min and SH 0-15min (p=0.015). In the SH there is diference between SH 0-15 min and SH 30-45 min (p=0.037).
About the HR at each phase, the FH 15-30 min was higher than other phases but was not diferent than FH 30-45 min and SH 15-30 min. he HR at FH 30-45 min was higher than at SH 0-15 min (p=0.039) and SH 30-45 min (p=0.040).
he oxygen uptake (mLO2.kg-1.min-1 and LO
2) was higher at FH 15-30 min when compared to SH 0-15 min (p=0.012) and SH 30-45 min (p=0.020).
he energy expenditure (Kcal.min-1) at FH 15-30 min was higher than
at SH 0-15 min (p=0.011). he energy expenditure as total Kcal per phase was higher at FH 15-30 min than at SH 0-15 min (p=0.013) and SH 30-45 min (p=0.034).
he players’ total oxygen uptake was 308.3 ± 11.9 LO2 and the energy expenditure per game was 1,542.9 ± 125.1 Kcal/game or 17.1 ± 2.1 Kcal.
min-1 (table 1). he ICC among soccer players along the competition was
0.98 for oxygen uptake and energy expenditure also.
he energy expenditure among players in terms of tactical playing posi-tion was not tested because of the small sample size of each posiposi-tion group.
he most part of the soccer players’ HRmax was determined at FH
Table 2. Percentage distribution of HRmax reached during the diferent match phases.
Phases FH SH
0-15 min 15-30 min 30–45 min 0–15 min 15–30 min 30–45 min
Percentage 20.45% 31.82% 18.18% 4.54% 11.38% 13.63%
FH- irst half; SH- second half.
Figure 2 shows the HR/VO2 relationship curve from one of the soccer
players.
Table 1. Players’ maximal heart rate, heart rate, oxygen uptake (mLO2. kg-1.min-1, LO
2), and energy expenditure (Kcal.min
-1 and Kcal) among diferent
game phases and for total match.
FH SH
0-15 min 15-30 min 30-45 min 0-15 min 15-30 min 30-45 min Game
HRmax (bpm) 190.3 192.9 191.5 187.1 ¥* 189.8 189.8 ¥† 190.7
SD ±11.1 ±9.9 ±11.7 ±9.6 ±8.9 ±9.7 ±12.3
HR (bpm) 171.0 ¥ 176.0 173.0 163.0 ¥* 170.0 167.0 ¥* 170.0
SD ±10.0 ±8.4 ±6.9 ±7.0 ±8.7 ±9.5 ±9.2
Oxygen uptake (mLO2.kg-1.min-1) 48.9 51.7 50.7 44.1 ¥* 48.9 46.1 ¥* 48.4
SD ±9.5 ±12.3 ±11.1 ±9.5 ±13.2 ±8.5 ±12.1
Oxygen uptake (LO2) 51.4 54.3 52.5 46.7 ¥* 50.8 49.1 ¥ 308.3
SD ±3.1 ±2.8 ±1.6 ±2.8 ±3.0 ± 2.2 ±11.9
E. expenditure (Kcal.min-1) 16.1 17.2 16.7 14.6 ¥ 16.3 15.3 17.1
SD ±2.9 ±4.7 ±3.9 ±3.5 ±3.8 ±4.7 ±2.1
E. expenditure (Kcal) 244.7 258.6 250.3 222.5 ¥* 241.9 233.6 ¥ 1542.9
SD ±22.1 ±32.3 ±27.5 ± 16.9 ±21.7 ±15.0 ±125.1
Mean and standard deviation (SD) of maximal heart rate (HRmax) evaluated at each match phase and per game. ¥ Diference in relation to FH 15-30 min, *
Energy demand and heart rate in soccer Coelho et al.
Figure 2. Individual’s sample heart rate (HR) and oxygen uptake (VO2) from one volunteer.
DISCUSSION
he main inding of the present study was that the oxygen uptake and energy expenditure of players who participated in the U-20 category
dur-ing oicial matches of an oicial competition were 48.4 ± 12.1 mLO2.kg-1.
min-1 and 17.3 ± 1.3 Kcal.min-1 respectively, which corresponded to a total
average of 308.3 ± 11.9 LO2/game or 1,542.9 ± 125.1 Kcal/game. In
addi-tion, FH 15-30 min seems to be the most intense phase because of the high
HR and HRmax values.
he use of the HR/VO2 relationship to calculate the energy expenditure from the HR measurements has been shown to provide reliable results by Esposito et al.3, who did not ind any diference between the estimated VO
2 and that measured in athletes who performed soccer-speciic activities wearing a portable spirometer.
From the average energy expenditure expressed in Kcal.min-1 reported in the present study, soccer is classiied as an extremely arduous activity, according to McArdle et al.22. Other authors, using diferent methods, have reported similar estimated values to those of the present study. Shephard6, based on a literature review, estimated that the energy expenditure for a soccer match would be 17.4 Kcal.min-1 or 1,565 Kcal in a 90-minute match.
Stolen et al.20, assuming that the oxygen uptake during a soccer match
would be of approximately 75%VO2max, suggested that players weighing
75 kg and with VO2max of 60, 65 and 70 mL.kg-1.min-1 would have energy expenditures of 1,519, 1,645 and 1,772 Kcal/game respectively.
Our results are also similar to those reported by Reilly & homas23,
who conducted an experiment using the HR/VO2 relationship to evaluate
diferent and some did not play for the whole 90 minutes. his point is diferent from the present study, in which each soccer player was moni-tored along all the matches. It has been suggested that the efort intensity of simulated or friendly matches is lower than that of real matches24 due to lack of motivation18.
he calculated energy expenditure in our study was higher than the
value proposed by Bangsbo19, who used the core temperature of a single
athlete to estimate his energy expenditure during a soccer match and reported a value of 1,360 Kcal. Other authors used the total daily energy expenditure to estimate the caloric cost of a soccer match24. Sports nutri-tionists could use this information for planning special dietary strategies for the athletes25. In our study, we have evaluated athletes from diferent tactical playing positions during a series of 15 matches over a 2-month time span, to improve the reliability of our results19.
he results (table 2) show that the majority of athletes reach their HRmax, and the higher mean HR is observed in the intermediate phase of the FH (FH 15-30 min). It can occur because both teams would be studying each other at the beginning of the match, trying to take a tactical advantage. In this phase, soccer players do not have optimal physical conditions to get the best muscular performance. One of these conditions could be adequate body temperature26. hus, the maximal efort would happen in the middle of the FH.
It is possible to notice a visual decrease between the same phases of
the FH and SH (table 2). he FH shows higher percentage values of HRmax
than the SH. he results of the present study agree with those from other investigations27,28 that found a decrease in HR at the SH. his intensity decrease should be attributed to glycogen depletion or dehydration29.
During the last phase of the match (SH 30-45 min), a discrete increase in HRmax cases was observed (table 2). his fact can be attributed to the importance of this phase for the match.
For many decades, the evaluation of the exercise intensity in team sports was possible only during practice and workouts, but that has changed with the new technologies now available in the market worldwide. he possibil-ity of assessing the energy requirements with HR measurements during oicial matches will represent an important step in the process of ofering to athletes better strategies for the training loads and the diet, as well as
weight control and recovery between matches over the season30.
he use of the HR/VO2-relationship to calculate energy expenditure
Energy demand and heart rate in soccer Coelho et al.
CONCLUSIONS
We concluded that soccer presents high values of energy expenditure during the matches of an oicial championship, and, due this fact, it is classiied as an extremely arduous sport.
It is suggested that the intermediate phase of the FH is the most intense, because some of the parameters present higher values at this phase and the majority of soccer players present their HRmax at this phase.
REFERENCES
1. Coelho DB, Morandi RF, Melo M, Silami-Garcia E. Cinética da creatina quinase em jogadores de futebol proissional em uma temporada competitiva. Rev Bras Cineantropom Desempenho Hum 2011;13:189-94.
2. Rienzi E, Drust B, Reilly T, Carter J, Martin A. Investigation of anthropometrics and work-rate proiles of elite South American international soccer player. J Sport Med Phys Fit 2000;40:162-9.
3. Espósito F, Impellizzeri FM, Margonato V, Vanni R, Pizzini G, Veicsteinas A. Validity of heart rate as an indicator of aerobic demand during soccer activities in amateur soccer players. Eur J Appl Physiol 2004;93:167-72.
4. Bloomield J, Polman R, O’Donoghue P. Physical demands of diferent positions in FA Premier League soccer. J Sports Sci Med 2007;6:63-70.
5. Helgerud J, Engen LC, Wislof U, Hof J. Aerobic endurance training improves soccer performance. Med Sci Sports Exerc 2001;33(11):1925-31.
6. Shephard RJ. he energy needs of the soccer player. Clin J Sport Med 1992;2:62-70. 7. Silva AI, Fernandes LC Fernandez R. Energy expenditure and intensity of physi-cal activity in soccer referees during match-play. J Sports Sci Med 2008;7:327-34. 8. Achten J, Jeukendrup AE. Heart rate monitoring: applications and limitations.
Sports Med 2003;33:517-38.
9. Garcia ES, Espírito-Santo LC. Garcia AM, Nunes V. Energy expenditure of pro-fessional soccer players during oicial games (Abstract). Med Sci Sports Exerc 2005;37(Suppl. 5), S87
10. Baroni BM, Couto W, Leal-Junior ECP. Estudo descritivo-comparativo de parâmet-ros de desempenho aeróbio de atletas proissionais de futebol e futsal. Rev Bras Cineantropom Desempenho Hum 2011;13(3):170-6.
11. Silva JF, Dittrich N, Guglielmo LGA. Avaliação aeróbia no futebol. Rev Bras Cine-antropom Desempenho Hum 2011;13(5):384-91
12. ACSM - American College of Sports Medicine. Guidelines for Exercise Testing and Prescription. 7th ed. Baltimore (MD): Lippincott Williams & Wilkins; 2005. 13. Tanaka H, Monahan K, Seals D. Age-Predicted Maximal Heart Rate Revisited. J
Am Coll Cardiol 2001;37(1):153-6.
14. Haskell W, Lee I, Pate R, Powell K, Blair S, Franklin B, et al. Physical activity and pub-lic health. Updated recommendation for adults from the American College of Sports Medicine and the American Heart Association. Circulation 2007;116(9):1081-93. 15. Strath S, Swartz D, Bassett J, O’brien W, King G, Ainsworth B. Evaluation of heart
rate as a method for assessing moderate intensity physical activity. Med Sci Sports Exerc 2000;32(9):465-70.
16. Amorim P, Gomes T. Gasto energético na atividade física. Rio de Janeiro: Shape; 2003.
17. Mohr M, Krustrup L, Nybo L, Nielsen J, Bangsbo J. Muscle temperature and sprint performance during soccer matches – beneicial efect of re-warm-up at half-time. Scand J Med Sci Sports 2004;14:156-62.
Address for Correspondence
Daniel Barbosa Coelho
Universidade Federal de Minas Gerais Escola de Educação Física, Fisioterapia e Terapia Ocupacional
Laboratório de Fisiologia do Exercício Av. Antônio Carlos, 6627,
CEP: 31270-901 - Belo Horizonte, MG - Brasil
E-mail: danielcoelhoc@bol.com.br
Sports Med 2005;35:501-36.
21. Jackson AS, Pollock ML. Generalized equations for predicting body density of men. Brit J Nutr 1978;40:497-504.
22. McArdle WD, Katch FI, Katch VL. Fisiologia do Exercício: Energia, Nutrição e Desempenho Humano. Rio de Janeiro: Guanabara Koogan; 2008.
23. Reilly T, homas V. Estimated daily energy expenditures of professional associa-tion. Ergonomics 1979;22:541-8.
24. Rodrigues V, Coelho DB, Mortimer L, Condessa L, Soares D, Silami-Garcia E. Exercise intensity in training sessions and oicial games in soccer. J Sports Sci Med 2007;1:57-61.
25. Silami-Garcia E. Taxa metabólica basal de jogadores proissionais de futebol. Rev Bras Educ Fís Esp 2006;37:82-4.
26. Armstrong LE. Nutritional strategies for football: Counteracting heat, cold, high altitude, and jet lag. J Sports Sci 2006;24:723-40.
27. Mortimer L, Condessa L, Rodrigues V, Coelho D, Soares D, Silami-Garcia E. Comparação entre a intensidade do esforço realizada por jovens futebolistas no primeiro e no segundo tempo do jogo de futebol. Rev Port Cienc Desp 2006;6:154-9. 28. Wislof U, Helgerud J, Hof J. Strength and endurance of elite soccer players. Med
Sci Sports Exerc 1998;3:462-7.
29. Edwards A, Noakes T. Dehydration: cause of fatigue or sign of pacing in elite soc-cer? Sports Med 2009;9(1):1-13.