A Work Project, presented as part of the requirements for the Award of a Masters Degree in Economics from the NOVA – School of Business and Economics
Determinants of Reelection
in Portuguese Municipal Elections
Silvia Sarpietro 676
A Project carried out on the Economic Policy area, under the supervision of:
Professor Susana Peralta
June 2014
1
Determinants of Reelection in Portuguese Municipal Elections
Abstract
This Work Project investigates the determinants of reelection using data on the 278 Portuguese mainland municipalities for the period 1976-2009. We implement a logit fixed effect
model to control for the municipalities’ unobserved characteristics that remain constant over time.
Political variables, such as the vote share of the incumbent’s party in previous election, the number
of mayor’s consecutive mandates and abstention rate, are found to be relevant in explaining
incumbent’s reelection. Moreover, as to the mayor’s individual characteristics, age and education
contribute to explain reelection prospects. We also provide weak evidence that a higher degree of fiscal autonomy increases political turnover and that the good economic prospects of the municipality positively affect reelection. Finally, the residents’ level of education and the size of the
municipal population have an explanatory power on mayor’s reelection. We perform several
robustness checks to confirm these results.
Keywords: Reelection, Portuguese municipalities, Mayor, Local elections, Fiscal decentralization,
2
1. Introduction
This Work Project investigates, with a logit fixed effect model, the determinants of the probability of mayors’ reelection, using a panel of the 278 Portuguese mainland municipalities for the period 1976-2009.
The literature on principal-agent model in political economy is extensive.1 The theoretical framework on elections and political accountability considers a setting of asymmetric information where information on the mayor’s type and/or on the cost of public good is hidden.2 In principle, reelection represents a powerful tool to discipline politicians, rewarding, with an additional term, mayors that have acted in the voters’ interest. Hence, incumbent politicians evaluate the impact of policy choices on their reelection prospects.
The opportunistic behavior of incumbents, who seek to gain electoral support by manipulating fiscal policy (e.g. with tax cuts or expenditure increases), has been widely analyzed in literature, together with the related topic of electoral business cycles. A quite large branch of research focuses on politicians’ behavior in electoral terms, on the factors that can affect reelection chances and, in particular, on the impact of economic variables on reelection prospects.
Recently, much attention has been devoted to the analysis of the probability of reelection at a sub-national level due to the advantages offered by a larger sample size and by the greater comparability of institutional settings when local elections are taken into account. Moreover, local politicians are, in principle, more accountable to citizens with reference to local issues. Indeed, local government outputs have a higher visibility and, therefore, citizens can more easily monitor the responses of local politicians to their needs.
1
The monograph of Persson and Tabellini (2002) represents one of the main references for the analysis of political economy. The authors suggest the adoption of a unified approach that combines the theory of macroeconomic policy,
public choice and rational choice in political science in order to deal with agency problems and voters’ preferences
over economic outcomes and policy. Another relevant source for the analysis of the political economy of good government is Besley (2007).
2 The typical political agency model considers two types of politicians: “good” politicians, whose preferences are
3 The choice of Portugal is suitable for this analysis since the Portuguese organization and legislative framework make municipal elections in Portugal an interesting and singular case of study. First, for the period 1976-2009, no legal term limit was imposed to mayor’s office.3 Hence, no institutional constraint is active on the probability of reelection for the considered time period. Second, election dates are fixed, “defined exogenously from the perspective of local authorities” (Veiga and Veiga, 2007) and equal for all the municipalities.4 Third, the mayor has a high decisional power over the definition and implementation of local policy. Finally, with few exceptions, all competences are shared only between municipalities and central government, leaving no room for vertical externalities between other levels of local authorities.
This Work Project analyzes whether political, fiscal, economic and demographic variables, as
well as mayors’ individual characteristics, make incumbents more likely to be reelected.
The rest of the Work Project is organized as follows. Section 2 reviews the literature on the topic. Section 3 describes the Portuguese system, with an overview of the Portuguese political and fiscal system. Section 4 reports the methodology used for the analysis, with a focus on the expected impact of the explanatory variables on reelection. Section 5 provides the estimation results. Section 6 concludes.
2. Literature Review
The literature on the determinants of reelection mainly focuses on incumbents’ opportunistic behavior in electoral years and on the impact of economic variables on reelection chances.
The importance of economic variables on electoral outcomes was firstly recognized by Key, in his study on the responsible electorate (1966), and by Kramer, in his work on the effect of macroeconomic fluctuations on voting behavior (1971). Since then, the importance of economic determinants of reelection has been confirmed by the literature.
3
The elections of 2005 and 2009 are considered in the analysis because the law of 2005, which limited the terms of
mayors’ office, started to produce its real effects only since the election date of 2013.
4
4 Empirical evidence shows that voters are concerned about the mayors’ economic performance. According to the so-called “responsibility hypothesis” (Nannestad and Paldman, 1994), incumbents are accountable to the voters for past and current economic outcomes.
Since economic variables are incorporated in the voting function, politicians strive to get reelected by manipulating fiscal policy. Hence, a problem of endogeneity is likely to arise. Nordhaus (1975), McRae (1977) and Rogoff (1990) provide evidence of “Political Business Cycles” (PBC), namely, cycles in macroeconomic variables that are induced by the opportunistic behaviors of incumbents in electoral years, and that, therefore, confirm the existence of endogeneity in the model.
As mentioned above, the literature has recently shifted the analysis of electoral outcomes to the sub-national level. Most of these studies found evidence that local public revenues and expenditures matter for electoral results. Sakurai and Menezes-Filho (2008) found that higher expenditures increase the probability for a Brazilian mayor to be reelected or for a candidate of the same political party to be empowered as a mayor. Balaguer-Call et al. (2014) showed that, for Spanish municipal elections, an increase in local government spending has a positive impact on the chances of reelection for local government.
Studies on reelection prospects also found that several political variables are relevant in explaining reelection chances and the winning share of votes. Cassette et al. (2009), using data on local elections in France, showed that the number of candidates and national partisan waves, play a relevant role on the reelection probability of incumbents and their party’s vote share.
5 affect the vote share of incumbents.5 Martins and Veiga (2013) showed that the municipal economic situation matters for local electoral outcomes, consistently with the responsibility hypothesis. Furthermore, they observed that Portuguese voters attribute a higher importance to recent economic performance, relative to more distant events. Castro and Martins (2011) analyzed the determinants
of the mayors’ choice to run for an additional term in office. They found that this choice is affected
by the local economic situation more than by the national and regional economic performance. In addition, political variables have a high explanatory power for the mayors’ decision to run for another term in office.
This Work Project innovates the literature on several aspects. First, this is the first study, on Portuguese municipal elections, that investigates the determinants of mayor’s reelection. This variable is deemed to be the most appropriate measure of electoral outcomes.6 Second, we extend the time span of the analysis, relative to the other studies on Portuguese municipal elections, in order to consider nine election terms.7 Finally, we introduce, among the set of economic variables, a measure of the degree of fiscal autonomy.
3. The Portuguese system8
In the following paragraphs, we provide an overview of the organization and governance of the Portuguese municipalities, with an analysis of the Portuguese political and fiscal system.
5According to the finding of Veiga and Veiga (2007), spending more on “
Social Equipment”,“Other” (defined as a
residual item of the component “Other Building”), “Overpasses, Streets and Complementary works”, and “Rural roads” increases the incumbents’ percentage of votes.
6
According to Carey et al. (2000), “reelection, rather than vote share or margin of victory, is the ultimate indicator of
electoral success”, hence, the model analyzing the determinants of reelection better “addresses the gist of incumbency advantage”.
7
The considered period (1976-2009) includes 10 elections. However, due to the use of lagged values, the first election (1976) has been dropped from the analysis.
8
The sources of the following paragraphs on the Portuguese system are the Ministério das Cidades, Administração Local, Habitação e Desenvolvimento Regional, (2004): “Estrutura e funcionamento da democracia local e regional”,
the Portuguese Constitution, the document of OECD “Better Regulation in Europe: Portugal” (2010) and the websites
6 3.1. Local organization
The Constitution of the Portuguese Republic, ratified in 1976, was the result of the Portuguese Revolution of 1974 that established democracy ending a 48 years period of dictatorship. 9 Hence, our analysis spans over the entire period of democratic elections in Portugal. The Constitution establishes (art. 6) the existence of a unitary state and recognizes, in the respect of the principle of subsidiarity, the autonomy of local authorities and the democratic decentralization of Public Administration. The Portuguese local government is disciplined by the title VIII of the Constitution, which defines local authorities as territorial legal persons that shall seek to pursue the interests of local people. The art. 236 of the Constitution states that local authorities, on the mainland, “shall comprise parishes (“freguesias”), municipalities (“municípios”) and administrative regions”.
The Azores and Madeira archipelagos are autonomous regions with self government institutions and own parishes and municipalities. Since the organization, governance and statute of autonomy of the two archipelagos uniquely characterize them, it has been decided, for the sake of homogeneity, to drop them from the database and, therefore, to focus the analysis only on the municipalities of the Continent.
Several changes in the number and composition of local authorities have occurred since 1976. With the institution of the municipalities of Amadora, Odivelas, Vizela and Trofa, the number of municipalities on the mainland increased from 274, as of 1976, to the current figure of 278.10 Over the same period, the number of parishes, 4029 in 1976, decreased by 938 units. The current organization of local authorities comprises, therefore, 3091 parishes and 308 municipalities, of which 278 on the mainland, 19 in the region of the Azores and 11 in the region of Madeira. On the Continent, the administrative regions have not already been instituted and the articulation in 18 districts, defined in 1835, still represents one of the main territorial subdivisions, although districts
9
Art. 6.1. (unitary state) of the Constitution of the Portuguese Republic. The Constitution of the Portuguese Republic was officially ratified the 25th April of 1976.
10
7 are not given any policy or administrative competences. Another relevant territorial subdivision, widely used for statistical purposes, is the subdivision in NUTS (Nomenclature of Territorial Units for Statistics). There are three levels of NUTS: NUTS I includes 3 subdivisions (Portugal Continental and the two autonomous regions), NUTS II contains 7 subdivisions (Nord, Center, the Region of Lisboa, the Region of Alentejo, the Region of Algarve and the two autonomous regions), NUTS III further subdivides the territory in 30 sub-regions. A list of the 278 mainland municipalities, classified according to the NUTS subdivision, is provided in Appendix.
3.2. Local political system
With reference to the organization of local authorities, the art. 239 of the Constitution establishes the existence of an elected assembly with decision making powers and a collegial executive body. At the municipal level, the assembly has various competences, including the approval, monitoring, and supervision of the activities of the executive body. The municipal executive body is the so-called “câmara municipal”, literally Municipal Chamber (the Town Council), which is responsible for the supervision of the organization and functioning of municipal services. Among other functions, the “câmara municipal” must: execute the resolutions adopted by the municipal assembly, manage personnel and assets, supervise the budgeting and accountability, grant licenses and support parishes in its territory.
The “câmara municipal” is made up by a number of members (“vereadores”), ranging from a
minimum of 5 up to a maximum of 17, in function of the electoral population of the municipality. The members are elected through a proportional system of direct election and according to the
method of D’Hondt. The candidate of the list receiving the highest number of votes is elected as
mayor, the “presidente da câmara”. The mayor presides over the function and the organization of
the “câmara municipal”.
8 local administration. Moreover, no term limit was imposed to the mayors’ office until 2005, when the new law on electoral rules imposed the limit of a maximum of 3 consecutive mandates.11 However, the law of 2005 has started to produce its effect only as of 2013, because the legal term limits were counted from the election year of 2005. Partly due to the absence of term limits, it was a common feature for the Portuguese municipalities to be represented by mayors in charge for decades. The cases of Braga and of Vila Nova de Poiares, with 10 consecutive mandates, and the cases of Alenquer, Benavente, Castro Verde, Chamusca, Reguengos de Monsaraz, Serpa and Sobral de Monte Agraço, with 9, singular cases in the international scenario, illustrate the specificities of the Portuguese context.
The absence of legal term limits until 2005 qualifies the Portuguese system of local government as a unique case of study for analyzing the determinants of mayors’ reelection.
The existence of political parties is recognized by the Constitution (art. 10) “in order to contribute to the organisation and expression of the will of the people, with respect for the principles of national independence, the unity of the state and political democracy”.
At the central level the Portuguese political scenario has been dominated by two main political parties, both registered in 1975: the Socialist Party, “Partido Socialista” (PS), centre-left wing party, and the social-democratic Party, “Partido Social Democrata” (PPD/PSD) that has, instead, a centre-right orientation.12
3.3. Local finance
The current structure of local finance is the result of several reforms that have modified, since 1976, the legislative framework on local finances. The main reforms occurred in 1979, 1987, 1998 and 2007 and pursued the objective of increasing local autonomy and ensuring a better predictability of total municipal revenues.
11
The term limit was imposed with the law 46/2005, of 29 August.
12
9 The local finance law establishes the sources of revenue collection for municipalities and the rules for the transfers they are entitled to receive from the central government. Currently, the main sources of own revenue collection for the municipalities are:
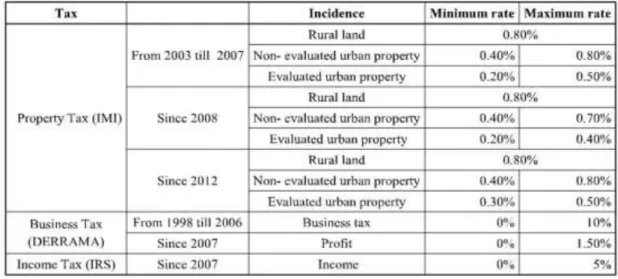
1) Local property tax (IMI – “Imposto Municipal sobre Imóveis”).13 It falls on the value of properties existing in the municipal area. As of 2012, each municipality can choose the tax rate within the range [0.3%-0.5%] for evaluated urban properties, and [0.4%-0.8%] for non re-evaluated ones.14 For rural properties, instead, the tax rate is 0.8% for all the municipalities. Figure 2 shows the changes in the range of values for the tax rates that have occurred since 2003;
2) Municipal property transfer tax (IMT – “Imposto Municipal sobre a transmissão, a título
oneroso, do direito de propriedade de bens imóveis”).15 It falls on the transaction price of real estate
property. The progressive tax schedule is imposed by the central government on all municipalities; 3) Local tax on vehicles (IMV - Imposto Municipal sobre Veículos), i.e. a tax on the registered vehicles of the municipal residents. The tax rate is set by the central government and depends on the characteristics of the vehicle;
4) Municipal surcharge on the Corporate Income Taxes (“Derrama”). It can be imposed in a range of 0 to 10% of the Corporate Income Tax (IRC) collected by the central government in the municipality.
Apart from “Derrama”, all local taxes are compulsory.
13
The IMI, introduced in 2003 (02/12/2003), replaced the so-called “contribuição autárquica”.
14
The fiscal value of the property is set by the central government. The evaluation is made by a valuer in accordance
with the criteria established by the code of IMI (“Códigos do Imposto Municipal sobre Imóveis”– CIMI).
15
10 Figure 2: Municipal range of values for the tax rate of the Property Tax (IMI), of the Business Tax (Derrama) and of the Income Tax
(IRS) and their evolution from 1993. Source: Costa da Silva J., Carvalho A., (2013).
In addition to the own sources, municipal revenue includes transfers from the central government through the municipal funds, financing from the European Union, revenues from the sales of goods and services, financial liabilities, and a residual amount of other revenues. Finally, municipalities benefit from the right to annually participate to a variable percentage, up to 5%, of the Personal Income Tax (IRS) imposed on the municipal fiscal residents.
We now briefly characterize the structure of municipal revenues.
Graph 2 depicts IMI revenue as a percentage of total municipal revenue. This is an indicator of the degree of fiscal autonomy because IMI represents the largest share of own municipal entries and municipalities can discretionally choose the IMI tax rate within a specific range of values.16 Peralta (2010) provides a theoretical model of political accountability that predicts that more fiscal autonomy improves the selection of politicians, and has, therefore, a positive impact on political turnover.The graph shows a significant increase, over time, in the range of values for IMI share and in the difference between its upper and lower quartiles. These results signal a larger variation, in the last years, of the degree of fiscal autonomy across municipalities.
16
11 Graph 2: Box Plots of IMI revenue as a percentage of total municipal revenues, in the years preceding the last six election years. The
graph displays the distribution of data based on 5 number summary: lower adjacent value, 25th percentile (lower hinge),
median, 75th percentile (upper hinge), upper adjacent value. Source: own elaboration from the data provided by the
Direção-Geral das Autarquias Locais (DGAL).
Regarding the expenditure side, the municipal expenditures are ordered by the average size of their relative importance as follows: acquisition of capital goods, of which investment is the largest amount, personnel expenses, acquisition of goods and services, transfers and subsidies, financial liabilities, financial burden, and a residual of other expenditures. The following graph depicts Investment as a percentage of all the municipal expenditures.
Graph 3: Box Plots of Investment as a percentage of total municipal expenditures, in the years preceding the last six election years.
The graph displays the distribution of data based on 5 number summary: lower adjacent value, 25th percentile (lower
hinge), median, 75th percentile (upper hinge), upper adjacent value. Source: own elaboration from the data provided by the
12 Finally, current municipal responsibilities are the delivery of local public services in areas such as water supply, urban waste disposal and social and cultural facilities. Municipalities also issue secondary regulations to enforce national rules in the areas of transport, energy, communication, education, urban and rural spatial planning, rural and urban equipment, health, housing, social affairs and environment. In addition, they are empowered to deliver licenses in these areas and to ensure compliance of citizens and business with the related dispositions (OECD 2010).
4. Methodology
The database used is a panel data for the 278 Portuguese mainland municipalities for the period 1976-2009. This period includes 10 elections: 1976, 1979, 1982, 1985, 1989, 1993, 1997, 2001, 2005, 2009. However, due to the use of lagged values for several regressors of the model, the first election date has been dropped from the database. Analogously, for the four municipalities that were instituted late, we have considered their second municipal elections (for Amadora in 1981 and, for the other three municipalities in 2005) as first time point in the analysis.
The dependent variable of the model is the individual mayor’s probability of reelection. An alternative definition of incumbency refers to the political party instead of the individual. A robustness check is performed by setting as dependent variable the probability either for the incumbent to be reelected or for a candidate of the same political party to be empowered as a mayor. We estimate a logit model with municipal and election fixed effects, to account for unobserved municipal heterogeneity and relevant economic, political and institutional context of each particular election year.
13 larger time span (i.e. “DeltaPPI” “AbstentionRate” and “DependencyRatio”), and a third regression, for the restricted time interval, 2005-2009, that uses all the explanatory variables in the database.17
We now detail the explanatory variables used in this study, together with their expected signs.
4.1. Regressors
The covariates of the model can be grouped into four categories: political variables, individual characteristics of the mayor, socioeconomic and demographic indicators, and economic variables. The following table reports, for each variable included in the regressions, the code name, description, source and some descriptive statistics.
Code name Description Obs. Mean St. err. Time period Source Unit
Dependent variable
Reelection Dummy (1 if the mayor was
reelected) 2480 0,65 0,010 1979-2009
Built from DGAI
-
Independent variables
1) Political variables:
VoteShareprevious Votes share of the incumbent's
party in previous election 2434 50,41 0,197 1979-2009 CNE Percentage
Mandates Consecutive mandates of the incumbent at election date 2480 2,17 0,029 1979-2009
Built from CNE
Number
Left
Dummy (1 if left-wing mayor's party in previous
election)
2480 0,52 0,010 1979-2009
Built from CNE
-
SamePolParty
Dummy (1 if the incumbent's party is same as central
government's)
2480 0,32 0,009 1979-2009
Built from CNE
-
AbstentionRate Abstention rate at the
municipal elections 1654 33,45 0,176 1993-2009 CNE Percentage
2) Mayor's characteristics:
Age Incumbent's age 2282 46,09 0,186 1979-2009 DGAI Number
High_education
Dummy (1 if the incumbent's job surely requires a higher
education)
2285 0,54 0,010 1979-2009
Built from DGAI
-
Low_education
Dummy (1 if the incumbent's job surely does not require a
higher education)
2285 0,12 0,007 1979-2009
Built from DGAI - 17
14
Code name Description Obs. Mean St. err. Time period Source Unit
Unknown_education
Dummy (1 if the incumbent's job might require a higher
education)
2285 0,34 0,010 1979-2010
Built from DGAI
-
Residency
Dummy (1 if the outgoing mayor is a resident of the
municipality)
1776 0,66 0,011 1979-2009
Built from DGAI
-
3) Socioeconomic and Demographic indicators:
LnResidentPopulation Log of municipal resident population 2480 9,84 0,021 1979-2009 INE Number
DependencyRatio
Ratio of residents aged 65 and older plus under 15 to those
aged 15-64
1384 57,78 0,307 1991-2009 INE Number
Grossenrolratesec Gross enrolment rate in upper secondary education 523 119,02 2,674 2005-2009 INE Percentage
Artgalleriesbyinh
Art galleries and other temporary exhibition spaces by
1000 inhabitants
556 0,1105 0,0045 2005-2009 INE No/inh.
4) Economic variables:
L.IMIshare
IMI revenue as a % of municipal revenues (one
period lagged)
1926 0,06 0,001 1981-2009
Built from DGAL
Number
L.Investmentshare
Investment as a % of municipal expenditures (one
period lagged)
1926 0,41 0,005 1981-2009
Built from DGAL
Number
DeltaPPI
Change of the per capita Purchasing Power Index over
the term
1103 0,08 0,004 1997-2009 Built
from INE Number
UnemploymentRate Unemployment Rate 556 6,67 0,097 2005-2009 INE Percentage
L.TaxrateNonReevaluated
Tax rate for non reevaluated urban properties as of the year
preceding the elections.
556 0,68 0,005 2005-2009
Portal das Finanças
-
The variable “VoteShare” is expected to have a positive impact on the probability of
reelection.18 This variable has been used by Cassette at al. (2003), on French local elections, and Veiga and Veiga (2007), on Portuguese mainland municipalities, and both find a positive effect of
this variable on the incumbent’s percentage of votes in the new election.
Veiga and Veiga (2007) also obtain that the number of years the mayor has been in office has a negative and significant impact on the percentage of votes obtained in the new election. A similar result is found by Sakurai and Menezes-Filho (2008), when analyzing the influence of public expenditure on the re-election of Brazilian mayors from 1988 to 2000. Castro and Martins (2011)
18We consider the mayor’s party at the previous election date, despite the cases of mayors changing their parties
15
also use this variable in their study of the incumbent mayor’s decision to re-run for election,
obtaining a negative impact. Consistently with the main findings in literature, an increase in the
variable “Mandates” is expected to reduce her probability of reelection. The expected negative sign
is likely to incorporate the effect of the “cost of ruling”, defined as the decrease in the “stock of popularity” or erosion of support with time.
Another political variable is the dummy “SamePolParty”. The empirical evidence on the expected impact of the political alignment between central and local government is not conclusive. Veiga and Veiga (2007) find that, when inflation is high, belonging to the same political party of the prime minister decreases the incumbent’s percentage of votes. Sakurai and Menezes-Filho (2008) find that the political alignment with the President affects reelection negatively, while the political alignment with the State Governor seems not to have any significant effect.
Finally, abstention rate is used as an inverse measure of the citizens’ involvement in political affairs, which is likely to increase competition among politicians. Hence, the variable
“Abstentionrate”is expected to increase the mayor’s probability of reelection.
We control for the following individual characteristics of the mayor: age, education and residency in the municipality.19 Castro and Martins (2011) find that the only individual characteristic that has a significant impact on the mayor’s decision to run for another term is age, and the effect is negative, consistently with the finding that the probability to run for another term decreases with time.
The third group of variables pertains to the socioeconomic and demographic indicators.20
19
We construct a categorical variable for the level of education associated with the mayors’ occupation, which is the only available data. More specifically, we create three dummies: the first (High_education) for jobs that surely require a higher level of education (e.g. physician), a second (Low_education) for jobs that do not require a degree (e.g. bricklayer) and, finally, a third (Unknown_education) for jobs that might require a higher level of education (e.g., public servant). We also have data on the mayor's gender; however, we do not use this variable due to lack of variability (97% of all observations are "male").
20
16 The evidence on the impact of demographic variables on reelection is not clear. In Sakurai and Menezes-Filho (2008), the only significant one is resident population, with a positive effect. Castro and Martins (2011) find that mayors of municipalities with larger population are more likely to run for another term in office.
We use the variable “DependencyRatio” to control for the political preferences of the population, which are age-related, and it also captures some aspects of the policy context of the municipality.
Finally, the group of economic variables captures the economic context and living standards of the municipalities. Veiga and Veiga (2007) provide weak evidence that the positive variation of the purchasing power index, over the election term, increases the percentage of votes of the incumbent mayor. Similarly, Castro and Martins (2011) finds that the growth of this index leads to an increase in the probability for a mayor to run for another term.21
We also consider two fiscal variables: “IMIshare” and “Investmentshare”.22
“IMIshare” captures two effects. On the one hand, it is used as a measure of the degree of fiscal
autonomy. On the other hand, “IMIshare” is likely to reflect the opportunistic behavior of mayors in the election periods. Indeed, the mayor may decrease local taxes in order to improve her probability of reelection. Pursuing the same objective, the mayor might also increase expenditures, in particular capital expenditures, which is why we use “Investmentshare”. Hence, the regression might suffer from a problem of endogeneity. In order to address the endogeneity of the model, it has been decided to use lagged values for the two variables.23 We also resort to an instrumental variable
approach for robustness purpose, using as instrument for “IMIshare” the number of licensed
buildings for construction.
21
PPI is the municipality’s purchasing power relative to the country average (set equal to 100). We have no GDP data at the municipal level, so we use this synthetic index PPI and unemployment rate as alternative measures.
22
Data have been taken from the website of the DGAL for the period 2003-2012, while they have been copied out from the books of the DGAL for the previous time periods.
23 We use one period lagged variables, i.e. “IMIshare” and “Investmentshare” in the years preceding the elec
17 The other economic variables have been inserted in the regression in order to control for the mayor’s economic performance in the previous periods and for the other specificities of the municipalities that do not remain constant over time.
Unfortunately, no data is available to measure the outcomes of local government’ competencies; the regressors above are intended as proxies. Still, the absence of more appropriate measures of the
mayor’s performance raises the need of further data collection.
5. Estimation results
The estimation results are reported in the following table. T-statistics are presented in parentheses and the level of statistical significance is signaled with asterisks (*p < 0.05, **p < 0.01,
***
p < 0.001).
(1) (2) (3) (4) (5) (6)
Reelection Reelection Reelection Reelection Reelection Reelection
L.IMIshare -4.729 -1.739 -0.567 -0.574
(-1.42) (-0.78) (-0.16) (-0.17)
L.Investmentshare 1.163 2.468** 0.835 0.826
(1.67) (3.21) (0.80) (0.79)
VoteShareprevious 0.0569*** 0.0544*** 0.0586*** 0.0606*** 0.0708*** 0.0703***
(7.93) (7.29) (6.42) (5.55) (4.16) (4.10)
Left 0.295 0.162 0.485** -0.319 0.0885 0.0763
(1.90) (1.02) (2.62) (-1.27) (0.21) (0.18)
SamePolParty -0.510*** -0.506*** -0.674*** -0.0864 0.00906 0.0148
(-4.06) (-3.91) (-4.53) (-0.36) (0.02) (0.04)
Mandateprevious -0.712*** -0.630*** -0.729*** -0.173*** -0.119 -0.120
(-13.45) (-11.18) (-10.72) (-3.42) (-1.63) (-1.63)
AbstentionRate 0.0462*** 0.0731*** 0.0751***
(3.44) (3.35) (3.42)
Age -0.0492*** -0.0507*** -0.0502*** -0.0369* -0.0366*
(-6.06) (-4.99) (-4.21) (-2.03) (-2.01)
High_education 0.284* 0.128 0.0486 0.116 -0.0784 -0.0824
(1.99) (0.86) (0.28) (0.67) (-0.28) (-0.29)
Low_education 0.104 0.141 0.0642 0.284 -0.286 -0.288
(0.46) (0.60) (0.22) (0.99) (-0.61) (-0.61)
Residency -0.0867 -0.0839
(-0.36) (-0.34)
LnResidentPopulation 0.454 0.459 0.0776 -0.0453 0.107 0.0966
(0.82) (0.80) (0.10) (-0.37) (0.52) (0.46)
DependencyRatio -0.0131 0.0112 0.0115
(-1.37) (0.74) (0.76)
DeltaPPI 0.594
18
Grossenrolratesec -0.00393* -0.00386
(-2.01) (-1.95)
UnemploymentRate 0.0853 0.0863
(1.60) (1.61)
Artgalleriesbyinh 1.699 1.717
(1.13) (1.14)
L.TaxrateNonReevaluated 0.358
(0.25)
N 2193 2133 1631 1005 470 470
Time Period 1979-2009 1979-2009 1981-2009 1997-2009 2005-2009 2005-2009
N.elections 9 9 7 4 2 2
Fixed effects Y Y Y N N N
Random effects N N N Y Y Y
Time fixed effect Y Y Y Y N N
The first and the second columns report the regressions for the whole period, the third for the period 1981-200924, the fourth corresponds to the regression for the intermediate time span and the last two report the regressions for the smallest time window. As expected, the level of significance of most of the regressors decreases when a more restricted time horizon is taken into account.
Political variables are all significant and the expected signs obtain. The percentage of votes in the previous election has a positive and statistically significant impact on mayor’s reelection. This result, that holds under all the specifications, incorporates the effect of “persistence of vote share” found by Veiga and Veiga (2007). There is also evidence of erosion of support with time as, consistently with the expectations, the number of the mayor’s consecutive mandates significantly decreases her probability of reelection. The estimated effect of the dummy “Left” is positive although not highly significant. Belonging to the same political party of the central government has a negative impact on reelection prospects (the estimated effect is statistically significant only for the regression considering the largest time span). Finally, abstention rate positively affects the mayor’s probability of reelection. The estimate is highly significant under all specifications and the sign is consistent with the expected result.
19 Regarding the mayor’s characteristics, age significantly and negatively affects reelection,
consistently with the finding that the incumbent’s support and probability to run for another term
decrease with time. “High_education” has a positive and significant impact on reelection prospects (the level of significance decreases when we consider the smaller time spans). Hence, “coeteris
paribus”, mayors with a job that surely requires a degree are more likely to be reelected with respect
to those that occupy a position that might or not require a high education level.
Regarding the set of demographic indicators, the estimated effect of resident population, expressed in logarithmic terms, is positive, although not highly significant and negative in one specification. Therefore, we provide only weak evidence that the mayor is more likely to be reelected, “coeteris paribus”, in larger municipalities.
We also obtain the result that gross enrolment rate for secondary education significantly and negatively affect reelection. Indeed, a higher level of education is likely to imply a deeper citizen’s awareness of the mayors’ performance and a larger voters’ involvement in political affairs.
The other socioeconomic and demographic indicators, inserted only in the specifications for the restricted horizons, are not statistically significant.
Finally, we examine the estimated impact of economic variables on reelection. In all the specifications, the variable “IMIshare”, inserted in lagged values, negatively affects mayor’s reelection (although the estimated impact is not statistically significant). As mentioned above, the
negative effect of “IMIshare” on reelection prospects may capture the opportunistic behavior of
mayors, that reduce taxes seeking reelection. However, the relative importance of this effect is minimized by the use of lagged values. Therefore, the negative estimated effect of the one period
lagged “IMIshare” is likely to reflect the negative impact that a larger fiscal autonomy has on
20 re-evaluated urban properties (regression 6).25 Hence, “coeteris paribus”, a higher degree of fiscal autonomy leads to a higher political turnover.
One period lagged “Investmentshare” has a positive impact on reelection (statistically
significant in the specification for the intermediate time span). Therefore, a mayor of a municipality spending relatively more on investment is more likely to be reelected, keeping all other factors constant. Moreover, consistently with the findings in literature, good economic prospects as measured by the change in the purchasing power index have a positive impact on reelection prospects.
Finally, we perform several robustness checks, in order to overcome potential limitations of our empirical strategy. First, we consider an alternative measure of reelection, defined as a dummy taking the value 1 if either the mayor was reelected or a candidate of the same party empowered as a mayor, and 0 otherwise, as in Sakurai and Menezes-Filho (2008).26 This specification allows to sort out one of the problems of the model: in the baseline specification we do not account for the decision of the outgoing mayor to run for another term in office (data on this information for the first election terms are not available). A positive performance of the outgoing mayor during her mandate is likely to be rewarded by the voters with the election of a candidate of the same political party, if the outgoing mayor decides not to run for the following term. The covariates in this alternative specification (regression 7, in the Appendix) have the same sign as in the original one (actually, their level of significance increases).
A second robustness check uses the data on the candidates for the last three electoral years. The
variable “Recandidate”, a dummy taking the value 1 if the mayor decided to run for the following
term and 0 otherwise, was either set as the new dependent variable of the model or used as a
25
The same results hold also when considering the tax rate of reevaluated urban properties. Due to the lack of available data we have only used the tax rate in the regression with the smallest time span.
26
21 dummy in the original specification. This second method is deemed to be more appropriate because under the first specification a problem of selection bias is likely to arise.
Under this alternative (period 2001-2009, regression 8, in the Appendix), the regressors have
qualitatively similar effects, apart from the variable “Investmentshare”. The two political variables
“LeftMun” and “SamePolParty” maintain the signs they have in the regression for the restricted
time horizon. The variable “Recandidate” has a highly significant and positive effect on reelection.
This result can be interpreted as the candidate’s perception of her reelection chances being rather
accurate.
Another robustness check is performed in order to sort out the potential endogeneity problem that might arise when using the abstention rate at election year. We use abstention rate in previous election to address the potential endogeneity. In this regression (regression 9, in the Appendix), the covariates have the same sign as in the baseline specification. However, the positive effect of
“L4.AbstentionRate” is not anymore statistically significant.
6. Conclusions
This Work Project investigates the determinants of mayor’s reelection using data on Portuguese elections in the 278 mainland municipalities for the period 1976-2009.
Several specificities of the Portuguese context qualify the Portuguese municipal elections as an ideal laboratory of analysis for electoral outcomes and political business cycles. Our analysis is grounded in the literature that analyzes the determinants of electoral outcomes and the opportunistic behavior of mayors seeking reelection.
22 In particular, the obtained results confirm persistence of vote shares and cost of ruling or erosion of support with time; they also provide evidence of the role played on electoral outcomes by an active citizens’ involvement in political affairs.
Moreover, good economic prospects are found to positively affect reelection and mayors of municipalities with relatively high expenditures on investments are more likely to be reelected. We also provide weak evidence that a larger fiscal autonomy is likely to increase political turnover.
Finally, we find that the citizen’s level of education, as proxied by the gross enrolment rate for
secondary education, enhances political competition and that mayors of larger municipalities are more likely to be reelected.
23
References
Balaguer-Coll M., Brun-Martos M., Forte A., Tortosa-Ausina E., (2014), “Determinants of local governments' reelection: New evidence based on a Bayesian approach”, Economics Department, Universitat Jaume I, Castellón (Spain);
Baleiras R. N., da Silva Costa J., (2001), “To Be or Not To Be in Office Again, That is the Question. Political Business Cycles with Local Governments”, FEUNL Working Paper Series, Faculdade de Economia, Universidade Nova de Lisboa (Portugal);
Besley T., Case A., (1993), “Does Electoral Accountability Affect Economic Policy Choices? Evidence from Gubernatorial Term Limits”, NBER Working Papers 4575;
Besley T., (2007), “Principled Agents?: The Political Economy of Good Government”, Lindahl
Lectures, Oxford press;
Brender A., (2003), “The effect of fiscal performance on local government election results in Israel: 1989–1998”, Journal of Public Economics, 87:2187–2205;
Camões, Pedro, J., (2005), “Análise da Evolução das Finanças Locais Portuguesas” / first draft for The determinants of change in local financing systems. Núcleo de estudos em Administração e Políticas Públicas;
Carey J. M., Niemi R. G., Powell L. W., (2000), “Incumbency and the Probability of Reelection in State Legislative Elections”, Cambridge: Harvard University Press, The Journal of Politics, Vol. 62, No. 3, pp. 671-700;
Cassette A., Farvaque E., Héricourt J., Jean N., (2009), “Budget structure and reelection prospects:
Empirical evidence from French local elections”, ZEI - Center for European Integration Studies, University of Bonn (Germany);
Cassette A., Farvaque E., Héricourt, J., (2013), "Two-round elections, one-round determinants? Evidence from the French municipal elections," Public Choice, vol. 156(3), pages 563-591;
Castro V., Martins R., (2011), “Mayors’ Reelection Choice and the Economy: Evidence from Portugal”, NIPE - Universidade do Minho (Portugal);
Costa da Silva J., Carvalho A., (2013), “Yardstick Competition among Portuguese Municipalities The Case of Urban Property Tax (IMI)”, FEP-UP, School of Economics and Management, University of Porto (Portugal);
Kehmani S., (2010), “Gerrymandering decentralization: political selection of grants-financed local
jurisdictions”, In Bosch N., Espasa M., and Solé-Ollé A. (eds.): The Political Economy of Inter-regional fiscal flows: measurement, determinants and effect on country stability. Edward Elgar;
24 Kramer G. H., (1971), “Short-Term Fluctuations in U.S. Voting Behavior, 1896–1964.”, American
Political Science Review 71 (March): 131–43;
Kramer, (1978), “Macroeconomic Determinants of the Vote in Presidential Elections”, Public Finance Review, 6: 427-438;
Litschigy S., Morrisonz K., (2010), “Government Spending and Re-election”, Department of Economics and Business, Universitat Pompeu Fabra, Economics Working Papers 01/2010; Martins R., Veiga F., (2013), “Economic voting in Portuguese municipal elections”, Public Choice,
vol. 155(3), pages 317-334;
Ministério das Cidades, Administração Local, Habitação e Desenvolvimento Regional, (2004):
“Estrutura e funcionamento da democracia local e regional”;
Moreno-Dodson B., Rota-Graziosi G., Vergne C., (2012), “Breaking the wave of democracy: The
effect of foreign aid on the incumbent’s re-election probability”, Working Papers 201231, CERDI;
Nannestad P., Paldam M., (1994), “The VP-Function: A Survey of the Literature on Vote and Popularity Functions after 25 Years”, Public Choice, vol. 79(3-4), pages 213-45;
OECD, (2010), “Better Regulation in Europe: Portugal”, ch.8, pages 101-107;
OECD Tax Policy Studies, (1999), “Taxing Power of State and Local Government”;
Peralta S., (2010), “Partial fiscal decentralization, local elections and accountability”, Department
of Economics, Universidade Nova (Portugal);
Persson T., Tabellini G. E., (2002), “Political Economics: Explaining Economic Policy”, MIT
Press;
Pires de Almeida M. A., (2013), “O Poder Local do Estado Novo à Democracia: Presidentes de câmara e governadores civis, 1936-2012”, Leya - Publisher;
Rogoff K., Sibert A., (1988), “Elections and Macroeconomic Policy Cycles”, The Review of Economic Studies, Vol. 55, No. 1 (Jan., 1988), pp. 1-16;
Sakurai S. N., Menezes-Filho N. A., (2008), “Fiscal policy and reelection in Brazilian
municipalities”, Public Choice, 137:301-314;
Smith J., Turk H., Myers H.P., (1962), “Understanding Local Political Behavior: The Role of the Older Citizen”, 27 Law and Contemporary Problems 280-298;
Solé Ollé A., (2011), “The political economy of partial fiscal decentralization: theory and empirical
evidence”, Universitat de Barcelona & Institut d’Economia de Barcelona (Spain);
25 Veiga, L. G. and Veiga, F. J. (2007), “Does opportunism pay off?”, Economics Letters, 96:177–
182;
Wooldridge, (2002), "Econometric analysis of Cross Section and Panel Data”, MIT Press.
Websites
Associação Nacional de Municípios Portugueses (ANMP): http://www.anmp.pt/;
Comissão Nacional de Eleições (CNE): http://www.cne.pt/;
Direção da Administração Eleitoral (DGAI): http://www.dgai.mai.gov.pt/;
Direção-Geral das Autarquias Locais (DGAL): http://www.portalautarquico.pt/portalautarquico/;
Instituto Geográfico Português (IGEO): http://mapas.igeo.pt/moodle/;
Instituto Nacional de Estatística (INE): www.ine.pt;
Governo de Portugal: http://www.portugal.gov.pt/pt.aspx;
26
Appendix
Norte Vila Nova de Foz Côa Pinhal Interior Sul Odemira
Minho-Lima Vila Real Mação Santiago do Cacém
Arcos de Valdevez Alto Trás-os-Montes Oleiros Sines
Caminha Alfândega da Fé Proença-a-Nova Alto Alentejo
Melgaço Boticas Sertã Alter do Chão
Monção Bragança Vila de Rei Arronches
Paredes de Coura Chaves Serra da Estrela Avis
Ponte da Barca Macedo de Cavaleiros Fornos de Algodres Campo Maior
Ponte de Lima Miranda do Douro Gouveia Castelo de Vide
Valença Mirandela Seia Crato
Viana do Castelo Mogadouro Beira Interior Norte Elvas
Vila Nova de Cerveira Montalegre Almeida Fronteira
Cávado Murça Celorico da Beira Gavião
Amares Valpaços Figueira de Castelo Rodrigo Marvão
Barcelos Vila Pouca de Aguiar Guarda Monforte
Braga Vimioso Manteigas Mora
Esposende Vinhais Meda Nisa
Terras de Bouro Centro Pinhel Ponte de Sor
Vila Verde Baixo Vouga Sabugal Portalegre
Ave Águeda Trancoso Alentejo Central
Fafe Albergaria-a-Velha Beira Interior Sul Alandroal
Guimarães Anadia Castelo Branco Arraiolos
Póvoa de Lanhoso Aveiro Idanha-a-Nova Borba
Santo Tirso Estarreja Penamacor Estremoz
Trofa Ílhavo Vila Velha de Ródão Évora
Vieira do Minho Mealhada Cova da Beira Montemor-o-Novo
Vila Nova de Famalicão Murtosa Belmonte Mourão
Vizela Oliveira do Bairro Covilhã Portel
Grande Porto Ovar Fundão Redondo
Espinho Sever do Vouga Oeste Reguengos de Monsaraz
Gondomar Vagos Alcobaça Sousel
Maia Baixo Mondego Alenquer Vendas Novas
Matosinhos Cantanhede Arruda dos Vinhos Viana do Alentejo
Porto Coimbra Bombarral Vila Viçosa
Póvoa de Varzim Condeixa-a-Nova Cadaval Baixo Alentejo
Valongo Figueira da Foz Caldas da Rainha Aljustrel
Vila do Conde Mira Lourinhã Almodôvar
Vila Nova de Gaia Montemor-o-Velho Nazaré Alvito
Tâmega Penacova Óbidos Barrancos
Amarante Soure Peniche Beja
Baião Pinhal Litoral Sobral de Monte Agraço Castro Verde
Cabeceiras de Basto Batalha Torres Vedras Cuba
Castelo de Paiva Leiria Médio Tejo Ferreira do Alentejo
Celorico de Basto Marinha Grande Abrantes Mértola
Cinfães Pombal Alcanena Moura
Felgueiras Porto de Mós Constância Ourique
Lousada Pinhal Interior Norte Entroncamento Serpa
Marco de Canaveses Alvaiázere Ferreira do Zêzere Vidigueira
Mondim de Basto Ansião Ourém Lezíria do Tejo
Paços de Ferreira Arganil Sardoal Almeirim
Paredes Castanheira de Pêra Tomar Alpiarça
Penafiel Figueiró dos Vinhos Torres Novas Azambuja
Resende Góis Vila Nova da Barquinha Benavente
Ribeira de Pena Lousã Lisboa Cartaxo
Entre Douro e Vouga Miranda do Corvo Grande Lisboa Chamusca
Arouca Oliveira do Hospital Amadora Coruche
Oliveira de Azeméis Pampilhosa da Serra Cascais Golegã
Santa Maria da Feira Pedrógão Grande Lisboa Rio Maior
São João da Madeira Penela Loures Salvaterra de Magos
Vale de Cambra Tábua Mafra Santarém
Douro Vila Nova de Poiares Odivelas Algarve
Alijó Dão-Lafões Oeiras Algarve
Armamar Aguiar da Beira Sintra Albufeira
Carrazeda de Ansiães Carregal do Sal Vila Franca de Xira Alcoutim
Freixo de Espada à Cinta Castro Daire Península de Setúbal Aljezur
Lamego Mangualde Alcochete Castro Marim
Mesão Frio Mortágua Almada Faro
Moimenta da Beira Nelas Barreiro Lagoa
Penedono Oliveira de Frades Moita Lagos
Peso da Régua Penalva do Castelo Montijo Loulé
Sabrosa Santa Comba Dão Palmela Monchique
Santa Marta de Penaguião São Pedro do Sul Seixal Olhão
São João da Pesqueira Sátão Sesimbra Portimão
Sernancelhe Tondela Setúbal São Brás de Alportel
Tabuaço Vila Nova de Paiva Alentejo Silves
Tarouca Viseu Alentejo Litoral Tavira
Torre de Moncorvo Vouzela Alcácer do Sal Vila do Bispo
Vila Flor Grândola Vila Real de Santo António
27 Graph 1: Box Plots of the number of consecutive mandates at election years. The graph displays the distribution of data based on 5
number summary: lower adjacent value, 25th percentile (lower hinge), median, 75th percentile (upper hinge), upper
adjacent value. Source: own elaboration from the data provided by the Comissão Nacional de Eleições (CNE).
Other Political Parties
Other registered parties are: Partido Comunista Português (PCP), Bloco de Esquerda (B.E.), Partido Popular
(CDS/PP), Partido Comunista dos Trabalhadores Portugueses (PCTP/MRPP), Partido Popular Monárquico (PPM),
Partido Operário de Unidade Socialista (POUS), Partido Democrático do Atlântico (PDA), Partido Ecologista "Os
Verdes" (PEV), Partido Nacional Renovador (PNR), Partido da Terra (MPT), Partido Humanista (P.H.), Nova
Democracia (PND), Partido Liberal Democrata (PLD), Partido Trabalhista Português (PTP), Portugal pro Vida (PPV),
Partido pelos Animais e pela Natureza (PAN), Movimento alternativa Socialista (MAS), Livre (L). Several of these are
fairly recent, and some parties appeared and disappeared during the analysed period (e.g. PRD – Partido Renovador
Democrático). None of them has, however, any local expression. The graph below shows the proportion of Portuguese
28 Graph: Proportion of municipalities governed by left wing parties (PS, PCP-PEV, APU, FEPU, BE, UDP, PCTP/MRPP). Source:
own elaboration from the data provided by the Comissão Nacional de Eleições (CNE).
(1) (2) (3) (4)
Reelection Reelection Reelection Reelection
D_Year4 -2.063*** -2.088***
(-7.69) (-7.30)
D_Year7 -1.589*** -1.829*** -2.475***
(-6.45) (-7.16) (-6.25)
D_Year10 -1.144*** -1.361***
(-4.96) (-5.68)
D_Year14 -1.144*** -1.169*** -1.464***
(-4.96) (-5.17) (-4.81)
D_Year18 -0.992*** -1.199*** -1.667***
(-4.49) (-5.30) (-5.53)
D_Year22 -0.739*** -0.883*** -1.255*** -0.919***
(-3.35) (-3.91) (-4.64) (-3.50)
D_Year26 -0.624** -0.717** -1.115*** -0.864**
(-2.82) (-3.18) (-4.14) (-3.22)
D_Year30 -0.0828 -0.145 -0.403 -0.121
(-0.37) (-0.65) (-1.62) (-0.51)
Table: Estimates and significance of the year dummies used to control for time fixed effects in the regressions 1, 2, 3 and 4 reported in the main text.
0 0,1 0,2 0,3 0,4 0,5 0,6 0,7
1976 1979 1982 1985 1989 1993 1997 2001 2005 2009
29
(7) (8) (9)
Reelection Reelectionorelectsameparty Reelection
Recandidate 7.361***
(7.00)
L.IMIshare -4.000 -0.119 -0.561
(-1.18) (-0.03) (-0.25)
L.Investmentshare 0.865 2.211** 2.538***
(0.85) (2.80) (3.33)
VoteShareprevious 0.0943*** 0.0647*** 0.0637***
(5.22) (6.37) (5.86)
LeftMun -0.694 0.644*** -0.145
(-1.75) (3.39) (-0.58)
SamePolParty -0.104 -0.876*** -0.232
(-0.29) (-5.31) (-0.97)
Mandateprevious -0.129 -0.580*** -0.175***
(-1.65) (-8.60) (-3.49)
AbstentionRate 0.0760*** 0.352
(3.65) (0.58)
L4.AbstentionRate 0.0140
(0.99)
DependencyRatio 0.0116 -0.0126
(0.74) (-1.32)
Age -0.0405* -0.0495***
(-2.20) (-4.18)
High_education -0.0196 0.135 0.0504
(-0.07) (0.71) (0.29)
Low_education 0.103 0.133 0.264
(0.24) (0.39) (0.92)
LnResidentPopulation 0.170 0.0531
(0.89) (0.43)
DeltaPPI 0.999 0.352
(0.88) (0.58)
D_Year7 -1.840***
(-4.19)
D_Year14 -1.342***
(-4.14)
D_Year18 -0.961**
(-3.03)
D_Year22 -0.743* -0.906***
(-2.51) (-3.46)
D_Year26 -1.014*** -0.912***
(-3.42) (-3.40)
D_Year30 -0.240 -0.175
(-0.82) (-0.73)
_cons -12.26*** 0.177
(-4.16) (0.11)
lnsig2u
_cons -11.89 -11.48
(-0.57) (-0.43)
N 923 1326 1004
Time Period 2001-2009 1981-2009 1997-2009
N.elections 3 7 4
Fixed effects N Y N
Random effects Y N Y