www.solid-earth.net/5/693/2014/ doi:10.5194/se-5-693-2014
© Author(s) 2014. CC Attribution 3.0 License.
Physicochemical changes in pyrogenic organic matter (biochar)
after 15 months of field aging
A. Mukherjee1,*, A. R. Zimmerman1, R. Hamdan2, and W. T. Cooper2
1Department of Geological Sciences, University of Florida, 241 Williamson Hall, P.O. Box 112120,
Gainesville, FL 32611, USA
2Department of Chemistry and Biochemistry, Florida State University, Tallahassee, FL 32306, USA *now at: School of Environment and Natural Resources, Carbon Management and Sequestration Center,
Ohio State University, 2021 Coffey Road, Columbus, OH 43210, USA Correspondence to:A. R. Zimmerman ([email protected])
Received: 12 February 2014 – Published in Solid Earth Discuss.: 10 March 2014 Revised: 4 June 2014 – Accepted: 6 June 2014 – Published: 23 July 2014
Abstract.Predicting the effects of pyrogenic organic matter (OM) addition (either natural or intentional as in the case of biochar amendment) on soil chemistry and crop yields has been hampered by a lack of understanding of how pyrogenic OM evolves in the environment over time. This work com-pared the physicochemical characteristics of newly made and 15-month-field-aged biochars and biochar–soil mixtures. Af-ter aging, biochars made by pyrolysis of wood and grass at 250, 400 and 650◦C exhibited 5-fold increases in cation
exchange capacity (CEC), on average; appearance of anion exchange capacity (AEC); and significant decreases in pH, ash content and nanopore surface area. Cross polarization
13C nuclear magnetic resonance (NMR) analyses indicated
relative increases in O-containing functional groups, includ-ing substituted aryl, carboxyl and carbonyl C, and losses of O-alkyl groups. Similar chemical trends were observed for soil–biochar mixtures, suggesting the same biochar aging processes occurred in the soil environment. However, there was evidence for a role of soil OM–microbe–biochar inter-action during aging. Field aging of soil with biochar resulted in large increases in C and N content (up to 124 and 143 %, respectively) and exchange capacity (up to 43 %) beyond that calculated by the weighted addition of the properties of biochar and soil aged separately. These beneficial interactive effects varied with soil and biochar type. Scanning electronic microscopy (SEM) images of biochar particles aged with soil showed colonization by microbes and widespread OM coat-ings. Thus, sorption of both microbially produced and soil OM are likely processes that enhanced biochar aging. Thus,
biochar’s full beneficial effects on soil properties likely in-crease over time, and proper assignment of C sequestration credits to biochar users will require consideration of soil– biochar interactions.
1 Introduction
Pyrogenic organic matter (OM), or black carbon, represents a large but poorly understood portion of global C cycling that may have played a role in climate changes, soil fertility and, now, pollutant fate and transport. Much recent work on un-derstanding the cycling of pyrogenic OM has been carried out using biochar, biomass pyrolyzed in an oxygen-limited environment. Research on biochar has accelerated because of its possible uses for soil C sequestration, soil amelioration or as an environmental sorbent. The characteristics of biochar that make it well suited to these purposes include its abundant and refractory OM (Glaser et al., 2001a, 2001b, 2002, 2004), high pH, high cation exchange capacity (CEC; Mukherjee et al., 2011), high surface area (SA) and high organic com-pound sorption affinity (Chen et al., 2012; Hale et al., 2011; Kasozi et al., 2010; Smernik, 2009). However these charac-teristics have been shown to vary a great deal among parent biomass types and biochar production conditions (Mukher-jee, 2011; Mukherjee et al., 2011).
2013; Cornelissen et al., 2013; Jeffery et al., 2011; Mukher-jee and Lal, 2014) and, in some cases, increases are only observed after several years or not at all (Gaskin et al., 2010; Jones et al., 2012; Kulmatiski and Beard, 2006; Liu et al., 2013a). Laboratory chemical aging or mixing with soil has been shown to decrease the capacity of biochar to sorb pyrene (Hale et al., 2011; Zhang et al., 2013), herbicides (e.g., diuron and atrazine) (Martin et al., 2012) and allelo-pathic compounds (Cheng and Lehmann, 2009), but increase immobilization of heavy metals (Uchimiya et al., 2010). And biochar’s impact on greenhouse gas (GHG) emissions also varies with time, sometimes increasing and sometimes de-creasing with biochar weathering (Mukherjee and Lal, 2013; Spokas, 2013). Thus, in order to better understand the long-term effects of pyrogenic OM and to predict the shorter-long-term effects of biochar amendment on soil chemistry, study of how biochar surface and bulk chemistry and physical, chemical and biological interactions with soil evolve over time is ur-gently needed.
In general, biochars newly produced at higher tempera-tures have higher pH, ash content and surface area (SA) and lower volatile matter (VM) and acidic functional group content than those produced at lower temperatures (Kim et al., 2013; Mukherjee, 2011; Mukherjee et al., 2011; Zhao et al., 2013). Increasing O / C and H / O ratios with production temperature indicate progressive depolymerization, loss of functional groups and dehydrogenation reactions resulting in more condensed aromatic structures (Baldock and Smernik, 2002; Keiluweit et al., 2010; Knicker, 2007).
Biochar chemistry may also be altered by a variety of time-dependent processes that occur in the environment, termed here as “aging”, including abiotic and biotic redox reactions, solubilization and interactions with microbes, OM, miner-als and solutes in the soil environment. For example, oxida-tion reacoxida-tions were suggested by strong correlaoxida-tions between rates of CO2production and O2consumption during
incuba-tions of a variety of biochars (Spokas and Reicosky, 2009). Also, analyses of laboratory-incubated or decades-old char-coal particles by titration and spectroscopic techniques have shown increasing amounts of O-containing functional groups with aging (Cheng et al., 2008; Cheng et al., 2006; Liang et al., 2006; Lin et al., 2012a, b; Nguyen et al., 2009). These changes were accompanied by increases in biochar CEC, dis-appearance of surface positive charge and formation of sur-face negative charge (Cheng et al., 2008).
Though temporal variability in GHG emission, contami-nant sorption and crop response to biochar amendment has been observed, their cause is poorly understood (Mukher-jee and Lal, 2014). Very few studies, if any, have examined changes in soil–biochar mixtures in the field using a range of biochar types. Further, parallel studies of separate and mixed biochar and soil aging have not yet been conducted so that properties evolved from soil–biochar interactions could be identified. Thus, this study fills these gaps by examining the bulk and surface chemical characteristics of a range of fresh
biochars and their aged counterparts. Both biochar alone and soil–biochar mixtures were field-aged for 15 months under north Florida climatic conditions which, with high tempera-tures and abundant rainfall, can be characterized as extreme. While previous studies have shown biotic and abiotic oxi-dation to occur during biochar aging, we hypothesize that leaching/solubilization and microbial OM production and sorption of soil OM also occurs, resulting in a range of new organic functional groups that will vary with biochar and soil type. The overarching goals of this project were to under-stand how biochar amendments of different types affect soil chemistry and, thus, fertility and C sequestration over longer timescales and to identify the types of biochar which may be better suited to specific purposes or soil types.
2 Materials and methods 2.1 Materials
Biochar was produced fromQuercus lobata(laurel oak: oak), Pinus taeda(loblolly pine: pine) andTripsacum floridanum (gamagrass: grass) by combusting for 3 h at highest treat-ment temperature (HTT) of 250◦
C in a closed oven with limited oxygen or 400 and 650◦
C in a pyrolyzer continu-ously flushed with 99 % pure gaseous N2(designated
here-after as oak-250, grass-650, etc.). The coarse size fraction (0.25–2 mm) of the biochars, separated by sieving and briefly rinsed with double-distilled water to remove soluble salts, was used for all experiments and analyses. Detailed informa-tion on biochar preparainforma-tion and chemical and physical char-acteristics of the freshly prepared biochars have been pre-sented elsewhere (Kasozi et al., 2010; Mukherjee et al., 2011; Zimmerman, 2010).
Duplicate samples of the nine biochars were “aged” by placing samples in 2.4 L plastic containers, screened above and below with 0.5 mm mesh metal screening as well as landscaping cloth above for shading (Blue Hawk™ fabric), so that weathering by air and precipitation, but not sunlight and macro-fauna, could occur over 15 months (June 2009– September 2010) in Gainesville, Florida. During this pe-riod in the region, the average temperature was 20.6◦
C and 92.1 cm of precipitation fell, all as rain, with 60 % occurring during the two 4-month periods from 1 May to 1 September of 2009 and 2010. Among the nine aged biochars, a subset of four biochars (oak and grass produced at 250 and 650◦C)
were analyzed in greater detail for characteristics such as CEC and anion exchange capacity (AEC) and were incubated in combination with soil.
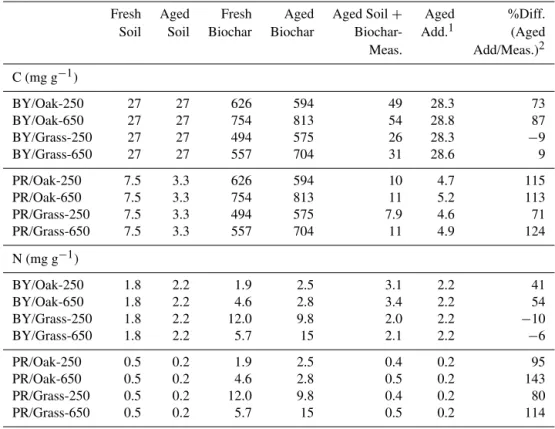
Table 1.Average concentrations of C and N in fresh and 15-month field-aged soils, biochars and soil/biochar mixtures (Meas.) and those predicted by the arithmetic weighted combination of fresh and aged biochar and soil (Add.).
Fresh Aged Fresh Aged Aged Soil+ Aged %Diff. Soil Soil Biochar Biochar Biochar- Add.1 (Aged Meas. Add/Meas.)2 C (mg g−1)
BY/Oak-250 27 27 626 594 49 28.3 73 BY/Oak-650 27 27 754 813 54 28.8 87 BY/Grass-250 27 27 494 575 26 28.3 −9 BY/Grass-650 27 27 557 704 31 28.6 9 PR/Oak-250 7.5 3.3 626 594 10 4.7 115 PR/Oak-650 7.5 3.3 754 813 11 5.2 113 PR/Grass-250 7.5 3.3 494 575 7.9 4.6 71 PR/Grass-650 7.5 3.3 557 704 11 4.9 124 N (mg g−1)
BY/Oak-250 1.8 2.2 1.9 2.5 3.1 2.2 41 BY/Oak-650 1.8 2.2 4.6 2.8 3.4 2.2 54 BY/Grass-250 1.8 2.2 12.0 9.8 2.0 2.2 −10 BY/Grass-650 1.8 2.2 5.7 15 2.1 2.2 −6 PR/Oak-250 0.5 0.2 1.9 2.5 0.4 0.2 95 PR/Oak-650 0.5 0.2 4.6 2.8 0.5 0.2 143 PR/Grass-250 0.5 0.2 12.0 9.8 0.4 0.2 80 PR/Grass-650 0.5 0.2 5.7 15 0.5 0.2 114
Notes/Abbreviations:
BY: agricultural Entisol, Gainesville, Florida, PR: forest Spodosol, Marion County, Florida, USA. 1Calculated as the weighted additive value of properties of aged biochar and aged soil.
2%Diff. (Aged Add/Meas.)=the difference between that predicted by the additive combination of the aged soil and aged biochar (Aged Add.) and that actually measured in the aged mixture (Aged Soil+Biochar-Meas.).
Microbiological characteristics of these soils with and with-out biochar amendment were published previously in Kho-dadad et al. (2011). The soils were integrated from the 0– 10 cm depth interval, sieved to 2 mm to remove plant roots and debris and air-dried for 4 days before fully homogenizing with the selected biochar by manually mixing in a large bowl. For each biochar type, 6 g biochar was mixed with 2.6 kg air-dried soil (0.23 % biochar by weight), which resulted in soil that had organic C that was 4–6 and 13.1–18.8 % pyrogenic and soil N that was 0.2–1.4 and 0.9–5.2 % pyrogenic for BY and PR, respectively. These mixtures of biochar and soil (or soil alone as a control) were apportioned into duplicate 2.4 L containers and screened as described above, but in this case the containers were buried to a depth of 20 cm so that soil in the containers was level with the native soil. These samples were in the field during the same 15-month period and were kept free from debris by periodic removal of forest litter and weeds from the area around the emplacement.
2.2 Analytical methods
The analytical methods used were standard methods adapted to the examination of the chemical and physical
characteris-tic of biochar and are described in detail elsewhere (Mukher-jee et al., 2011). Briefly, biochar VM content was quantified as weight loss after combustion in a ceramic crucible loosely covered with a ceramic cap at 850–900◦C for 6 min. Ash
content was determined as weight loss after combustion at 750◦
C for 6 h with no cover. The mesoporous (> 1.5 nm pore diameter) SA was measured using N2sorptometry at 77 K
us-ing Brunauer–Emmet–Teller (BET) theory (Brunauer, 1938), and microporous SA (< 1.5 nm pore diameter) was measured using CO2sorptometry at 273 K and grand canonical Monte
Carlo simulations of the non-local density functional theory (Jagiello and Thommes, 2004).
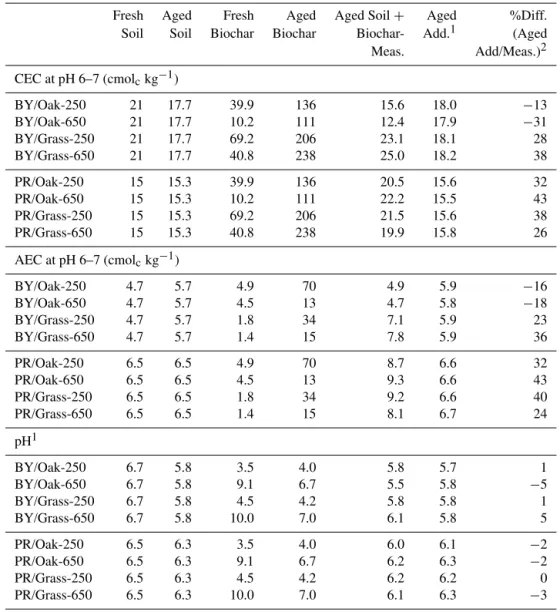
Table 2.Average cation and anion exchange capacity and pH of fresh and field-aged soils, biochars and soil/biochar mixtures (Meas.) and those predicted by the arithmetic weighted combination of each biochar and soil (Add.).
Fresh Aged Fresh Aged Aged Soil+ Aged %Diff. Soil Soil Biochar Biochar Biochar- Add.1 (Aged Meas. Add/Meas.)2 CEC at pH 6–7 (cmolckg−1)
BY/Oak-250 21 17.7 39.9 136 15.6 18.0 −13 BY/Oak-650 21 17.7 10.2 111 12.4 17.9 −31 BY/Grass-250 21 17.7 69.2 206 23.1 18.1 28 BY/Grass-650 21 17.7 40.8 238 25.0 18.2 38 PR/Oak-250 15 15.3 39.9 136 20.5 15.6 32 PR/Oak-650 15 15.3 10.2 111 22.2 15.5 43 PR/Grass-250 15 15.3 69.2 206 21.5 15.6 38 PR/Grass-650 15 15.3 40.8 238 19.9 15.8 26 AEC at pH 6–7 (cmolckg−1)
BY/Oak-250 4.7 5.7 4.9 70 4.9 5.9 −16 BY/Oak-650 4.7 5.7 4.5 13 4.7 5.8 −18 BY/Grass-250 4.7 5.7 1.8 34 7.1 5.9 23 BY/Grass-650 4.7 5.7 1.4 15 7.8 5.9 36 PR/Oak-250 6.5 6.5 4.9 70 8.7 6.6 32 PR/Oak-650 6.5 6.5 4.5 13 9.3 6.6 43 PR/Grass-250 6.5 6.5 1.8 34 9.2 6.6 40 PR/Grass-650 6.5 6.5 1.4 15 8.1 6.7 24 pH1
BY/Oak-250 6.7 5.8 3.5 4.0 5.8 5.7 1 BY/Oak-650 6.7 5.8 9.1 6.7 5.5 5.8 −5 BY/Grass-250 6.7 5.8 4.5 4.2 5.8 5.8 1 BY/Grass-650 6.7 5.8 10.0 7.0 6.1 5.8 5 PR/Oak-250 6.5 6.3 3.5 4.0 6.0 6.1 −2 PR/Oak-650 6.5 6.3 9.1 6.7 6.2 6.3 −2 PR/Grass-250 6.5 6.3 4.5 4.2 6.2 6.2 0 PR/Grass-650 6.5 6.3 10.0 7.0 6.1 6.3 −3
Notes/Abbreviations:
Abbreviations used are those listed for Table 1.
1Additive values were calculated after converting pH to H+concentrations, which were then converted back to pH units.
as determined to be sufficient previously (Mukherjee et al., 2011). Soil pH was measured by mixing 10 g of soil with 20 mL water (1 : 2 v / v) and was recorded after 1 h equili-bration time. Biochar and soil CEC and AEC were deter-mined between a pH of 6 and 7 as detailed in Mukherjee et al. (2011), whereby all surface ions were replaced with K+
and Cl−ions and then fully exchanged with ions of NaNO 3.
The CEC and AEC were calculated from the amount of K+
and Cl−released, respectively, after accounting for entrained
ions. Each of the above analyses was made twice on each sample.
Solid-state13C nuclear magnetic resonance (NMR) spec-tra were obtained with a wide-bore Varian Inova 500 MHz spectrometer operated at 125 MHz for carbon. Each sam-ple was packed in a 4 mm outside diameter zirconium
140–160 ppm (substituted aryl, including primarily phenolic C and methoxy C in hydroquinones), 160–190 (carboxyl C in substituted/condensed acids and esters) and 190–245 ppm (carbonyl C in substituted/condensed amides, ketones and aldehydes).
The NMR spectra were acquired using CP rather than the more quantitative direct polarization (DP) technique be-cause of the extremely long acquisition times required in the latter. We recognize that CP NMR spectra will under-estimate unprotonated carbon, and especially any carbon far from protons. Comparing these CP spectra with quantitative DP spectra (> 95 % C observed) obtained on the same fresh biochars (Podgorski et al., 2012) suggests that∼75 % of the
carbon in these samples were observed in the CP experi-ments. Thus, while the NMR results should only be consid-ered semi-quantitative and are not useful in describing ab-solute functional group concentrations, these data are useful in comparing biochar types because calculations of the rela-tive changes in each functional group normalize for variable carbon observability.
Scanning electron microscopy (SEM) images of the fresh and aged biochar particles were collected on an EVO MA10 (Zeiss®) equipped with a variable-pressure secondary elec-tron detector which can dynamically image partially hy-drated samples. The samples were dried at 60◦
C for 48 h but were not coated or pre-treated in any other way. At least five particles were randomly selected and examined from each homogenized sample, and attempts were made to present representative images.
2.3 Statistical analyses
All of the data are presented as mean ±standard deviation of duplicate analyses of duplicate treatments except in the case of CEC, AEC and NMR analyses, for which only one of the treatments was analyzed. Means, standard deviations and regression correlation coefficients were computed using Microsoft 2003 Excel software (MS, 2003). Type 1 paired t tests were performed using Excel data analyses tool pack (MS, 2003) in order to test for significant differences be-tween means of various parameters. Statistical differences in variables resulting from treatments were assessed using PROC-GLM in the SAS software (SAS, 2012) by three-way ANOVA with up to 2-way interactions for most variables and 2-way ANOVA without interaction for other variables, such as CEC, with only two replicate analyses.
3 Results
The chemical characteristic of the soils and freshly produced biochars are listed in the two left-most columns of Tables 1 and 2 and in greater detail in Supplement data Tables S1– S4. These samples have been discussed in detail elsewhere (Mukherjee et al., 2011; Zimmerman, 2010). The following
focuses on the properties of aged biochars and the differences between the properties of fresh and 15-month-aged biochar.
3.1 Characteristics of biochars aged alone
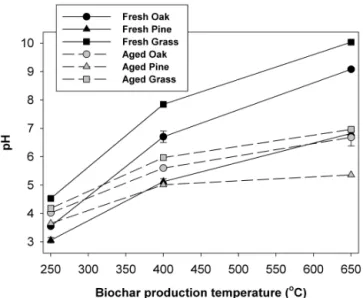
As with freshly produced biochars (Mukherjee et al., 2011; Zimmerman, 2010), the physicochemical characteristics of aged biochar varied most clearly with HTT. For example, both fresh and aged biochars exhibited significant increases in C, N and H content with HTT (Table 3 and Supplement Table S1). For both fresh and aged biochars, pH, ash content and surface area (nanopore and micropore) increased with HTT, while VM decreased with HTT. The prominent trends related to parent biomass type found in fresh biochars, such as the increase in pH and ash content from pine to oak to grass, were also found in aged biochars (Table 3, Fig. 1). This was also true for C content that increased and CEC that decreased from grass to pine to oak (Table 3).
Aging had a significant effect on some of biochar’s charac-teristics but not on others. Overall, the the 15-month field ag-ing only had a significant effect on biochar pH and nanopore SA, which decreased, and CEC, which increased (Table 3 and ANOVA analysis results in Supplement Table S4). Other effects of aging were limited to groups of biochars made with specific production temperatures of biomass types. For ex-ample, only high-temperature biochars and grass biochars displayed a significant increase in C content and only low-temperature biochar displayed a significant increase in ash content with aging. Another large change was that, while fresh biochars were found to have little AEC (measured at pH 6–7), that of aged biochars was considerable, ranging 24.9–106.1 cmolckg−1(Fig. 2a). The abundances of other
el-ements such as S, B, Zn, Mn, Fe and Cu ranged between 0 and 0.6 mg g−1and did not show any significant trends with
HTT, biomass type or aging (Supplement Table S2). The distribution of organic functional groups in fresh and aged oak and grass biochars made at 250 and 650◦
C, as determined by solid-state 13C NMR, are shown in Fig. 3 and full chemical shift spectra are provided in Supplement Figs. S1 and S2. Though only semi-quantitative, they show the greatest effect of aging on biochar bulk chemistry to be the loss of methoxy and O-alkyl C groups, probably associ-ated with carbohydrates. All the biochars showed gains in the relative abundance of other O-containing C groups with ag-ing, including substituted aryl, carboxyl and carbonyl C. In contrast, relative changes in alkyl C and aryl C group abun-dances with aging were small and did not vary consistently with biochar HTT or biomass type.
The significant interrelationships found between the prop-erties of aged biochar (Supplement Table S5) were similar to those found for fresh biochars (Supplement Table S6), which may reflect their common strong dependence upon HTT. For example, in both fresh and aged biochars, VM content was inversely related to both pH and CO2SA and directly related
Table 3.Mean values of various parameters for fresh and aged biochars as a whole (n=18) and grouped. The difference between fresh and aged biochar is significant, computed by Type-1, pairedT test, atp <0.1 when underlined and onlyp <0.05 level when also with an asterisk.
Biochar pH VM Ash N2-SA CO2-SA C O/C CEC
Group (%) (%) (m2g−1) (m2g−1) (mg g−1) (cmolckg−1)
Fresh Aged Fresh Aged Fresh Aged Fresh Aged Fresh Aged Fresh Aged Fresh Aged Fresh Ageda
Overall 6.3 5.3 49.6 50.8 5.1 3.9 63.2 9.4 351 343 617 667 0.5 0.5 26.2* 173*
250◦C 3.7 4.0 63.2 65.0 2.8* 3.6* 1.6 1.9 277 232 581 576 0.8 0.7 43.6* 171*
400◦C 6.5 5.5 54.0 55.5 5.4 3.8 3.7 1.4 252 247 653 660 0.5 0.5 13.8 –
650◦C 8.6* 6.4* 31.5 31.9 6.9 4.4 184* 25* 523 550 621 766 0.3 0.5 18.4* 174*
Oak 6.4 5.4 51.4 48.6 2.6 2.4 76 12 351 349 686 706 0.5 0.4 18.4* 123*
Pine 5.0 4.7 48.3 50.5 0.6 0.8 86 1 423 349 645 658 0.4 0.7 22.7 –
Grass 7.4 5.7 49.0 53.3 12.0 8.6 28 15 278 331 525* 638* 0.6* 0.5* 37.4 222
Abbreviations: SA=surface area, VM=volatile matter, CEC=cation exchange capacity measured at pH 6–7.
an=4
Figure 1.Relationship between pH and biochar production temper-ature for a range of fresh and aged biochars. Error bar shows the standard deviation of two replicate analyses.
among the variables measured for all the biochars pooled (Supplement Table S7), showing that aged biochar proper-ties were distinct from those of fresh ones.
3.2 Characteristics of soil–biochar mixtures
The chemical characteristics of the control soil and the soil– biochar mixtures after 15 months of field aging are listed in Tables 1 and 2 in the columns labeled “Aged Soil” and “Aged Soil +Biochar (Meas.)”, respectively. While the C and N
contents of the BY control soil were little changed after the aging period, those of the PR soil decreased by about half, likely due to the disturbance (drying/rewetting, homogeniza-tion, etc). Soils mixed with biochar had, unsurprisingly, sig-nificantly greater C contents both initially and after aging. This was also true for N content in most cases.
Figure 2.Cation and anion exchange capacities (CEC and AEC, respectively) measured at pH 6–7 on(a)fresh and “aged” oak and grass biochars produced at 250 and 650◦C, and(b)aged BY soil
and BY soil–biochar mixtures.
Though the CEC of biochar aged separately was quite high, that of the aged soil–biochar mixtures was not much higher, and in fact was sometimes lower, than the origi-nal soil (15.6–25.0 and 19.9–22.2 cmolckg−1, for aged BY
and PR soil, respectively, Table 2). In contrast, the AEC of the aged soil–biochar mixtures was always the same or greater than that of the original soil, ranging 4.9–7.8 and 8.1–9.3 cmolckg−1 for aged BY and PR soil, respectively.
After aging, soil mixed with biochar, even those of higher pH, showed a decrease in pH, all falling within a narrow pH range (5.5–6.2, Table 2).
Figure 3.Relative functional group distributions determined by13C CP-MAS NMR for fresh and aged(a)oak-250, (b)oak-650, (c)
grass-250 and(d)grass-650 biochars.
OM or microbial exudates. These were present in nearly all randomly chosen images of the charcoal particles. Filamen-tous and hyphal microorganisms were also observed less fre-quently on the outer surfaces of both biochar aged alone and when mixed with soil (Fig. 4c).
4 Discussion
4.1 Aging processes of biochar alone
The variations in physicochemical effects due to aging of the different biochar types observed in this study can explain some of the contradictory findings of previous biochar aging studies using laboratory incubations or examination of envi-ronmental charcoals. For example, little effect on biochar ele-mental composition was found after laboratory-simulated ag-ing (Hale et al., 2011; Yao et al., 2010). In contrast, a signifi-cant decrease in C and increase in O were found after 1 year of moist aging of “traditionally made” oak biochars at tem-peratures ranging from−22 to 70◦C (Cheng and Lehmann,
2009). Changes in bulk chemistry that occurred during ag-ing were shown in the present study to vary with both parent material and production temperature (Supplement Table S4). This is also true of changes in surface area (Table 3). Al-though this study and others (Hale et al., 2011; Liu et al., 2013b) have found great variations between biochar types, the most common effect of aging on biochar surface struc-ture is a decrease in nanopore SA (but little change in sub-nanopore SA). This may be due to pore blockage by dissolu-tion and re-precipitadissolu-tion of inorganic minerals as only sparse coverage by microbes or OM coatings was observed in the SEM images (Fig. 4).
Figure 4.Representative scanning electron micrographs of fresh oak-250 and oak-650 biochar (aandb, respectively), and oak-650 biochar field-aged alone(c)and with soil(d). Scale bars=10 µm
(a)and 5 µm(b–d). Putative occoid microbes are indicated with arrows.
Decreases in pH during biochar aging of biochar has been observed previously (Cheng and Lehmann, 2009; Cheng et al., 2006) and has been explained as being due to dissolution of basic species such as carbonates or (oxy)hydroxides (Yao et al., 2010). However, in the current study, no significant decrease in base cation contents (other than potassium) after aging was detected, and significant inverse correlations were found between pH and O / C of aged biochar (Supplement Table S5). Thus, surface acidity is likely to have been gener-ated through extensive oxidation, which is also supported by the ion exchange and NMR data. Increase in biochar acidity has been previously attributed to the abiotic chemisorption of oxygen and/or water from air onto biochar surfaces over time (Adams et al., 1988; Billinge et al., 1984; Cheng et al., 2006).
The increase in ion exchange sites with biochar aging in-dicated by the CEC and AEC data may be due either to pro-gressive abiotic oxidation of surface functional groups (for CEC) or to precipitation of minerals on the biochar surfaces as has been suggested by other work (Joseph et al., 2010). In fact, the CEC and AEC of these aged biochars are 10 times greater than those of most soils and more similar to those of soil humic acids (Harada and Inoko, 1975). However, aged biochars were previously reported to have no detectable AEC and to have CECs about 10 times less than that measured in the present study (Cheng and Lehmann, 2009; Cheng et al., 2006, 2008). It may be that, in contrast to laboratory studies, the aging recorded here was more intense and microbial colo-nization encouraged to a greater extent by the humid tropical climate of the study site.
substituted aromatic, carboxyl and carbonyl C (Fig. 3). Amide functional groups may be among those detected as a carbonyl C group and could be responsible for the increased AEC of aged biochar. Increases in relative abundances of car-boxyl C and carbonyl C were previously detected on aged biochar surfaces using Fourier transform infrared (FT-IR) and XPS spectroscopy (Cheng and Lehmann, 2009; Cheng et al., 2006, 2008; Lin et al., 2012b) and in bulk biochar us-ing13C NMR (Hilscher and Knicker, 2011; Yao et al., 2010). However, none of these studies detected increases in sub-stituted aromatic (e.g., phenols, quinones and lactones), and one study even recorded major decreases in these functional groups during biochar aging (Nguyen et al., 2008). These groups are of particular significance in that they are inter-mediates in the formation of soil humic substances accord-ing to the polyphenol formation theory (Stevenson, 1994). In addition, these compounds serve as electron acceptors for microbial respiration (Scott et al., 1998).
In this study, the largest shift in biochar molecular chem-istry indicated by NMR due to aging was the loss of methoxy and O-alkyl C, probably associated with carbohydrates. One previous study that examined biochar aging in leached soil columns over 28 months recorded similar large losses in O-alkyl C (Hilscher and Knicker, 2011), whereas all other stud-ies either found no change or increases in these groups. De-creases in polysaccharides have been observed previously in soil OM aging experiments and have been attributed either to microbial decomposition (Baldock et al., 1992; Zech et al., 1992) or to solubilization and loss of carbohydrates dur-ing rewettdur-ing cycles (Preston et al., 1989; Schmidt et al., 1997). Loss of carbohydrates via solubilization seems the more likely explanation here since the O-alkyl C fraction is in much greater abundance in the low-HTT biochar, which also showed the greatest losses of organic C and N during labo-ratory successive leaching experiments conducted with the same biochars (Mukherjee and Zimmerman, 2013). Many of the biochar aging studies that did not record these losses (e.g., Cheng and Lehmann, 2009; Cheng et al., 2006; Yao et al., 2010) were laboratory incubation studies in soil without water flow-through and, thus, may have shown greater effects of soil OM sorption versus leaching.
As a whole, the data suggest the creation or transforma-tion of a wide range of functransforma-tional groups on biochar surfaces during aging. Evidence for the occurrence of a combination of aging processes is present in the evolution of biochar’s exchange capacities, both CEC and AEC. In fresh biochars, VM content was judged to be mainly responsible for its CEC (Mukherjee et al., 2011). However, biochar CEC increased after 1 year of aging, though there was no significant change in VM content during this time frame. Further, the CEC of aged low- and high-temperature biochars was similar, though the VM content of the former was much greater. Thus, a dif-ferent process, or more likely a combination of processes, must be responsible for the enhanced exchange capacity of aged biochars. The similarity of aged biochar CEC to that
of soil humic substances and the appearance of AEC suggest that biochar aging processes include (1) addition and con-version of a wide variety of oxygen-containing functional groups by abiotic and microbially mediated oxidation, (2) leaching loss of more soluble biochar organic components and, to a lesser extent, (3) sorption of microbially derived OM onto biochar surfaces.
4.2 Aging processes in soil–biochar mixtures
Though biochar CEC and AEC increased significantly when aged alone, they were predicted to have only a small effect on the ion exchange capacities of the soil–biochar mix-tures due to the small amount of biochar added (“Aged Add.” column in Table 2). However, except in the case of BY soil mixed with oak biochar, the interaction of biochars with soil during aging resulted in 26–43 % increases in CEC and 21– 41 % increases in AEC beyond those predicted. The greater production of ion exchange capacity could be explained, as with C and N, by the additional storage of soil or biochar-derived OM. However, this would be expected to increase ex-change capacity the most in those soils with the greatest C in-crease (BY–oak mixtures). Thus, ion exchange capacity was increased through microbially mediated oxidation of biochar, which was stimulated to the greatest extent in the sandier agricultural soil with a lower native C content and by addi-tions of grass biochars (Table 2), which release greater nutri-ents than oak biochars (Mukherjee and Zimmerman, 2013). No consistent interaction was calculated for pH suggesting a possible buffering effect by biochar–soil mixtures.
Clearly, predicting the longer-term impacts of biochar ad-dition on soil chemistry is not a simple case of proportional mixing of two substances with different starting composi-tions. Even after the chemical effects of aging of each sepa-rate material are accounted for, interactions between biochar and soil occurred, likely including microbial colonization and OM production, soil and biochar OM remineralization, leaching and sorption during aging of biochar–soil mixtures. This wide range of processes, which would be expected to vary in extent with time and be both biochar- and soil-type-dependent, may explain why both increases and decreases in soil C and biochar C were observed in this study and others (Hilscher and Knicker, 2011; Lin et al., 2012b; Nguyen and Lehmann, 2009; Spokas, 2013; Yao et al., 2010).
5 Significance
The findings of this study have important implications for agricultural soils amended with biochar as well as natu-ral systems subjected to repeated burning events. First, they show that aging of biochar and biochar–soil mixtures is in-volved in producing or enhancing many of the beneficial properties of biochar-amended soil, including fertility and C sequestration enhancement. For example, increases in ex-change capacity over time may increase crop yields by de-creasing losses of nutrients and organic matter, and increased abundance of certain functional groups, such as phenols and quinones, may encourage the humification process. The in-teraction between aged biochar and soil generally magni-fied the development of these beneficial properties and sug-gest the involvement of soil microbes and native soil OM in obtaining the full benefits of biochar for soil amelioration. Whether these aging processes continue along these same
trends with greater passage of time is an important area for further research.
Whether for modeling the effects of natural or anthro-pogenic biomass burning on atmosphere CO2concentrations
or for assigning C credits to those practicing large-scale soil amendment projects, better assessment of the effects of py-rogenic C additions on soil C dynamics is needed. In doc-umenting increases in soil C beyond those expected merely from the addition of biochar C, this study shows that sim-ple C addition metrics, even when biochar C mineraliza-tion rates are factored in, may be inadequate as estimates of biochar’s atmosphere C drawdown effect. Though positive priming (enhanced losses of soil OM due to biochar addi-tion, or vice versa) has been observed in incubation studies (Steinbeiss et al., 2009; Wardle et al., 2008), this study, using a field approach, suggests the importance of negative prim-ing (reduced soil C losses due to biochar interaction) as has been observed in some long-term laboratory incubation stud-ies (Jones et al., 2011a, b; Santos et al., 2012; Zimmerman et al., 2011).
The Supplement related to this article is available online at doi:10.5194/se-5-693-2014-supplement.
Acknowledgements. This study was supported by a grant from NSF – EAR #0819706, Geobiology and Low Temperature Geochemistry Program to ARZ and WC.
Edited by: J. Paz-Ferreiro
References
Adams, L. B., Hall, C. R., Holmes, R. J., and Newton, R. A.: An ex-amination of how exposure to humid air can result in changes in the adsorption properties of activated carbons, Carbon, 26, 451– 459, 1988.
Baldock, J. A. and Smernik, R. J.: Chemical composition and bioavailability of thermally, altered Pinus resinosa (Red Pine) wood, Org. Geochem., 33, 1093–1109, 2002.
Baldock, J. A., Oades, J. M., Waters, A. G., Peng, X., Vas-sallo, A. M., and Wilson, M. A.: Aspects of the chemical struc-ture of soil organic materials as revealed by solid-state13C NMR spectroscopy, Biogeochemistry, 16, 1–42, 1992.
Biederman, L. A. and Harpole, W. S.: Biochar and its effects on plant productivity and nutrient cycling: a meta-analysis, Change Biol. Bioenerg., 5, 202–214, 2013.
Billinge, B. H. M., Docherty, J. B., and Bevan, M. J.: The desorption of chemisorbed oxygen from activated carbons and its relation-ship to ageing and methyl iodide retention efficiency, Carbon, 22, 83–89, 1984.
Brunauer, S., Emmett, P. H., and Teller, E.: Adsorption of gases in multimolecular layers, J. Am. Chem. Soc., 60, 309–319, 1938. Chen, Z. M., Chen, B. L., and Chiou, C. T.: Fast and slow rates of
naphthalene sorption to biochars produced at different tempera-tures, Environ. Sci. Technol., 46, 11104–11111, 2012.
Cheng, C. H. and Lehmann, J.: Ageing of black carbon along a tem-perature gradient, Chemosphere, 75, 1021–1027, 2009. Cheng, C. H., Lehmann, J., Thies, J. E., Burton, S. D., and
En-gelhard, M. H.: Oxidation of black carbon by biotic and abiotic processes, Org. Geochem., 37, 1477–1488, 2006.
Cheng, C. H., Lehmann, J., and Engelhard, M. H.: Natural oxidation of black carbon in soils: changes in molecular form and surface charge along a climosequence, Geochim. Cosmochim. Ac., 72, 1598–1610, 2008.
Cornelissen, G., Martinsen, V., Shitumbanuma, V., Alling, V., Breedveld, G., Rutherford, D., Sparrevik, M., Hale, S., Obia, A., and Mulder, J.: Biochar effect on maize yield and soil character-istics in five conservation farming sites in Zambia, Agronomy, 3, 256–274, 2013.
Gaskin, J. W., Speir, R. A., Harris, K., Das, K. C., Lee, R. D., Morris, L. A., and Fisher, D. S.: Effect of peanut hull and pine chip biochar on soil nutrients, corn nutrient status, and yield, Agron. J., 102, 623–633, 2010.
Glaser, B., Guggenberger, G., and Zech, W.: Black carbon in sus-tainable soils of the Brazilian Amazon region, in: Understanding and Managing Organic Matter in Soils, Sediments and Waters,
edited by: Swift, R. S. and Spark, K. M., International Humic Substances Society, St. Paul, MN, 2001a.
Glaser, B., Haumaier, L., Guggenberger, G., and Zech, W.: The “Terra Preta” phenomenon: a model for sustainable agriculture in the humid tropics, Naturwissenschaften, 88, 37–41, 2001b. Glaser, B., Lehmann, J., and Zech, W.: Ameliorating physical and
chemical properties of highly weathered soils in the tropics with charcoal – a review, Biol. Fert. Soils, 35, 219–230, 2002. Glaser, B., Zech, W., and Woods, W. I.: History, current knowledge
and future perspectives of geoecological research concerning the origin of Amazonian anthropogenic dark earths (Terra Preta), in: Amazonian Dark Earths: Explorations in Space and Time, edited by: Glaser, B. and Woods, W. I., Springer, Berlin, New York, 2004.
Hale, S. E., Hanley, K., Lehmann, J., Zimmerman, A. R., and Cor-nelissen, G.: Effects of chemical, biological, and physical aging as well as soil addition on the sorption of pyrene to activated car-bon and biochar, Environ. Sci. Technol., 45, 10445–10453, 2011. Hamdan, R., El-Rifai, H. M., Cheesman, A. W., Turner, B. L., Reddy, K. R., and Cooper, W. T.: Linking phosphorus seques-tration to carbon humification in wetland soils by 31P and 13C NMR spectroscopy, Environ. Sci. Technol., 46, 4775–4782, 2012.
Harada, Y. and Inoko, A.: Cation-exchange properties of soil or-ganic matter, I. Effects of conditions for the measurement on cation-exchange capacity values of humic acid preparations, Soil Sci. Plant Nutr., 21, 361–369, 1975.
Hilscher, A. and Knicker, H.: Carbon and nitrogen degradation on molecular scale of grass-derived pyrogenic organic material dur-ing 28 months of incubation in soil, Soil Biol. Biochem., 43, 261–270, 2011.
Jagiello, J. and Thommes, M.: Comparison of DFT characterization methods based on N2, Ar, CO2, and H2adsorption applied to carbons with various pore size distributions, Carbon, Carbon ’03 Conference, 42, 1227–1232, 2004.
Jeffery, S., Verheijen, F. G. A., van der Velde, M., and Bastos, A. C.: A quantitative review of the effects of biochar application to soils on crop productivity using meta-analysis, Agr. Ecosyst. Environ., 144, 175–187, 2011.
Jones, D. L., Edwards-Jones, G., and Murphy, D. V.: Biochar medi-ated alterations in herbicide breakdown and leaching in soil, Soil Biol. Biochem., 43, 804–813, 2011a.
Jones, D. L., Murphy, D. V., Khalid, M., Ahmad, W., Edwards-Jones, G., and DeLuca, T. H.: Short-term biochar-induced in-crease in soil CO2release is both biotically and abiotically
me-diated, Soil Biol. Biochem., 43, 1723–1731, 2011b.
Jones, D. L., Rousk, J., Edwards-Jones, G., DeLuca, T. H., and Mur-phy, D. V.: Biochar-mediated changes in soil quality and plant growth in a three year field trial, Soil Biol. Biochem., 45, 113– 124, 2012.
Kasozi, G. N., Zimmerman, A. R., Nkedi-Kizza, P., and Gao, B.: Catechol and humic acid sorption onto a range of laboratory-produced black carbons (biochars), Environ. Sci. Technol., 44, 6189–6195, 2010.
Keiluweit, M., Nico, P. S., Johnson, M. G., and Kleber, M.: Dy-namic molecular structure of plant biomass-derived black carbon (biochar), Environ. Sci. Technol., 44, 1247–1253, 2010. Khodadad, C. L. M., Zimmerman, A. R., Green, S. J., Uthandi, S.,
commu-nity composition induced by pyrogenic carbon amendments, Soil Biol. Biochem., 43, 385–392, 2011.
Kim, P., Johnson, A. M., Essington, M. E., Radosevich, M., Kwon, W. T., Lee, S. H., Rials, T. G., and Labbe, N.: Effect of pH on surface characteristics of switchgrass-derived biochars produced by fast pyrolysis, Chemosphere, 90, 2623–2630, 2013.
Knicker, H.: How does fire affect the nature and stability of soil organic nitrogen and carbon?, a review, Biogeochemistry, 85, 91– 118, 2007.
Kögel-Knabner, I.: The macromolecular organic composition of plant and microbial residues as inputs to soil organic matter, Soil Biol. Biochem., 34, 139–162, 2002.
Kulmatiski, A. and Beard, K. H.: Activated carbon as a restoration tool: potential for control of invasive plants in abandoned agri-cultural fields, Restor. Ecol., 14, 251–257, 2006.
Lehmann, J., Rillig, M. C., Thies, J., Masiello, C. A., Hockaday, W. C., and Crowley, D.: Biochar effects on soil biota – A review, Soil Biol. Biochem., 43, 1812–1836, 2011.
Liang, B., Lehmann, J., Solomon, D., Kinyangi, J., Grossman, J., O’Neill, B., Skjemstad, J. O., Thies, J., Luizao, F. J., Petersen, J., and Neves, E. G.: Black carbon increases cation exchange capac-ity in soils, Soil Sci. Soc. Am. J., 70, 1719–1730, 2006. Lin, Y., Munroe, P., Joseph, S., and Henderson, R.: Migration of
dissolved organic carbon in biochars and biochar-mineral com-plexes, Pesqui. Agropecu. Bras., 47, 677–686, 2012a.
Lin, Y., Munroe, P., Joseph, S., Kimber, S., and Van Zwieten, L.: Nanoscale organo-mineral reactions of biochars in ferrosol: an investigation using microscopy, Plant Soil, 357, 369–380, 2012b. Liu, X. Y., Zhang, A. F., Ji, C. Y., Joseph, S., Bian, R. J., Li, L. Q., Pan, G. X., and Paz-Ferreiro, J.: Biochar’s effect on crop pro-ductivity and the dependence on experimental conditions-a meta-analysis of literature data, Plant Soil, 373, 583–594, 2013a. Liu, Z. Y., Demisie, W., and Zhang, M. K.: Simulated degradation
of biochar and its potential environmental implications, Environ. Pollut., 179, 146–152, 2013b.
Martin, S. M., Kookana, R. S., Van Zwieten, L., and Krull, E.: Marked changes in herbicide sorption–desorption upon ageing of biochars in soil, J. Hazard. Mater., 231–232, 70–78, 2012. MS, M.O.X.: Excel, Microsoft, Redmond, WA, 2003.
Mukherjee, A.: Physical and Chemical Properties of a Range of Laboratory-Produced Fresh and Aged Biochars, 2011, Doctoral Dissertation, Geological Sciences, Doctoral Dissertation, Uni-versity of Florida, Gainesville, Florida, 2011.
Mukherjee, A. and Lal, R.: The biochar dilemma, Soil Res., 52, 217–230, 2014.
Mukherjee, A. and Lal, R.: Biochar impacts on soil physical prop-erties and greenhouse gas emissions, Agronomy, 3, 313–339, 2013a.
Mukherjee, A. and Zimmerman, A. R.: Organic carbon and nutri-ent release from a range of laboratory-produced biochars and biochar–soil mixtures, Geoderma, 193–194, 122–130, 2013b. Mukherjee, A., Zimmerman, A. R., and Harris, W. G.: Surface
chemistry variations among a series of laboratory-produced biochars, Geoderma, 163, 247–255, 2011.
Nguyen, B. T. and Lehmann, J.: Black carbon decomposition under varying water regimes, Org. Geochem., 40, 846–853, 2009. Nguyen, B., Lehmann, J., Kinyangi, J., Smernik, R., Riha, S., and
Engelhard, M.: Long-term black carbon dynamics in cultivated soil, Biogeochemistry, 89, 295–308, 2008.
Nguyen, B. T., Lehmann, J., Hockaday, W. C., Joseph, S., and Masiello, C. A.: Temperature sensitivity of black carbon decom-position and oxidation, Environ. Sci. Technol., 44, 3324–3331, 2010.
Nguyen, B. T., Lehmann, J., Kinyangi, J., Smernik, R., Riha, S. J., and Engelhard, M. H.: Long-term black carbon dynamics in cul-tivated soil, Biogeochemistry, 92, 163–176, 2009.
Paz-Ferreiro, J., Fu, S. L., Mendez, A., and Gasco, G.: Interactive effects of biochar and the earthwormPontoscolex corethruruson plant productivity and soil enzyme activities, J. Soils Sed., 14, 483–494, 2014.
Podgorski, D. C., Hamdan, R., McKenna, A. M., Nyadong, L., Rodgers, R. P., Marshall, A. G., and Cooper, W. T.: Characteriza-tion of pyrogenic black carbon by desorpCharacteriza-tion atmospheric pres-sure photoionization fourier transform ion cyclotron resonance mass spectrometry, Anal. Chem., 84, 1281–1287, 2012. Preston, C. M., Schnitzer, M., and Ripmeester, J. A.: A
spectro-scopic and chemical investigation on the de-ashing of a humin, Soil Sci. Soc. Am. J., 53, 1442–1447, 1989.
Santos, F., Torn, M. S., and Bird, J. A.: Biological degradation of pyrogenic organic matter in temperate forest soils, Soil Biol. Biochem., 51, 115–124, 2012.
SAS: SAS Institute Inc., SAS version 9.2, 2012.
Schmidt, M. W. I., Knicker, H., Hatcher, P. G., and KogelKnab-ner, I.: Improvement of13C and15N CPMAS NMR spectra of bulk soils, particle size fractions and organic material by treat-ment with 10 % hydrofluoric acid, Eur. J. Soil Sci., 48, 319–328, 1997.
Scott, D. T., McKnight, D. M., Blunt-Harris, E. L., Kolesar, S. E., and Lovley, D. R.: Quinone moieties act as electron acceptors in the reduction of humic substances by humics-reducing microor-ganisms, Environ. Sci. Technol., 32, 2984–2989, 1998.
Smernik, R.: Biochar and sorption of organic compounds, in: Biochar for Environmental Management: Science and Technol-ogy, edited by: Lehmann, J. and Joseph, S., Earthscan, 2009. Spokas, K. A.: Impact of biochar field aging on laboratory
green-house gas production potentials, Glob. Change Biol., 5, 165–176, 2013.
Spokas, K. A. and Reicosky, D. C.: Impacts of sixteen different biochars on soil greenhouse gas production, Ann. Env. Sci., 3, 179–193, 2009.
Steinbeiss, S., Gleixner, G., and Antonietti, M.: Effect of biochar amendment on soil carbon balance and soil microbial activity, Soil Biol. Biochem., 41, 1301–1310, 2009.
Stevenson, F. J.: Humus Chemistry: Genesis, Composition, Reac-tions, Wiley, 1994.
Uchimiya, M., Lima, I. M., Klasson, K. T., Chang, S. C., Wartelle, L. H., and Rodgers, J. E.: Immobilization of heavy metal ions (Cu-II, Cd-II, Ni-II, and Pb-II) by broiler litter-derived biochars in water and soil, J. Agr. Food Chem., 58, 5538–5544, 2010.
Wardle, D. A., Nilsson, M. C., and Zackrisson, O.: Fire-derived charcoal causes loss of forest humus, Science, 320, 629–629, 2008.
Yao, F. X., Arbestain, M. C., Virgel, S., Blanco, F., Arostegui, J., Maciá-Agulló, J. A., and Macías, F.: Simulated geochemical weathering of a mineral ash-rich biochar in a modified Soxhlet reactor, Chemosphere, 80, 724–732, 2010.
Zech, W., Ziegler, F., Kögel-Knabner, I., and Haumaier, L.: Humic substances distribution and transformation in forest soils, Sci. To-tal Environ., 117–118, 155–174, 1992.
Zhang, P., Sun, H. W., Yu, L., and Sun, T. H.: Adsorption and cat-alytic hydrolysis of carbaryl and atrazine on pig manure-derived biochars: impact of structural properties of biocharse, J. Hazard. Mater., 244, 217–224, 2013.
Zhao, L., Cao, X., Mašek, O., and Zimmerman, A.: Heterogeneity of biochar properties as a function of feedstock sources and pro-duction temperatures, J. Hazard. Mater., 256–257, 2013. Zimmerman, A. R.: Abiotic and microbial oxidation of
laboratory-produced black carbon (Biochar), Environ. Sci. Technol., 44, 1295–1301, 2010.