www.biogeosciences.net/10/267/2013/ doi:10.5194/bg-10-267-2013
© Author(s) 2013. CC Attribution 3.0 License.
Biogeosciences
Biogenic nitrogen gas production at the oxic–anoxic
interface in the Cariaco Basin, Venezuela
E. Montes1, M. A. Altabet2, F. E. Muller-Karger1, M. I. Scranton3, R. C. Thunell4, C. Benitez-Nelson4, L. Lorenzoni1, and Y. M. Astor5
1College of Marine Science, University of South Florida, St. Petersburg, Florida, USA
2School of Marine Science and Technology, University of Massachusetts Dartmouth, New Bedford, Massachusetts, USA 3School of Marine and Atmospheric Science, Stony Brook University, Stony Brook, New York, USA
4Marine Science Program & Department of Earth and Ocean Sciences, University of South Carolina, Columbia,
South Carolina 29208, USA
5Estaci´on de Investigaciones Marinas de Margarita, Fundaci´on La Salle de Ciencias Naturales, Apartado 144, Porlamar,
Estado Nueva Esparta, Venezuela
Correspondence to:E. Montes ([email protected])
Received: 16 July 2012 – Published in Biogeosciences Discuss.: 8 August 2012
Revised: 3 December 2012 – Accepted: 17 December 2012 – Published: 17 January 2013
Abstract.Excess nitrogen gas (Nxs2) was measured in sam-ples collected at six locations in the eastern and western sub-basins of the Cariaco Basin, Venezuela, in Septem-ber 2008 (non-upwelling conditions) and March 2009 (up-welling conditions). During both sampling periods, Nxs2 concentrations were below detection in surface waters, in-creasing to ∼22 µmol N kg−1 at the oxic–anoxic
inter-face ([O2]<∼4 µmol kg−1, ∼250 m). Below the oxic–
anoxic interface (300–400 m), the average concentration of Nxs2 was 24.7±1.9 µmol N kg−1in September 2008 and
27.5±2.0 µmol N kg−1 in March 2009, i.e., Nxs2 concen-trations within this depth interval were ∼3 µmol N kg−1
higher (p <0.001) during the upwelling season compared to the non-upwelling period. These results suggest that N-loss in the Cariaco Basin may vary seasonally in response to changes in the flux of sinking particulate organic matter. We attribute the increase in Nxs2 concentrations, or N-loss, observed during upwelling to: (1) higher availability of fixed nitrogen derived from suspended and sinking particles at the oxic–anoxic interface and/or (2) enhanced ventilation at the oxic–anoxic interface during upwelling.
1 Introduction
Dissolved inorganic nitrogen (DIN or “fixed” nitrogen), in-cludes nitrate, nitrite, and ammonium. This nutrient of-ten limits primary production in marine systems (Codis-poti, 1989; Smith, 1984) and thus plays a role in the mod-ulation of climate (Altabet et al., 2002; Falkowski, 1997; Ganeshram et al., 2000; Gruber, 2004). In the ocean, new DIN is primarily derived from nitrogen fixation (N2→NH+4)
by microbial diazotrophs. The microbial processes that re-sult in the conversion of DIN back to dinitrogen gas (N-loss) are the primary oceanic sinks for fixed nitrogen (Chang et al., 2010; Codispoti, 2007; Devol et al., 2006). These include water column and sedimentary denitrifica-tion (NO−3 →NO−2 →N2O→N2), and anammox
(anaero-bic ammonium oxidation; NO−2 + NH+4 →N2). Large-scale
water column N-loss in the global ocean occurs mainly in the three major oceanic oxygen minimum zones (eastern tropical North Pacific, eastern tropical South Pacific, and the Arabian Sea; Codispoti et al., 2001; Gruber and Sarmiento, 1997).
water masses (Gruber, 2004; Gruber and Sarmiento, 1997, 2002). Whether this imbalance in the nitrogen inventory is due to an underestimation of nitrogen fixation or an overes-timation of N-loss is a topic of current debate (Capone and Knapp, 2007; Codispoti, 2007; Deutsch et al., 2007; Dals-gaard et al., 2012; DeVries et al., 2012). More recently, the removal of fixed nitrogen has been estimated by measur-ing excess N2(Nxs2, with respect atmospheric equilibrium),
such as in the Arabian and Baltic Seas and the eastern trop-ical South Pacific (Chang et al., 2010; Devol et al., 2006; L¨offler et al., 2011), in order to reduce uncertainties associ-ated with regional variations in N : P ratios and the complex-ities of DIN conversion pathways. DeVries et al. (2012) used Nxs2 measurements coupled with a global circulation model to estimate oceanic water-column N-loss rates. In anoxic wa-ters of the Black Sea, interannual variations in Nxs2 were at-tributed to changes in the downward flux of organic matter from phytoplankton blooms (Fuchsman et al., 2008). Despite these efforts many questions remain regarding the role of or-ganic matter flux for fueling water column N-loss (Brettar and Rheinheimer, 1992; Liu and Kaplan, 1984; Ward et al., 2008).
The Cariaco Basin offers an opportunity to examine the linkage between surface productivity and the loss of fixed nitrogen at depth. This basin exhibits water column N-loss, high seasonal phytoplankton production (∼700 to 2300 mg C m−2d−1) and high vertical flux of particulate
or-ganic matter (∼40 to 100 mg C m−2d−1; Muller-Karger et
al., 2001; Scranton et al., 2006; Thunell et al., 2007; Zhang and Millero, 1993). One of the first measurements of ma-rine Nxs2 was conducted in the anoxic waters of the Cariaco Basin by Richards and Benson (1961) using N2/ Ar
ratiom-etry. In this manuscript we build on Richards and Benson’s work, and report new estimates of biogenic N2gas
produc-tion at several locaproduc-tions within the Cariaco Basin during up-welling and non-upup-welling seasons. We tested the hypothe-sis that biogenic production of N2 varies both spatially and
temporally within the anoxic waters of the basin in response to changes in the flux of organic matter. We also compared DIN deficits in the water column with Nxs2 measurements to understand whether the removal of fixed nitrogen by deni-trification was balanced by the biogenic production of N2.
We assumed that heterotrophic (canonical water column den-itrification) and chemoautotrophic (anammox) consumption of DIN were the only sources of biogenic N2(Chang et al.,
2010; Devol et al., 2006).
2 Study area
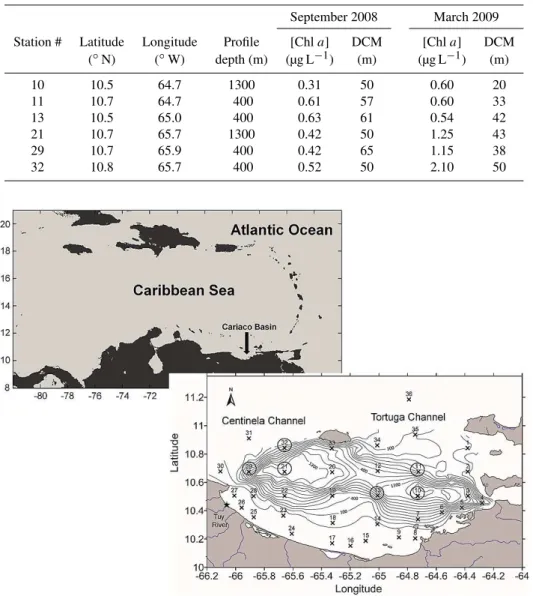
The Cariaco Basin is a 1400 m deep, tectonically derived depression on the continental shelf of Venezuela (Schubert, 1982; Fig. 1). Its sill (∼100 m) has two deeper channels, La Tortuga (135 m) and Centinela (145 m; Lidz et al., 1969; Richards, 1975). The exchange of water between the
Cari-aco Basin and the Caribbean Sea/Atlantic Ocean is limited. Cariaco waters>150 m deep are poorly ventilated; waters at the oxic–anoxic interface (∼250 m) have residence times of months to years, while bottom waters have residence times of years to decades (Holm´en and Rooth, 1990; Zhang and Millero, 1993). The basin is subject to seasonal changes in the wind intensity along the coast related to the merid-ional migration of the Intertropical Convergence Zone, which drives alternating upwelling (January–May) and thermally stratified conditions (August–November) (Astor et al., 2003). During upwelling, primary production (PP) and par-ticulate organic matter (POM) vertical fluxes are high; the 14-yr PP and sediment trap particulate organic car-bon (POC) flux (225 m) averages are 1871±394 and 80±20 mg C m−2d−1, respectively (Muller-Karger et al.,
2001, 2010). During the non-upwelling period, primary pro-duction and settling POC flux averages are significantly lower, 874±136 mg C m−2d−1and 60±20 mg C m−2d−1,
respectively.
The decomposition of the sinking POC contributes to present-day anoxic and sulfidic conditions below ∼250 m (Scranton et al., 2001; Zhang and Millero, 1993).
3 Methods
3.1 Sample collection
Samples were collected from the R/VHermano Gin´es dur-ing two cruises to Cariaco Basin (1–6 September 2008 and 9–13 March 2009). A total of 36 stations were occupied for general oceanographic observations during each cruise, while dissolved N2 samples were collected at six stations:
three in the eastern sub-basin (stations 10, 11 and 13) and three in the western sub-basin (stations 21, 29 and 32) (Ta-ble 1, Fig. 1). These six stations all have water depths ex-ceeding 300 m and included the oxic–anoxic interface. Hy-drographic data were obtained using a Seabird™ SBE-25 conductivity-temperature-depth (CTD) device equipped with an Eco chlorophyll fluorometer (Wetlabs), an SBE43 dis-solved oxygen sensor, and a rosette with 12 Teflon-coated 8L Niskin bottles.
Table 1.Location, profile depth, and chlorophyllaconcentration at the depth of chlorophyll maximum (DCM) at stations sampled for Nxs2 during September 2008 and March 2009 in the Cariaco Basin.
September 2008 March 2009
Station # Latitude Longitude Profile [Chla] DCM [Chla] DCM (◦N) (◦W) depth (m) (µg L−1) (m) (µg L−1) (m)
10 10.5 64.7 1300 0.31 50 0.60 20
11 10.7 64.7 400 0.61 57 0.60 33
13 10.5 65.0 400 0.63 61 0.54 42
21 10.7 65.7 1300 0.42 50 1.25 43
29 10.7 65.9 400 0.42 65 1.15 38
32 10.8 65.7 400 0.52 50 2.10 50
Fig. 1.Location of the Cariaco Basin and stations sampled for Nxs2 (circles) in September 2008 and March 2009. Station 10 corresponds to the CARIACO Ocean Time Series Station (10.5◦N, 64.7◦W). Broken lines trace the bathymetry of the basin. The black star shows the location of the Tuy River mouth.
Chlorophyllaand nutrient samples were collected at the 36 stations during each cruise, from the surface to 100 m (1, 20, 30, 50, 100 m); below this depth chlorophyll concentrations are typically below the detection limit of 0.01 µg L−1. Chlorophylladeterminations were carried out using methanol extractions (see Muller-Karger et al., 2001) and a Turner Designs model 10 fluorometer as described by Falkowski and Kiefer (1985) and Holm-Hansen et al. (1965). DIN and soluble reactive phosphorus (SRP) samples were collected at 1, 20, 50 and 100 m at stations 10, 11, 13 and 29, and at the surface at stations 21 and 32. Additional ni-trate and ammonium samples were collected at 200, 250, 300 and 400 m. Nutrient data from the CARIACO Ocean
Time Series Station (station 10 in Fig. 1) collected during September 2008 and March 2009 were used in this study as well (data available at the CARIACO Ocean Time Series website: http://www.imars.usf.edu/CAR/). Nutrient determi-nations were conducted at the University of South Florida following the protocols of Gordon et al. (2000) and Strick-land and Parsons (1972). We used H2S measurements from
Water for the dissolved N2analyses was collected using
Niskin bottles at 1, 50, 100, 200, 275, 300, and 400 m at the six stations selected for this study. At stations 10 and 21, additional samples were collected at 500, 750, and 1300 m. Samples were collected using 60 mL biological oxygen de-mand (BOD) bottles using the filling procedure for Winkler O2determinations. A 100 µL aliquot of saturated HgCl2was
added to each sample for preservation. Bottles were sealed with glass stoppers, and standing seawater was left around the exterior of the glass stopper at the mouth of the bottle to inhibit gas exchange with the atmosphere. The mouth of the BOD bottles, including the stopper and standing water, were sealed with a plastic cap to avoid spilling of the standing sea-water, and samples were kept in a cooler or refrigerator at ∼4◦C until analyzed.
3.2 Gas analyses
High-precision estimates of nitrogen gas were conducted at the School of Marine Science and Technology, University of Massachusetts Dartmouth, using isotope ratio mass spec-trometry (IRMS). Dissolved gases were extracted from each sample by pumping an aliquot at 10 mL min−1 through a chambered microfiber-microporous gas extractor coupled to a continuous flow of He carrier gas. The extracted gas was then passed through water, CO2and O2traps before
transfer-ring to a GV IsoPrime IRMS for simultaneous measurements of N2(mass 28) and Ar (mass 40). A liquid nitrogen cold trap
was also used to remove H2S from samples collected within
the sulfidic portion of the water column. Gas ratios from sam-ples were compared against calibrated references of artificial compressed gas mixtures of N2and Ar covering the expected
dissolved gas ratios. Further calibration also included com-paring gas measurements in distilled water equilibrated with air at controlled temperatures of 10 and 20◦C (±0.01◦C) to theoretical determinations based on the solubility of these gases. The analytical precision of N2/ Ar measurements was
better than 0.3 ‰, and thus the limit of detection of N2was
∼0.3 µmol kg−1.
Nxs2 was calculated from deviations of the sample N2/ Ar
ratio from equilibrium values expected from in situ mea-surements of potential temperature and salinity (Hamme and Emerson, 2004). This largely eliminates artifacts related to changes in gas concentration caused by physical effects on the dissolution of N2 due to variations in temperature and
salinity. N2/ Ar ratios were, in turn, normalized to ratios at
atmospheric equilibrium (N2: Arsample/ N2: Aratm. equilibrium)
to detect departures of N2 concentrations from expected
equilibrium values due to biogenic N2 production. Nxs2 can
also arise from physical processes in the near-surface region influencing air–sea gas exchange. Positive Nxs2 is produced by air injection due to bubble collapse that can occur in re-mote water mass formation regions (Hamme and Emerson, 2002; Hamme and Severinghaus, 2007), whereas negative
anomalies can arise locally by in situ heating when there is diminished exchange with the atmosphere.
Background (or abiotic) N2/ Ar ratios in the Cariaco Basin
were estimated based on data collected at the Bermuda At-lantic Time Series Station (BATS) (Nicholson et al., 2010; M. Altabet, unpublished data, 2012). Normalized N2/ Ar
ra-tios at BATS are near atmospheric equilibrium in surface wa-ters (∼27◦C) and∼1.5 % supersaturated at 1000 m (∼6◦C waters). Background N2/ Ar ratios in the Cariaco Basin were
then derived from the linear regression equation for the cor-relation between salinity-normalized temperature and mea-sured N2/ Ar ratios at BATS (y= −0.0232x+1.0176;R2=
0.88). Our background N2/ Ar ratio estimates in Cariaco
are based upon the assumption that Subtropical Underwa-ter (SUW), the major source waUnderwa-ter to the basin, has a sim-ilar vertical distribution of N2/ Ar supersaturation to that
ob-served at BATS since SUW is formed in the eastern subtrop-ical North Atlantic.
4 Results
4.1 Hydrographic data
Profiles of dissolved oxygen (O2) concentration and
den-sity (σθ) were measured at the six stations sampled for gas
analyses during September 2008 and March 2009 (Fig. 2). For both seasons, oxygen concentrations decreased from ∼185±12 µmol kg−1 at the surface to below detection
at 300 m. There was higher [O2] at the ∼25–26
isopyc-nal surface (∼0–120 m) in March 2009 likely as a result of increased vertical mixing and ventilation; the [O2] at
25 isopycnal was ∼35 µmol kg−1 higher in March 2009
than in September 2008. Sulfide was detected immedi-ately below the depth at which oxygen was below detec-tion ([H2S]>1 µmol kg−1at 270 m) between 2007 and 2009
and increased with depth to a mean maximum value of 65±3 µmol kg−1at 1300 m.
A plot of salinity (S) versus potential temperature (θ) for the six stations selected for excess N2measurements during
the two cruises indicates that water masses below∼150 m in the Cariaco Basin during the two sampling periods were similar (Fig. 3). During September 2008, stations in the west-ern sub-basin (stations 21, 29 and 32) showed lower salinities near the surface than those in the eastern sub-basin (stations 10, 11 and 13). This surface water is derived from the west-ern tropical North Atlantic and the Caribbean Sea. The salin-ity maximum, which is associated with SUW, shows a slight warming during the upwelling season when this water mass is closer to the surface and therefore exposed to sunlight.
4.2 Nutrients and chlorophylla
Fig. 2.Profiles of mean [O2], [H2S] and water column temperature versus depth in the upper 400 m of the Cariaco Basin. Oxygen and
temperature profiles are constructed from data collected at all six stations sampled during September 2008 and March 2009 for Nxs2 deter-minations. Average [H2S] was calculated from data collected on separate cruises at the CARIACO Station between 2007 and 2009 (see
Sect. 3.1). Mean oxygen concentrations are also plotted against density (σθ).
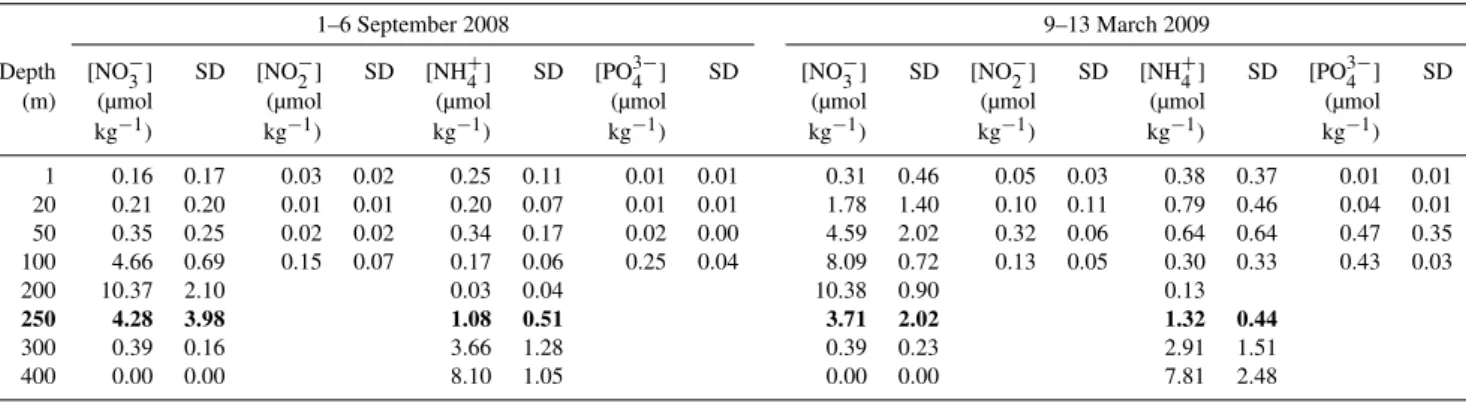
sampled for gas determinations (Table 2) in March 2009 as a result of upwelling, compared to September 2008. Nitrite and SRP concentrations in the top 100 m were below 1 µmol kg−1 in both seasons. A peak in [NO−3] of 10–12 µmol kg−1was observed around 200 m, and [NO−3] was below detection at 300 m. Ammonium concentrations were low but vari-able near the surface (<0.5 µmol kg−1), with slightly higher
values in the upper 50 m during March 2009 compared to September 2008. Ammonium concentrations showed a min-imum at 200 m in both seasons. From 250 m to the bottom, [NH+4] increased at a rate of∼0.04 µmol kg−1m−1reaching
values as high as∼23 µmol kg−1at 1300 m (stations 10 and 21; data not shown).
Samples collected at selected stations for Nxs2 measure-ments showed nutrient concentrations similar to those from the CARIACO Ocean Time Series during corresponding months (September 2008 and March 2009; Fig. 4). As ex-pected, all nutrient measurements in the upper 100 m from
the CARIACO Ocean Time Series showed higher concentra-tions in March 2009 (upwelling condiconcentra-tions) than in Septem-ber 2008 (non-upwelling conditions). Nitrite showed a large peak at 100 m in September 2008, but a secondary peak near the oxic–anoxic interface was not detected during this time, possibly due to wide sample spacing. In March 2009, how-ever, a sharp secondary nitrite maximum (0.86 µmol kg−1) was measured at∼270 m. Nitrate, SRP and ammonium con-centrations below 100 m showed similar vertical profiles dur-ing both periods.
A deep chlorophyll maximum (DCM) was observed at 50– 65 m in September 2008 (0.48±0.12 µg L−1; Table 1), and at
20–50 m in March 2009 (1.04±0.60 µg L−1). This shoaling
Table 2.Average nutrient concentrations from stations sampled for Nxs2 determinations during September 2008 and March 2009 in the Cariaco Basin. Values near the oxic–anoxic interface are shown in bold captions.
1–6 September 2008 9–13 March 2009
Depth [NO−3] SD [NO−2] SD [NH+4] SD [PO34−] SD [NO−3] SD [NO−2] SD [NH+4] SD [PO34−] SD
(m) (µmol (µmol (µmol (µmol (µmol (µmol (µmol (µmol
kg−1) kg−1) kg−1) kg−1) kg−1) kg−1) kg−1) kg−1) 1 0.16 0.17 0.03 0.02 0.25 0.11 0.01 0.01 0.31 0.46 0.05 0.03 0.38 0.37 0.01 0.01 20 0.21 0.20 0.01 0.01 0.20 0.07 0.01 0.01 1.78 1.40 0.10 0.11 0.79 0.46 0.04 0.01 50 0.35 0.25 0.02 0.02 0.34 0.17 0.02 0.00 4.59 2.02 0.32 0.06 0.64 0.64 0.47 0.35 100 4.66 0.69 0.15 0.07 0.17 0.06 0.25 0.04 8.09 0.72 0.13 0.05 0.30 0.33 0.43 0.03
200 10.37 2.10 0.03 0.04 10.38 0.90 0.13
250 4.28 3.98 1.08 0.51 3.71 2.02 1.32 0.44
300 0.39 0.16 3.66 1.28 0.39 0.23 2.91 1.51
400 0.00 0.00 8.10 1.05 0.00 0.00 7.81 2.48
Fig. 3.Salinity versus potential temperature (θ )in the Cariaco Basin at stations sampled for Nxs2 measurements during September 2008 and March 2009. Black symbols represent the average potential temperature and salinity from all six stations and sampling periods at 150 (diamond), 200 (square) and 250 (circle) meters.
4.3 N2/ Ar ratios and Nxs2
Average vertical distributions of normalized N2/ Ar ratios
during both cruises are shown in Fig. 5a. Average normalized N2/ Ar ratios measured in the upper 100 m were
undersatu-rated by∼0.5 % in September 2008 and∼0.2 % in March 2009. The mean N2/ Ar ratio near the oxic–anoxic
inter-face (250–300 m) was 1.026 (∼2.6 % supersaturated) during both periods. Below this depth, N2/ Ar ratios remained fairly
constant. Estimates of background N2/ Ar ratios (calculated
based on regressions of the ratio versus temperature reported at BATS) in surface waters were close to atmospheric equi-librium in September 2008 and ∼0.3 % supersaturated in
March 2009. Corresponding background [Nxs2] in the upper 100 m showed negative values in September 2008 and pos-itive values in March 2009 (∼2 µmol N kg−1; Fig. 5b).
Es-timated background N2/ Ar ratios peaked at 200 m (∼0.6 %
supersaturation) with background [Nxs2] at∼6 µmol N kg−1 during both periods and remaining constant below this depth (Fig. 5a, b).
In March 2009, observed Nxs2 in surface waters was closer to equilibrium with the atmosphere. In September 2008, wa-ters in the upper 100 m had observed Nxs2 negative anoma-lies as high as∼8 µmol N kg−1, presumably in response to
stratification and warming by 4◦C as compared to March 2009. Waters ≥200 m were supersaturated with dissolved N2 at all stations during both cruises. Below the upper
150 m, observed [Nxs2] rapidly increased to peak concentra-tions near the oxic–anoxic interface (250–300 m). In March 2009, [Nxs2] decreased by∼3 µmol N kg−1from these maxi-mal values at depths below 400 m. In addition, samples col-lected between 300–400 m at four stations during the up-welling period (March 2009) had significantly higher [Nxs2] (2.7–6.1 µmol N kg−1,p <0.001) than those at the same
sta-tions during the relaxation period (September 2008) (Fig. 6). This was not observed at stations 10 (in the center of the east-ern basin) and 29 (in the westeast-ern basin near the Tuy River). However, we did not detect a clear spatial pattern along sam-pled stations which would have suggested an influence from riverine discharge or Caribbean waters entering into the basin through the Centinela and Tortuga channels (Fig. 1) on Nxs2 distributions.
5 Discussion
5.1 N2/ Ar ratios and Nxs2
Fig. 4.Nutrient profiles from the CARIACO Time Series Station during September 2008 and March 2009.
Fig. 5.Profiles of normalized N2/ Ar ratios and [Nxs2] in the Cariaco Basin during September 2008 and March 2009. Background (abiotic)
Fig. 6.Mean [Nxs2] between 300 and 400 m in the Cariaco Basin from all six stations sampled during September 2008 and March 2009.
(SST) were significantly higher (>29◦C). Hence, in situ near-surface water heating without gas re-equilibration is the most likely cause for the negative values of Nxs2. Increasing SST reduces the equilibrium concentration of N2to a lesser
degree than Ar, thereby increasing equilibrium N2/ Ar. If
ac-tual N2and Ar concentrations have little to no change due to
low air–sea gas exchange, then the observed N2/ Ar is less
than the equilibrium value and a negative [Nxs2] results. Cal-culations (not shown) show that the magnitude of observed negative [Nxs2] is consistent with the seasonal temperature in-crease assuming in situ heating with minimal gas exchange.
[Nxs2] values were relatively constant with depth in the up-per 100 m during both sampling up-periods but increased low 200 m, as dissolved oxygen decreased and N-loss be-gan. The [NO−3] profile shows the consumption of nitrate by denitrification between ∼200 and 300 m (Fig. 4). In most stations, the highest [Nxs2] (∼12–30 µmol N kg−1; av-erage = 23.8±4.3 µmol N kg−1) was measured at 250–300 m
(Fig. 5). The mean [Nxs2] between the oxic–anoxic inter-face (250 m) and 1300 m depth was 25±2 µmol N kg−1, which is equivalent within uncertainty to the increase in Nxs2 expected from the N deficit (∼23 µmol N kg−1). Our
pri-mary assumption is that the basin is filled with sill-depth (∼150 m) Caribbean Sea intermediate waters that were once fully oxygenated, as previously proposed by Richard and Benson (1961). In the Cariaco Basin nitrogen derives from two sources: incoming nitrate and N from remineralized or-ganic matter. Unpublished data show that nitrate and oxy-gen concentrations in Caribbean intermediate waters enter-ing the basin are 6–8 and∼140 µmol kg−1, respectively (L. Lorenzoni unpublished data, 2004). Subsequent lack of ven-tilation induces today’s anoxic conditions and thus denitrifi-cation leading to an N deficit and buildup of Nxs2 above pre-existing background levels. The consumption of nitrate by denitrification would thus have generated∼7 µmol N kg−1 of Nxs2, while the consumption of oxygen by organic
mat-ter remineralization would have produced ∼16 µmol kg−1
of DIN available for N-loss (AOU : N =∼270 : 16) for an expected total of ∼23 µmol N kg−1of Nxs
2 produced.
Oxy-gen consumption by organic matter remineralization would have released ammonium (∼16 µmol kg−1) that would have subsequently been either directly consumed by anammox or transformed into NOxavailable for denitrification. The entire
process is likely very dynamic and the observed Nxs2 in the Cariaco Basin is the result of multiple pulses of Caribbean Sea intermediate waters flowing over the sill into the sub-oxic and ansub-oxic portions of the basin. Evidence of such in-trusion events have been reported by Astor et al. (2003) and Scranton et al. (2006). Nitrate from intrusions into the oxic– anoxic interface would be consumed by denitrification while that injected into the sulfidic portion of the water column would be consumed by autotrophic denitrification, a biolog-ical process that uses sulfur species as reductant to convert nitrate into N2(Fuchsman et al., 2012; Jensen et al., 2009).
Though an overlap between sulfide and nitrate has not been detected in the basin (M. Scranton, personal communication, 2012) and incubations have not shown any stimulation of dark carbon fixation by nitrate, previous work has reported high rates of dark dissolved inorganic carbon (DIC) fixation (chemoautotrophy) occurring at the oxic–anoxic interface in the Cariaco Basin (Taylor et al., 2001, 2006; Wakeham et al., 2012).
Our profiles of N2/ Ar ratios and [Nxs2] are similar in shape
to the earlier profiles measured by Richards and Benson (1961) in the Cariaco Basin. They found an average [Nxs2] of 20.7±2.1 µmol kg−1at∼400–1200 m, or∼25 % lower than our average [Nxs2] of 25.0±1.8 µmol N kg−1in the same depth range in the eastern sub-basin (stations 10, 11 and 13). It is unlikely that such difference in [Nxs2] results from methodological discrepancies. Richards and Benson’s Nxs2 measurements were carried out following the methods de-scribed in Benson and Parker (1961). Differences between their methodology and ours included sample storage in spe-cially made piston sealed bottles and dissolved gas extraction on a vacuum line prior to transfer to a mass spectrometer us-ing a Toepler pump. They also removed O2using hot copper
prior to N2/ Ar analysis. While the method used by Richards
and Benson (1961) is more time-consuming than ours, there is no reason to suspect a systematic bias between our ap-proaches as they also determined that they achieved quan-titative gas extraction. In fact, Richards and Benson (1961) also observed slight negative [Nxs2] of 1 to 3 µmol N kg−1as we do. Such agreement would be unlikely if either of our methods has significant bias. To our knowledge, these are the only two studies of Nxs2 that have been conducted in the Cariaco Basin. The difference suggests that Nxs2 has been ac-cumulating in the basin at a rate of∼0.08 µmol N kg−1yr−1
and 0.85–1.3 µmol kg−1yr−1, respectively; Scranton et al.,
2006; Zhang and Millero, 1993) The increase in SRP better matches Redfield stoichiometry (15–16 : 1 N : P) when both the accumulation rate of Nxs2 (0.08 µmol N kg−1yr−1) and ammonium (0.45 µmol N kg−1yr−1; average based on values reported above) are accounted for. The DIN / SRP ratio of the accumulation is 14.7 ([0.08 + 0.45] : 0.036) if Nxs2 is included and 12.5 when it is not.
5.2 Biogenic N2production and upwelling
The [Nxs2] measured immediately below the oxic–anoxic in-terface at 300–400 m in March 2009 (upwelling) is higher than that measured in September 2008 (p <0.001) (non-upwelling; Fig. 6), suggesting that N-loss and thus pro-duction of biogenic N2 are stimulated during upwelling in
the Cariaco Basin. The upwelling period usually is associ-ated with higher fluxes of settling particulate organic matter (Montes et al., 2012; Thunell et al., 2007). Enhanced vertical transport of particulate organic matter can be an important mode of supply of fixed nitrogen to the oxic–anoxic inter-face, where degradation of the flux releases ammonium and organic carbon that can be utilized by microbes. This is con-sistent with findings by Fuchsman et al. (2008) in the Black Sea, who observed higher production of biogenic N2in years
that had large phytoplankton blooms compared to those in which phytoplankton abundances were lower. Nutrient and suspended organic particle measurements from the CARI-ACO Ocean Time Series program show that DIN, POC and particulate organic nitrogen (PON) at the oxic–anoxic inter-face (∼250 m) were higher in March 2009 than in September 2008 (5.18 vs. 1.02 µmol N kg−1, 65.12 vs. 46.04 µg C kg−1
and 11.16 vs. 8.05 µg N kg−1, respectively). Furthermore,
particulate settling flux records from CARIACO show that mean PON fluxes (1997–2010) at∼400 m tend to be higher in March than in September months (Fig. 7); mean PON fluxes for CARIACO were used since settling flux data were not available for 2009 because of a mooring malfunction. These observations suggest that more inorganic and organic forms of dissolved nitrogen are available during upwelling compared to non-upwelling periods, stimulating N-loss pro-cesses during upwelling.
Ammonium produced by the decay of sinking organic matter, in particular, is likely an important DIN source for N-loss. It can be incorporated into non-canonical nitrogen path-ways such as coupled nitrification–denitrification in which nitrifiers exploit the newly generated ammonium at the oxic– anoxic interface, producing nitrite and nitrate that can, in turn, be utilized by heterotrophic denitrifiers. Another plau-sible utilization pathway of NH+4 is anammox. Historical nu-trient records from the CARIACO Time Series program indi-cate that NO−2 is occasionally present at the interface in high enough concentrations to fuel the anammox reaction (Scran-ton et al., 2006). Wakeham et al. (2012) also shows extensive evidence for anammox taking place at the oxic–anoxic
inter-Fig. 7.Mean vertical PON flux during September (non-upwelling) and March (upwelling) months from the CARIACO Ocean Time Series between 1997 and 2010.
face in Cariaco. They found that anammox bacteria and lad-derane lipids, an anammox bacterial biomarker, were abun-dant at∼250 m. Furthermore, maxima in chemoautotrophic production rates (dark DIC assimilation) have also been mea-sured at this depth, likely as a result of the presence of the anammox metabolism and perhaps autotrophic denitrifica-tion (or thiodenitrificadenitrifica-tion) within this layer (Taylor et al., 2001, 2006; Wakeham et al., 2012).
From the observations reported in this study, however, we cannot determine which specific pathways (denitrification or anammox) dominate the conversion of DIN to biogenic N2
within Cariaco’s sub-oxic layer. Nonetheless, from a general perspective our results shed light on the microbially medi-ated biogeochemical processes that impact the production of biogenic N2in the basin on a seasonal basis. Here we
(∼150 m) has increased. They suggested that the decrease in the POC transfer efficiency (POC flux at 300 m : POC flux at 150 m) is the result of enhanced microbial respiration rates. In other words, heterotrophy responds proportionally to the increase in the POC flux below the euphotic zone. Enhanced microbial metabolism, such as denitrification and anammox within the oxic–anoxic layer in Cariaco would thus result in higher biogenic N2production during the upwelling period.
During the relaxation period, however, when the flux of or-ganic matter escaping the base of the euphotic zone is lower (Montes et al., 2012), a decrease of the microbial activity can be expected, which would lead to lower production of biogenic N2.
An alternative explanation for the increase in biogenic N2
is water mass intrusions at intermediate depths. Episodic in-trusions of oxygen and nutrient-rich water masses from the Caribbean Sea deepen the oxic–anoxic interface in the Cari-aco Basin (Astor et al., 2003). These alter the vertical distri-bution of redox sensitive species such as hydrogen sulfide, iron and manganese oxides, and ammonium, among others (Percy et al., 2008; Scranton et al., 2001, 2006). Dissolved oxygen concentrations were higher between the ∼25 and ∼26 isopycnal surfaces in March 2009 compared to Septem-ber 2008 (Fig. 2). The increase in dissolved O2 during the
upwelling season must result from enhanced vertical mix-ing and ventilation of cold (∼21–22◦C) subsurface waters. Higher [O2] in the upper∼120 m in March 2009 suggests
that an intrusion of water from the Caribbean Sea could have occurred during the upwelling period. The supply of oxygen to the redoxcline would stimulate nitrification, and enhance the abundance of NOx available for denitrifiers. Though an
increase in oxygen concentrations at this depth after an intru-sion would inhibit denitrification, previous work has shown that oxygen is quickly consumed and that low oxygen con-ditions are restored within weeks at this depth (Scranton et al., 2006). The intrusion of nitrate-rich waters from the Caribbean would also stimulate denitrification at the oxic– anoxic interface.
5.3 DIN deficit and Nxs2
We estimate the DIN deficit (Ndef) in the basin as the amount
of fixed nitrogen that has been removed by the N-loss (Chang et al., 2010; Devol et al., 2006). The Ndef is calculated by
subtracting the observed DIN (Nobs) from the total expected
fixed nitrogen (Nexp= [NO−3] + [NO−2] + [NH+4]) based on in
situ SRP concentrations and Redfield stoichiometry. DIN deficits within the anoxic portion of the water column in Cariaco are not likely affected by reduced metals adsorp-tion. Unpublished data show that despite labile and oxide-associated particulate P peak at Cariaco’s oxic–anoxic in-terface, indicating SRP scavenging by reduced metals, SRP concentrations at this depth appear to be minimally impacted by such reactions (C. Benitez-Nelson, personal communi-cation, 2012). Particulate P has nanomolar concentrations
while SRP concentrations are in the micromolar range. The expected DIN abundance is typically obtained by plotting DIN versus SRP concentrations measured in waters with dis-solved O2>65 µmol kg−1(Devol et al., 2006). For our work
we used nutrient data collected at the CARIACO Station and BATS during 2008 and 2009 using the same criteria as De-vol et al. (Fig. 8). Data from the BATS program was used in this analysis since waters entering into the Cariaco Basin originate in the subtropical North Atlantic. Nexpis then
cal-culated by linear regression:
Nexp=14.5(Pobs)−0.7, (1)
where Pobs corresponds to in situ SRP concentrations. The
negative Y-intercept indicates a DIN deficit when the SRP concentration is zero. The slope and intercept of 14.5 and 0.7, respectively, are the result of averaging the correspond-ing values from the DIN : SRP relationships from the CARI-ACO Time Series (13.8, 0.5) and BATS (15.1, 0.9). These N : P relationships are similar to those reported from the east-ern tropical South Pacific (15.8) and the Arabian Sea (14.9) (Chang et al., 2010, and Codispoti et al., 2001, respectively). The DIN deficit is then
Ndef=(Nexp−Nobs). (2)
We based Ndef estimates on monthly observations at the
CARIACO Station (station 10 in this study) for 2008–2009 since no nitrite or SRP measurements were made at depths below 100 m during our cruises. We believe that these are representative for the basin because the vertical nutrient pro-files within each season were similar among all stations dur-ing the regional cruises at the oxic–anoxic interface (Table 2). DIN deficits in September 2008 and March 2009 were cal-culated by averaging the Ndeffor the CARIACO observations
between August and October 2008, and between February and April 2009, respectively. Combined Ndef in the upper
∼120 m were below detection during both seasons, as ex-pected, but increased in waters with low oxygen (≥200 m). Measurements of [Nxs2] were similar to Ndef (least squares
linear correlation, R2=0.95, p <0.001; Fig. 9), showing that biogenic N2production reflects the amount of fixed
ni-trogen removed by the N-loss process in Cariaco. Biogenic [Nxs2] tended to be slightly lower than Ndefestimates (Fig. 9),
likely due to the accumulation of SRP within the anoxic layer, which artificially amplifies Ndefvalues.
Fig. 8.Phosphate (SRP) versus DIN concentrations in waters with dissolved O2concentrations above∼65 µmol kg−1from the
CARI-ACO Time Series and BATS during 2008 and 2009.
and ammonium below the oxic–anoxic interface (Scranton et al., 2006; Zhang and Millero, 1993). The excellent agree-ment between [Nxs2] and Ndefsupports our assertion that Nxs2
in the Cariaco Basin is mainly of biological origin.
6 Conclusions
In this study we evaluated changes in Nxs2 in the Cariaco Basin under contrasting seasonal conditions (upwelling ver-sus non-upwelling). [Nxs2] were below detection at the sur-face, and increased to a mean value of∼22 µmol N kg−1at
the oxic–anoxic interface (250–300 m) and deeper. Our [Nxs2] estimates are ∼25 % larger than those from Richards and Benson (1961), suggesting that biogenic N2has been
accu-mulating in the basin at a rate of∼0.08 µmol N kg−1yr−1. [Nxs2] was higher by∼3–6 µmol N kg−1at 300–400 m dur-ing the upwelldur-ing period (March 2009) than when the basin was more thermally stratified (September 2008). Higher bio-genic N2 production can be the result of enhanced DIN
availability in Cariaco’s oxic–anoxic interface during the up-welling period due to higher vertical transport of organic matter.
N-loss at the oxic–anoxic interface of the Cariaco Basin appears to be stimulated during the upwelling period. We attribute this observation to two mechanisms: (1) increased supply of sinking organic nitrogen and/or (2) ventilation of the oxic–anoxic interface by intermediate oxygenated and nitrate-rich Caribbean waters.
DIN deficits based on nutrient Redfield stoichiometry within sub-oxic and anoxic waters in Cariaco are similar to our estimates of [Nxs2] at the corresponding depths. This sug-gests that Nxs2 in Cariaco is generated mainly by biological processes associated with oceanic N-loss.
Fig. 9.Average DIN deficits (DINdef) versus [Nxs2] (measured
mi-nus background Nxs2) in the Cariaco Basin. The dashed line shows the theoretical 1 : 1 relationship.
Our observations show that measuring Nxs2 is a robust method for quantifying the sink of fixed nitrogen in Cariaco and in low oxygen environments in general. We conclude that biogenic N2determinations are a useful tool for
complement-ing information provided by the N∗parameter, and should be considered in future studies addressing questions regarding the state of the contemporary global nitrogen cycle.
Acknowledgements. This work was supported by the CARIACO Ocean Time Series Project, funded by the National Science Foun-dation (Award # OCE-0326268 and OCE-0963028) and the Fondo National de Investigaciones Cient´ıficas y Tecnol´ogicas (FONACIT, Venezuela, Awards # 96280221 and 2000001702). We deeply thank the Fundaci´on La Salle de Ciencias Naturales, Estaci´on de Investigaciones Marinas Isla Margarita (FLASA/EDIMAR) for their continuous effort in making this time series possible. We are grateful to Ana Herrera (Instituto de Biolog´ıa Experimental, Universidad Central de Venezuela) for providing laboratory equipment and logistics for this study. We are especially indebted to the crew of the R/V Hermano Gin´es(FLASA) for their able support at sea. We also thank two anonymous reviewers for their helpful comments. This is the Institute of Marine Remote Sensing (IMaRS) contribution # 148.
References
Altabet, M. A., Higginson, M. J., and Murray, D. W.: The effect of millennial-scale changes in Arabian Sea denitrification on atmo-spheric CO2, Nature, 415, 159–162, 2002.
Astor, Y., Muller-Karger, F., and Scranton, M. I.: Seasonal and in-terannual variation in the hydrography of the Cariaco Basin: im-plications for basin ventilation, Cont. Shelf Res., 23, 125–144, 2003.
Benson, B. B. and Parker, P. D. M.: Nitrogen/argon and nitrogen isotope ratios in aerobic sea water, Deep-Sea Res., 7, 237–253, 1961.
Brandes, J. A. and Devol, A. H.: A global marine-fixed nitrogen iso-topic budget: implications for Holocene nitrogen cycling, Global Biogeochem. Cy., 16, 1120, doi:10.1029/2001GB001856, 2002. Brettar, I. and Rheinheimer, G.: Influence of carbon availability on denitrification in the central Baltic Sea, Limnol. Oceanogr. 37, 1146–1163, 1992.
Capone, D. G. and Knapp, A. N.: Oceanography: A marine nitrogen cycle fix?, Nature, 445, 159–160, 2007.
Chang, B. X., Devol, A. H., and Emerson, S. R.: Denitrification and the nitrogen gas excess in the eastern tropical South Pacific oxygen deficient zone, Deep-Sea Res. I, 57, 1092–1101, 2010. Codispoti, L. A.: Phosphorus vs. nitrogen limitation of new and
ex-port production, in: Productivity of the Ocean: Present and Past, edited by: Berger, W. H., Smetacek, V. S., and Wefer, G., John Wiley & Sons Limited, New York, 377–394, 1989.
Codispoti, L. A.: An oceanic fixed nitrogen sink exceeding 400 Tg N a−1vs the concept of homeostasis in the fixed-nitrogen inven-tory. Biogeosciences 4, 233–253, 2007.
Codispoti, L. A., Brandes, J. A., Christensen, J. P., Devol, A. H., Naqvi, S. W. A., Paerl, H. W., and Yoshinari, T.: The oceanic fixed nitrogen and nitrous oxide budgets: Moving targets as we enter the anthropocene?, Sci. Mar., 65, 85–105, 2001.
Dalsgaard, T., Thamdrup, B., Far´ıas, L., and Revsbech, N. P.: Anammox and denitrification in the oxygen minimum zone of the eastern South Pacific, Limnol. Oceanogr., 57, 1331–1346, doi:10.4319/lo.2012.57.5.1331, 2012.
Deutsch, C., Sarmiento, J. L., Sigman, D. M., Gruber, N., and Dunne, J. P.: Spatial coupling of nitrogen inputs and losses in the ocean, Nature, 445, 163–167, 2007.
Devol, A., Uhlenhopp, A., Naqvi, S., Brandes, J., Jayakumar, D., Naik, H., Gaurin, S., Codispoti, L., and Yoshinari, T.: Denitri-fication rates and excess nitrogen gas concentrations in the Ara-bian Sea oxygen deficient zone, Deep-Sea Res. I, 53, 1533–1547, 2006.
DeVries, T., Deutsch, C., Primeau, F., Chang, B., and Devol, A.: Global rates of water-column denitrification derived from nitro-gen gas measurements, Nat. Geosci., 5, 547–550, 2012. Falkowski, P. G.: Evolution of the nitrogen cycle and its influence
on the biological sequestration of CO2in the ocean, Nature, 387,
272–275, 1997.
Falkowski, P. and Kiefer, D. A.: Chlorophyllafluorescence in phy-toplankton: relationship to photosynthesis and biomass, J. Plank-ton Res. 7, 715–731, 1985.
Fuchsman, C. A., Murray, J. W., and Konovalov, S. K.: Concentra-tion and natural stable isotope profiles of nitrogen species in the Black Sea, Mar. Chem., 111, 90–105, 2008.
Fuchsman, C. A., Murray, J. W., and Staley, J. T.: Stimulation of autotrophic denitrification by intrusions of the Bosporus Plume into the anoxic Black Sea, Front. Microbiol., 3, 257, doi:10.3389/fmicb.2012.00257, 2012.
Ganeshram, R. S., Pedersen, T. F., Calvert, S. E., McNeill, G. W., and Fontugne, M. R.: Glacialinterglacial variability in denitrifi-cation in the World’s oceans: causes and consequences, Paleo-ceanography, 15, 361–376, 2000.
Gordon, L. I., Jennings, J. C., Ross, A. A., and Krest, J. M.: Sug-gested protocol for continuous flow automated analysis of seawa-ter nutrients, WOCE Operation Manual, WHP Office Rept 90-1, WOCE Rept 77 No 68/91, 1–52, 2000.
Gruber, N.: The dynamics of the marine nitrogen cycle and its in-fluence on atmospheric CO2, in: The Ocean Carbon Cycle and
Climate, edited by: Follows, M. and Oguz, T., Kluwer Academic Publishers, Dordrecht, Netherlands, 97–148, 2004.
Gruber, N. and Sarmiento, J. L.: Global patterns of marine nitrogen fixation and denitrification, Global Biogeochem. Cy., 11, 235– 266, 1997.
Gruber, N. and Sarmiento, J. L.: Biogeochemical/physical interac-tions in elemental cycles, in: THE SEA: Biological-Physical In-teractions in the Oceans, edited by: Robinson, A. R., McCarthy, J. J., and Rothschild, B. J., John Wiley and Sons, New York, 337– 399, 2002.
Hamme, R. C. and Emerson, S. R.: Mechanisms control-ling the global oceanic distribution of the inert gases ar-gon, nitrogen and neon, Geophys. Res. Lett., 29, 2120, doi:10.1029/2002GL015273, 2002.
Hamme, R. and Emerson, S.: The solubility of neon, nitrogen and argon in distilled water and seawater, Deep-Sea Res. Pt. I, 51, 1517–1528, 2004.
Hamme, R. C. and Severinghaus, J. P.: Trace gas disequilibria dur-ing deep-water formation, Deep-Sea Res. I, 54, 939–950, 2007. Holm-Hansen, O., Lorenzen, C. J., Holmes, R. W., and Strickland,
J. D. H.: Fluorometric determination of chlorophyll, J. Conseil, 30, 3–15, 1965.
Holm´en, K. J. and Rooth, C. G. H.: Ventilation of the Cariaco Trench, a case of multiple source competition?, Deep-Sea Res. Pt. I, 37, 203–225, 1990.
Jensen, M. M., Petersen, J., Dalsgaard, T., and Thamdrup, B.: Path-ways, rates and regulation of N2production in the chemocline
of an anoxic basin, Mariager Fjord, Denmark, Mar. Chem., 113, 102–113, 2009.
Li, X., Taylor, G. T., Astor, Y., and Scranton, M. I.: Relationship of sulfur speciation to hydrographic conditions and chemoau-totrophic production in the Cariaco Basin, Mar. Chem., 112, 53– 64, 2008.
Li, X., Cutter, G. A., Thunell, R. C., Tappa, E., Gilhooly Iii, W. P., Lyons, T.W ., Astor, Y., Scranton, M. I.: Particulate sulfur species in the water column of the Cariaco Basin, Geochim. Cosmochim. Ac., 75, 148–163, 2011.
Lidz, L., Charm, W. B., Ball, M. M., and Valdes, S.: Marine Basins off the coast of Venezuela, B. Mar Sci., 19, 1–17, 1969. Liu, K.-K. and Kaplan, I. R.: Denitrification rates and availability
of organic matter in marine environments, Earth Planet. Sc. Lett., 68, 88–100, 1984.
Lomas, M. W., Steinberg, D. K., Dickey, T., Carlson, C. A., Nelson, N. B., Condon, R. H., and Bates, N. R.: Increased ocean carbon export in the Sargasso Sea linked to climate variability is coun-tered by its enhanced mesopelagic attenuation, Biogeosciences, 7, 57–70, doi:10.5194/bg-7-57-2010, 2010.
Montes, E., Muller-Karger, F., Thunell, R., Hollander, D., Astor, Y., Varela, R., Soto, I., and Lorenzoni, L.: Vertical fluxes of particu-late biogenic material through the euphotic and twilight zones in the Cariaco Basin, Venezuela, Deep-Sea Res. I, 67, 73–84, 2012. Muller-Karger, F., Varela, R., Thunell, R., Scranton, M., Bohrer, R., Taylor, G., Capelo, J., Astor, Y., Tappa, E., Ho, T.-Y., and Walsh, J. J.: Annual cycle of primary production in the Cariaco Basin: Response to upwelling and implications for vertical export, J. Geophys. Res., 106, 4527–4542, 2001.
Muller-Karger, F. E., Varela, R., Thunell, R. C., Scranton, M. I., Taylor, G. T., Astor, Y., Benitez-Nelson, C. R., Lorenzoni, L., Tappa, E., Go˜ni, M. A., Rueda, D., and Hu, C.: The CARI-ACO oceanographic time series, in: Carbon and Nutrient Fluxes in Continental Margins: a Global Synthesis, JGOFS Continental Margins Task Team (CMTT), edited by: Liu, K.-K., Atkinson, L., Quinones, R., and Talaue-McManus, L., Springer-Verlag, Berlin Heidelberg, 454, 2010.
Nicholson, D., Emerson, S., Caillon, N., Jouzel, J., Hamme, R. C.: Constraining ventilation during deepwater formation using deep ocean measurements of the dissolved gas ratios
40Ar/36Ar, N
2/ Ar, and Kr/Ar, J. Geophys. Res., 115, C11015,
doi:10.1029/2010JC006152, 2010.
Percy, D., Li, X., Taylor, G. T., Astor, Y., and Scranton, M. I.: Con-trols on iron, manganese and intermediate oxidation state sulfur compounds in the Cariaco Basin, Mar. Chem., 111, 47–62, 2008. Richards, F. A.: The Cariaco Basin (Trench), Oceanogr. Mar. Biol.,
13, 11–67, 1975.
Richards, F. A. and Benson, B. B.: Nitrogen/argon and nitrogen iso-tope ratios in two anaerobic environments, the Cariaco Trench in the Caribbean Sea and Dramsfjord, Norway, Deep-Sea Res., 7, 254–264, 1961.
Schubert, C.: Origin of Cariaco Basin, southern Caribbean Sea, Mar. Geol., 47, 345–360, 1982.
Scranton, M. I., Astor, Y., Bohrer, R., Ho, T.-Y., and Muller-Karger, F.: Controls on temporal variability of the geochemistry of the deep Cariaco Basin, Deep-Sea Res. Pt. I, 7, 1605–1625, 2001.
Scranton, M. I., McIntyre, M., Astor, Y., Taylor, G. T., M¨uller-Karger, F., and Fanning, K.: Temporal variability in the nutri-ent chemistry of the Cariaco Basin, in: Past and Presnutri-ent Water Column Anoxia, edited by: Neretin, L. N., Springer Netherlands, 139–160, 2006.
Smith, S. V.: Phosphorus versus nitrogen limitation in the marine environment, Limnol. Oceanogr., 29, 1149–1160, 1984. Strickland, J. D. H. and Parsons, T. R.: A practical handbook of
seawater analysis, Fisheries Research Board of Canada, Ottawa, Ontario, 1972.
Taylor, G. T., Iabichella, M., Ho, T.-Y., Scranton, M. I., Thunell, R. C., M¨uller-Karger, F., and Varela, R.: Chemoautotrophy in the redox transition zone of the Cariaco Basin: A significant midwa-ter source of organic carbon production, Limnol. Oceanog., 46, 148–163, 2001.
Taylor, G. T., Labichella-Armas, M., Varela, R., M¨uller-Karger, F., Lin, X., and Scranton, M. I.: Microbial Ecology of the Cari-aco Basin’s oxic-anoxic interface: the U.S.-Venezuela CARI-ACO Times Series Program, in: Past and Present Water Col-umn Anoxia, NATO Science Series, edited by: Neretin, L. N., Springer, Netherlands, 473–499, 2006.
Taylor, G. T., Thunell, R., Varela, R., Benitez-Nelson, C., and Scranton, M. I.: Hydrolytic ectoenzyme activity asso-ciated with suspended and sinking organic particles within the anoxic Cariaco Basin, Deep-Sea Res. I, 56, 1266–1283, doi:10.1016/j.dsr.2009.02.006, 2009.
Thunell, R., Benitez-Nelson, C., Varela, R., Astor, Y., and Muller-Karger, F.: Particulate organic carbon fluxes along upwelling-dominated continental margins: Rates and mechanisms, Global Biogeochem. Cy., 21, GB1022, doi:10.1029/2006GB002793, 2007.
Wakeham, S. G., Turich, C., Schubotz, F., Podlaska, A., Li, X. N., Varela, R., Astor, Y., S´aenz, J. P., Rush, D., Sinninghe Damst´e, J. S., Summons, R. E., Scranton, M. I., Taylor, G. T., and Hinrichs, K.-U.: Biomarkers, chemistry and microbiology show chemoau-totrophy in a multilayer chemocline in the Cariaco Basin, Deep Sea Res. I, 63, 133–156, 2012.
Ward, B. B., Tuit, C. B., Jayakumar, A., Rich, J. J., Moffett, J., and Naqvi, S. W. A.: Organic carbon, and not copper, controls denitri-fication in oxygen minimum zones of the ocean, Deep-Sea Res. I, 55, 1672–1683, 2008.
![Fig. 2. Profiles of mean [O 2 ], [H 2 S] and water column temperature versus depth in the upper 400 m of the Cariaco Basin](https://thumb-eu.123doks.com/thumbv2/123dok_br/18276964.345171/5.892.228.668.96.620/profiles-water-column-temperature-versus-depth-cariaco-basin.webp)

![Fig. 6. Mean [N xs 2 ] between 300 and 400 m in the Cariaco Basin from all six stations sampled during September 2008 and March 2009.](https://thumb-eu.123doks.com/thumbv2/123dok_br/18276964.345171/8.892.74.425.95.330/fig-mean-cariaco-basin-stations-sampled-september-march.webp)

![Fig. 9. Average DIN deficits (DIN def ) versus [N xs 2 ] (measured mi- mi-nus background N xs 2 ) in the Cariaco Basin](https://thumb-eu.123doks.com/thumbv2/123dok_br/18276964.345171/11.892.69.428.93.344/average-deficits-din-versus-measured-background-cariaco-basin.webp)
