www.hydrol-earth-syst-sci.net/13/2265/2009/ © Author(s) 2009. This work is distributed under the Creative Commons Attribution 3.0 License.
Earth System
Sciences
Geodynamical processes in the channel connecting the two lobes of
the Large Aral Sea
E. Roget1, P. Zavialov2, V. Khan3, and M. A. Mu ˜niz1
1Environmental Physics Group, Department of Physics, University of Girona, Catalonia, Spain 2Shirshov Institute of Oceanology, Moscow, Russia
3Hydrometeorological Research Center of the Russian Federation, Moscow, Russia Received: 22 July 2009 – Published in Hydrol. Earth Syst. Sci. Discuss.: 4 August 2009 Revised: 4 November 2009 – Accepted: 15 November 2009 – Published: 26 November 2009
Abstract.Reasons for the existence of the channel connect-ing the two lobes of the present Large Aral Sea are discussed. In situ measurements in 2005 show that differences between the measured depths and those contained in the available digital bathymetry of the lake are considerably different at the channel (7.5±0.9 m, at nine measurement stations along it) and at the northern part of the eastern lobe (1.6±0.3 m, at six stations from the western to the eastern shore). Dif-ferences in the misfits observed in the two zones are dis-cussed and thought to be a consequence of the variation of the transversal area of the channel as it enters the eastern lobe, which would affect the flow velocity and thus the strength of the erosion process at the bottom. Field data together with satellite images have been used to modify an original digi-tal bathymetry of the lake and have been implemented into a 3-D hydrodynamical model. A numerical simulation shows that a wind of 12 m/s blowing from the east (112◦) generates velocities of up to 45 cm/s in the channel, allowing denser water from the eastern lobe (salinity: 132 g/kg) to flow about 38 km towards the fresher western lobe (salinity: 98 g/kg) in one day. The effect of the inflow on the vertical structure of the western lobe is also illustrated. Although nowadays the channel will be soon a thing of the past, in a more general context, the Aral Sea is presented as an example showing that geomorphologic and geophysical processes, along with hydrological and atmospheric processes, must be taken into account for short-term predictions.
Correspondence to:E. Roget ([email protected])
1 Introduction
Now that the scientific community has been able to document the present climate change and convince the society of its im-portance, the need for planning that takes climate change into account has arisen. New probable short-term forecasts are needed (Allen, 2003), and will require a better understand-ing of physical, chemical and geophysical processes, includ-ing feedback effects between land and atmospheric systems. Within this context, the Aral Sea is one of the most paradig-matic examples of a series of seas “dying” under the com-bined effect of climate change, i.e., warming trends across Central Asia (Chase et al., 2000), and of an overwhelming anthropogenic influence in the form of expanding irrigation (Micklin, 1988), which have been demonstrated to affect re-gional meteorological conditions (Small et al., 2001; Khan et al., 2004; Khan and Holko, 2009). However, the entire Aral region has not yet reached a stationary state and is therefore an exceptional natural laboratory for interdisciplinary studies addressing important issues related to climate change.
The eastern lobe is very shallow, so evaporation is high, and its salinity reached 211 g/kg in June 2008. The west-ern lobe, being much deeper (about 40 m), presents a lower salinity, although it is also very high – around 116 g/kg at the surface in June 2008 (Zavialov et al., 2008b). The impor-tance of the exchange flux through the channel connecting the two lobes – sometimes referred to as the Kulandy chan-nel – on the vertical structure of the western lobe was first discussed by Zavialov et al. (2003) based on the existence, discovered in 2003, of a bottom layer with a thickness of about 20 m which was warmer and saltier than the bulk water. Measurements made one year later (Zavialov, 2005) showed that water at the bottom of the western lobe was also saltier but colder than the upper bulk water, suggesting a later inflow than in the previous year. Accordingly, it could be concluded that water inflows through the connecting channel (i.e., the high salinity water intrusions into the western lobe, either cold or warm) affect the 3-D thermohaline structure so that the future scenario greatly depends on the persistence of the channel between the two lobes.
In this paper, unpublished detailed measurements of the water column depth at different stations along the channel connecting the two lobes of the Large Aral and in the north-ern region of its eastnorth-ern lobe are presented. Based on the field measurements, satellite images and an existing digital bathymetry of the lake, the evolution of the channel mor-phometry is discussed. Considering the observed misfits be-tween measurements and the original bathymetry a more re-alistic bathymetry of the lake has been generated and imple-mented into a 3-D hydrodynamic model to reproduce the ex-change flow between the two lobes through the channel. Fi-nally, the importance of the conclusions reached in this study are discussed in a more general context.
2 The context and the methodology of the experimental setup
Virtually, the only digital bathymetry of Lake Aral avail-able to date was developed by S. Stanichniy and R. Stanich-naya (Marine Hydrophysical Institute, Sebastopol, Ukraine), based on digitizing an old bathymetric chart issued by the Naval Hydrographic Office of the USSR in the 1950s. The data from the chart were interpolated and converted onto a regular grid with a spatial resolution of about 0.5 km×1 km. The digital map represents absolute elevations of the bottom above sea level (a.s.l.).
Satellite data have been and are used to monitor desicca-tion and morphological changes of aquatic systems (Medina et al., 2008; Cr´etaux et al., 2005). In general, the morpho-logical changes of the Aral observed from satellite data are well reproduced by the existing bathymetry when consider-ing the lake level either from satellite altimetry reconstruc-tions (after 1993) or direct geodesic determinareconstruc-tions. That is the case for the separation of the Large and Small Aral in
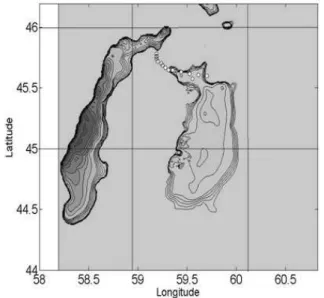
Fig. 1.Bathymetric levels bellow 30.1 m a.s.l. according to the only available digital model. Dots indicate the location of the stations where the depth of the water column was measured.
1989, and the new connection of the former Vozrozhdeniya Island to the mainland on the south coast of the lake in 2002 (Ressl and Micklin, 2004). However, when the surface level had decreased from the 53.4 m a.s.l. in 1960 (e.g., Bortnik and Chstyaeva, 1990) to 30.1 m a.s.l. in 2005 (Zavialov et al., 2006), mismatches between the remote sensing images of the system and the bathymetry appeared in the northern area of the Large Aral. According to the “old” bathymetry, although the strait connecting the eastern and western lobes should have disappeared by 2005, it is still there. Further-more, in situ hydrographic measurements (Zavialov, 2005) and seismic profiles (Nourgaliev’s personal communication to Zavialov, 2005), both recorded in August 2004, showed that within a transversal section on the westernmost side of the channel, there was a central region were the total depth was about 7 m.
Within this context, in October 2005, a bathymetric sur-vey was carried out in the strait and water depth was mea-sured at 15 different stations along the channel and at the northern part of the eastern lobe. The location of the sta-tions are indicated in Fig. 1 where the bathymetric levels bel-low 30.1 m a.s.l. according to the digital bathymetry are pre-sented. As observed, at the nine most westerly stations, the channel is not present in the available bathymetry. Details of the campaign have been given by Zavialov et al. (2008a) although depths along the channel were not reported.
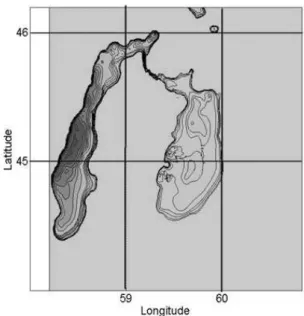
Fig. 2.High resolution Landsat images of:(A)the Large Aral Sea on the 24 November 2006 and(B)the channel connecting the two lobes on the 7 October 2008.
Fig. 3. Differences between expected (according to the available bathymetry) and measured depth at the stations indicated in Fig. 1 (from west to east).
GIMP, a free image manipulation program under GNU li-cense. Figure 2a presents the satellite image of the day we used for channel reconstruction – 24 November 2006. The image has a size of 1100×1000 pixels and encompasses the area between the 59th and 60th meridians and the 45th and 46th parallels. The number of pixels within one degree of longitude is 337, and the number of pixels within one degree of latitude is 500. Accordingly the resolution in degrees and meters along a meridian is of 0.0028◦and 225.1 m, and along a parallel of 0.0020◦and 222.3 m. In Fig. 2b, a very recent image of the channel (7 October 2008) is also presented.
3 Results
Table 1 presents the observed depths recorded during the campaign at 15 stations, which are identified by their coor-dinates. As previously mentioned and also shown in Fig. 1, the last six stations are not located in the channel but in the
Table 1.In-situ measured depths (column 4) at 15 different stations (column 1) placed at the coordinates indicated in columns 2 and 3. Corresponding indexes (I, J) on the digital model of the lakes for these stations are also indicated in columns 5 and 6.
Longitude Latitude Depth (m) I J
59.1903 45.7833 5.0 149 274 59.1913 45.7612 5.4 149 272 59.1912 45.7572 6.4 149 271 59.1900 45.7430 5.0 149 270 59.2026 45.7196 5.3 151 267 59.2393 45.7021 4.6 156 266 59.2506 45.6864 6.2 158 263 59.2820 45.6653 4.5 162 260 59.3126 45.6479 4.5 167 259 59.3538 45.6470 2.6 173 259 59.4417 45.6302 3.5 186 257 59.5246 45.6165 3.0 199 255 59.5540 45.5780 3.0 203 251 59.6168 45.6086 2.6 212 254 59.7025 45.5997 0.8 225 253
northern part of the eastern lobe. Disregarding these stations, the mean measured depth of the channel was 4.8±1.1 m.
The misfits between the expected depth according to the original bathymetric map and the measured depths for all the stations are shown in Fig. 3. As observed, the differences between the expected and the measured depths are much smaller in the last six stations which are already located in the eastern lobe. More precisely, the mean mismatches at the channel stations were found to be 7.5±0.9 m, and at sta-tions located in the northern part of the eastern lobe they were 1.6±0.3 m.
Taking another look at Table 1, the indices (I, J) of the bathymetric matrix corresponding to the stations are also shown. The column’s indexes, J, and the line’s in-dexes, I, were obtained as J = round [(longitude of the sta-tion−58.194)/0.0067] and I = round [(latitude of the station
−43.396)/0.0087], where round stands for the closest natural number. Values (58.194◦E, 43.396◦N) are the coordinates of the node (1,1) of the bathymetric matrix and 0.0067 and 0.0087 correspond to the resolution along the meridian and the parallel, as mentioned before.
A similar procedure was used to locate the border of the channel in the digital bathymetry based on the satellite im-age. Contour pixels were easy to visually identify in the satellite image because of the contrast and resolution (higher than that of the bathymetry). Finally, as was done with the field stations, the closest coordinates (I, J) in the digital bathymetry were identified.
Fig. 4. Details of the reconstructed bathymetry at the extremes of the channel: (A)depth matrix at the western side and(B)contour levels (1=0.5 m) at the eastern side.
reconstructed. Considering the shape and width of the chan-nel – between∼1 and∼3 km – and the resolution of the dig-ital bathymetry, only a few points around each station had to be interpolated to reconstruct the channel. Because of this, a linear approximation was used, and the depth at the cells which where indentified as the channel limits were fixed at 0.5 m. The interpolation was first done along the horizontal direction and then along the vertical. This simple procedure gave reasonable results with the exception of three critical points at the western end of the channel which were modi-fied manually (as discussed below). The sparse data make it unreasonable to use more sophisticated interpolation meth-ods (Dunn and Ridgway, 2002).
Figure 4a presents the detailed matrix of the bathymetry at the western end of the channel. More precisely, the ma-trix refers to the cells contained in the rectangular region whose opposite vertex indices are (267, 145) and (274, 153). Zeros stand for cells with no water, the shadowed cells with depths of 0.5 m correspond to the channel borders, and the underlined values correspond to the field measurements. The
Fig. 5.New bathymetry of the Aral Sea where the channel connect-ing the two lobes was reconstructed.
values for the remaining cells were obtained by linear inter-polation with the exception of the bold values at cells (149, 269), (150, 269) and (150, 268) which were fixed manually at 5 m depth to avoid a big reduction in the transversal section of the channel in those regions that appear to be artificially generated due to a lack of data. Manual adjustments were not required along the channel.
The bathymetric matrix in the northern region of the eastern lobe was also modified to have a more realistic bathymetry for hydrodynamic studies. This was automati-cally done considering the cells where depths in the original bathymetry were smaller then 2 m; in these cells, the depths were modified by a factor of 1.5, allowing a maximum value of 2 m. Details of the resulting morphometry in this area are shown in Fig. 4b. The reconstructed bathymetric matrix is shown in Fig. 5.
This new bathymetry has been implemented in the Prince-ton Ocean Model (POM), a hydrodynamic model based on the hydrostatic 3-D primitive equations with the level 2.5 Mellor and Yamada closure scheme and terrain-following (sigma) coordinates. The model is widely documented (see, for example, http://www.aos.princeton.edu/WWWPUBLIC/ htdocs.pom/). At the surface, the wind stress was calculated asτ=ρaCD|V10|V10, whereτis the wind stress vector,V10 is the wind speed vector at the height of 10 m,ρa is the air density, and CD is the drag coefficient defined by Hassel-mann (1998). Bottom stress is determined considering the logarithmic law of the wall as commented by Blumberg and Mellor (1987).
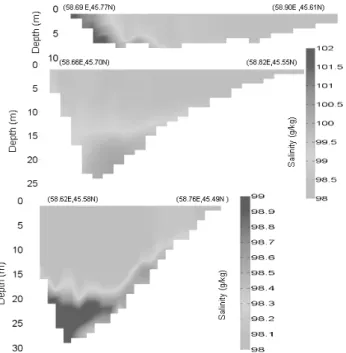
Fig. 6.Salinity at three transversal sections along the western lobe of the Aral obtained after 10 days of simulation using a 3-D hy-drodynamical model (POM). Background conditions were similar to those measured during the campaign, with salinity at the west-ern lobe and in the channel of 98 g/kg and at the eastwest-ern lobe of 132 g/kg. The system was forced with a constant wind from 112◦ of 12 m/s.
a denser intrusion flowing mainly, but not only, along its western shore. The intruded water comes from the eastern lobe after flowing along the channel. For this simulation, the whole system was forced with a constant wind blowing from 112◦ with an intensity of 12 m/s. The easterly winds are quite typical for the region (e.g., Bortnik and Chistyaeva, 1990). In this simulation, the mean velocities along the chan-nel were found to be of about 45 cm/s, so that the denser wa-ter from the easwa-tern lobe (salinity: 132 g/kg) can flow about 38 km towards the fresher western lobe (salinity: 98 g/kg) in one day. The northwestward velocities of 40–50 cm/s appear to be consistent with those directly measured in the channel in October 2005, under the conditions of moderate-to-strong easterly winds (Zavialov et al., 2006). Plots in Fig. 6 were obtained after 10 days of simulation with the constant wind. Figure 7, which is based on the original bathymetric ma-trix, shows the contour levels down to 5.8 m below the sur-face level measured during the 2005 campaign for the area where the channel has been completely and numerically re-constructed. Dots on the plot stand for the measuring stations along the channel. As observed, the present channel follows a neck in the previous bathymetry in this area. This indicates that the original bathymetry did resolve the details of the re-gion well, although, as discussed in the previous section, the measured depths were about 7.5 m deeper. This difference is
Fig. 7. Bathymetric levels down to 5.8 m below the surface level measured during the 2005 according to the available digital model of the sea at the area where the channel connecting the two lobes is located. Dots show the stations along the channel which were visited during the campaign.
significantly greater than the depth mismatch of about 1.5 m observed at the northern part of the eastern lobe, which could be thought of more easily as a precision error of the original bathymetry. Note that such uncertainty could also explain the differences on the shoreline observed at the southern part of the eastern lobe if Figs. 2 and 3 are compared. In this re-gion, the bottom slope is very small so that a small variation in the water surface level corresponds to a large shift of the shoreline.
4 Discussion and conclusions
erosion in the main channel of the estuary produced by the velocity increase.
In our case, as discussed above, the mismatch between the depth of the underwater channel contained in the orig-inal bathymetry and the currently measured depth is quite large. It is difficult to believe that this is due to a lack of res-olution of the original bathymetry or to extrapolation errors. Furthermore, the differences in the misfits observed for the two zones (the channel and the northern part of the eastern lobe) are significant enough (7.5 and 1.5 m, respectively) to consider different causes for them. Note also that eastern-most point, where the channel had to be completely recon-structed (see Figs. 1 and 2), coincides with a region where the width of the channel varies considerably. This variation of the transversal area of the channel as it enters into the east-ern lobe would affect the flow velocity and also the strength of the erosion process, which could explain the differences in the mismatch between expected and measured depths, as was the case in the systems referred to in the previous paragraph. The exchanges between the two lobes, which have al-ready been discussed based on field measurements (Zavialov, 2005), have now been reproduced numerically by incor-porating an updated bathymetry of the lake into a three-dimensional hydrodynamical model. The system – with a difference of salinity between the two lobes of 34 g/kg – was forced with a constant easterly wind (112◦) of 12 m/s and velocities of about 45 cm/s were generated in the channel. Zavialov (2005) and Cr´etaux et al. (2009) present different scenarios when the different surface level of both basins can force the release of water from the eastern to the western basin. All in all, the exchange flow between the two lobes depends on baroclinic instabilities and on barotropic forcing, including the possibility of resonant effects if the stationary modes of the internal waves at the different lobes are consid-ered (Roget and Casamitjana, 1990; Roget et al., 2008).
Finally, a close view to Fig. 2b allows channel bed changes – which in the case of rivers have been reported to be of im-portance in short periods (Winterbottom, 2000) – to also be discussed This fact should be significant for the water ex-change between the two lobes as it depends on the relative direction of different sections of the channel and the relevant winds.
All these considerations lead to the conclusion that the erosion in the channel connecting the two lobes has been an important process during the present shrinking period of the Aral Sea. It is indeed possible that erosion has been act-ing upon a historical bed from previous regressions, which was later buried by sediment. Tectonics of the region might also have played a role in the formation and localization of the channel. According to some geological data, there is a system of tectonic faults passing through Chernyshev Bay and the former Tschebas Bay and oriented from northwest to southeast, not far from the location of the channel (Rubanov et al., 1987; Fig. 11 in page 31). Oberh¨ansli et al. (2007) have shown that during Bronze Age shifts in the water courses
may have been due to tectonic dynamics in the lower Amu Darya river valley.
Survival of the channel has allowed exchange fluxes be-tween the two lobes influencing the stratification of the lake. Considering regional climate feedback between the land, the atmosphere, and large inland water bodies, this study il-lustrates that the morphological evolution of the landform should be incorporated into the models to allow for realis-tic forecasts. In fact, there are models which already account for sedimentary process affecting the bathymetry of large in-land water systems (e.g., Filina et al., 2008), but the Aral Sea study shows that underwater erosion should also be con-sidered. Accordingly, the Aral Sea example shows that for reliable short-term predictions, geomorphological and geo-physical processes must be taken into account along with hy-drological and atmospheric processes.
Acknowledgements. We thank D. Soloviov and S. Stanichniy (Marine Hydrophysical Institute, Ukraine), who kindly provided the satellite images used in this study. We are grateful to Professor Micklin and one anonymous reviewer for the interesting points they have raised in their review and for the opportunity to incorporate them in the text. This paper has been done within the frame of the NATO Collaborative Linkage Grant ESP-NR-NRCLG-982592. The work was also supported by the Russian Foundation for Basic Research and, partially, by the Spanish Ministry of Education and Science, grant FIS2008-03608.
Edited by: A. Gelfan
References
Allen, M. R.: Possible or probable?, Nature, Sept. 18, 425, 6955, p. 242, 2003.
Blumberg, A. F. and Mellor, G. L.: A description of a three-dimensional coastal ocean circulation model, in: Three-Dimensional Coastal Ocean Models edited by: Heaps, N., Amer-ican Geophysical Union, 1–16, 1987.
Bortnik, V. N. and Chistyaeva, S. P.: Hydrometeorology and Hy-drochemistry of the seas of the USSR, The Aral Sea, Leningrad, Gidrometeoizdat, 7, 194 pp., 1990 (in Russian).
Chase, T. N., Pielke, R. A., Knaff, J. A., Kittel, T. G. F., and East-man, J. L.: A comparison of regional trends in 1979–1997 depth-averaged tropospheric temperatures, Int. J. Climatol., 20, 503– 518, 2000.
Cr´etaux, J. F., Kouraev, A. V., Papa, F., Berge-Nguyen, M., Cazenave, A., Aladin, N., and Plotinov, I. S.: Evolution of sea level of the big Aral Sea from satellite altimetry and its impli-cations for water balance, J. Great Lakes Res., 31(4), 520–534, 2005.
Cr´etaux, J. F., L´etolle, R., and Calmant, S.: Investigations on Aral Sea Regressions from mirabilite deposits and remote sensing, Aquat. Geochem., 15, 277–291, 2009.
Filina, I. Y., Blankenship, D. D., Thoma, M., Lukin, V. V., Masolov, V. N., and Sen, M. K.: New 3D bathymetry and sediment distri-bution on Lake Vostok: Implication for pre-glacial origin and numerical modeling of internal processes within the lake, Earth Planet. Sc. Lett., 276, 106–114, 2008.
G¨okas¸an, E., Tur, H., Ecevito˘glu, B., G¨or¨um, T., T¨urker, A., Tok, B., C¸ a˘glak, F., Birkan, H., and S¸ims¸ek, M.: Evidence and impli-cations of massive erosion along the Strait of Istanbul, Geo-Mar. Lett., 25, 324–342, 2005.
G´omez-Gesteira, M., Decastro, M., Prego, R., and Martins, F.: In-fluence of the Barrie de la Maza dock on the circulation pattern of the R´ıa of A Coru˜na (NW-Spain), Sci. Mar., 66(4), 337–346, 2002.
Gorelkin, N. E. and Kudyshkin, T. V.: Modern hydrometeoro-logical condition of Aral Sea. General Assembly of European Geosciences Unions, Vienna, Austria, collected abstracts in CD-ROM, 2006.
Hasselmann, S.: The WAM model – a third generation ocean wave prediction model, J. Phys. Oceanogr., 18, 1775–1810, 1988. Holcombe, T. L., Warren, J. S, Taylor, L. A., Reid, D. F., and
Her-dendorf, C. E.: Lakefloor geomorphology of Western Lake Erie, J. Great Lakes Res., 23(2), 190–201, 1997.
Khan, V. M., Vilfand, R. M., and Zavialov, P. O.: Long-term vari-ability of air temperature in the Aral sea region, J. Marine Syst., 47(1–4), 25–33, 2004.
Khan, V. M. and Holko, L.: Snow cover characteristics in the Aral Sea Basin from different data sources and their relation with river runoff, J. Marine Syst., 76, 254–262, doi:10.1016/j.jmarsys.2008.03.012, 2009.
Medina, C. E., Gomez-Enri, J., Alonso, J. J., and Villares, M. P.: Water level fluctuations derived from ENVISAT Radar Altime-ter (RA-2) and in-situ measurements in a subtropical waAltime-terbody: Lake Izabal (Guatemala), Remote Sens. Environ., 112, 2604– 3617, 2008.
Micklin, P. P.: Desiccation of the Aral Sea: A water management disaster in the Soviet Union, Science, 241, 1170–1176, 1988. Micklin, P. P.: The Aral Sea crisis, in: Dying and Dead Seas, edited
by: Nihoul, J. C. J, Zavialov, P., and Micklin, P. P., Kluwer Aca-demic Publishers, 99–123, 2004.
Oberh¨ansli, H., Boroffka, N., Sorrel, Ph., and Krivonogov, S.: Cli-mate variability during the past 2000 years and past economic and irrigation activities in the Aral Sea basin, Irrig. Drainage Syst., 21, 167–183, 2007.
Ressl, R. and Micklin, P.: Morphological changes in the Aral Sea: satellite imagery and water balance model, in: Dying and Dead Seas, edited by: Nihoul, J. C. J., Zavialov, P., and Micklin, P. P., Kluwer Academic Publishers, 77–89, 2004.
Roget, E. and Casamitjana, X.: Water exchanges between a coastal lagoon and the sea, International Association of Theoretical and Applied Limnology. Proceedings, ISBN 3-510-54034-4, 24, 92– 96 1990.
Roget, E., Mu˜niz, M. A., and Zavialov, P.: Mixing related to internal waves and gyres in the western lobe of the Large Aral Sea, Geo-phys. Res. Abstr., ISBN 1027-7006, EGU2008-A-07371, 2008. Rubanov, I. V., Ishniyazov, D. P., Baskakova, M. A., and
Chistyakov, P. A.: Geology of the Aral Sea, FAN, Tashkent, USSR, 247 pp., 1986 (in Russian).
Small, E. E., Sloan, L. C., and Nychka, D.: Changes in surface air temperature caused by desiccation of the Aral Sea, J. Climate, 14(3), 284–299, 2001.
Winterbottom, S. J.: Medium and short-term channel planform changes on the Rivers Tay and Tummel, Scotland, Geomorphol-ogy, 34, 195–208, 2000.
Zavialov, P. O., Arashkevich, A. G., Grabovskiy, A. B., Dikarev, S. N., Dzhalilov, G., Evdokimov, Yu. V., Kudyshkin, T. V., Kur-baniyazov, A. K., KurKur-baniyazov, S. K., Matchanov, A. G., Ni, A. A., Sapozhnikov, F. V., and Tomashevskaya, I. G.: Quasi-synoptic field survey in the western and eastern basin of the Aral Sea (October 2005), Oceanology, 46(5), 750–754, 2006. Zavialov, P. O., Kostianoy, A. G., Emelianov, S. V., Ni, A. A.,
Ish-niyazov, D., Khan, V. M., Kudyshkin, T. V.: Hydrographic sur-vey in the dying Aral Sea, Geophys. Res. Lett., 30(13), 1659, doi:10.1029.2003GL017427, 2003.
Zavialov, P. O., Ni, A. A., Kudyshkin, T. V., Kurbaniyazov, A. K., and Dikarev, S. N.: Five years of field hydrographic research in the Large Aral Sea (2002–2006), J. Marine Syst., 76(3), 263– 275, 2008a.
Zavialov, P. O., Ni, A. A., Ishniyazov, D. P., Kudyshkin, T. V., Kur-baniyazov, A. K., and Mukhamedzhanova, D.: Ongoing changes in salt composition and dissolved gases in the Aral Sea, Aquat. Geochem., 15(1–2), 263–275, doi:10.1007/s10498-008-9057-9, 2008b.