DOWNWARD LONGWAVE RADIATION ESTIMATES FOR CLEAR-SKY CONDITIONS OVER
NORTHEAST BRAZIL
CARLOS ANTONIO COSTA DOS SANTOS
1, BERNARDO BARBOSA DA SILVA
1, TANTRAVAHI
VENKATA RAMANA RAO
1, PRAKKI SATYAMURTY
2, ANTONIO OCIMAR MANZI
31
Universidade Federal de Campina Grande, Unidade Acadêmica de Ciências Atmosféricas (UFCG/UACA),
Campina Grande, PB, Brasil,
2
Universidade do Estado do Amazona (CESTU), Manaus, AM, Brasil,
3Instituto Nacional de Pesquisas da Amazônia (INPA), Manaus, AM, Brasil
[email protected], [email protected], [email protected], saty.prakki@gmail.
com, [email protected]
Received May 2010 – Acepted December 2010
ABSTRACT
The main objective of this paper is to assess the performance of nine downward longwave radiation equations for clear-sky condition and develop a locally adjusted equation using the observed vapor pressure and air temperature data. The radiation and atmospheric parameters were measured during the months of October 2005 to June 2006 at a micrometeorological tower installed at the experimental site in a banana orchard in the semiarid region of Northeast Brazil. The comparative statistics for the performance of the downward longwave radiation calculation models during daytime and nighttime compared to measured data have shown that the parameterizations with more physical foundations have the best results. The locally adjusted equation and Sugita and Brutsaert model developed in 1993 showed errors less than 1.0% in comparison with measured values. Downward longwave radiation is one of the most expensive and dificult component of the radiation budget to be monitored in micrometeorological studies. Hence, the locally adjusted equation can be used to estimate downward longwave energy, needed as input to some agricultural and hydrological models, in semi-arid regions of the Northeast Brazil, where this component is not monitored.
Keywords: Radiation balance, banana crop, semiarid, evapotranspiration
RESUMO: ESTIMATIVAS DA RADIAÇÃO DE ONDA LONGA INCIDENTE PARA CONDIÇÕES
DE CÉU CLARO NO NORDESTE DO BRASIL: O principal objetivo desse artigo é avaliar o desempenho de nove equações, para obter radiação de onda longa incidente para condições de céu claro e desenvolver uma equação localmente ajustada utilizando dados observados de pressão de vapor e temperatura do ar. Os parâmetros atmosféricos e de radiação foram medidos durante os meses de outubro/2005 e junho/2006, em uma torre micrometeorológica instalada no sítio experimental, em um pomar de bananeiras na região semi-árida do Nordeste do Brasil. A estatística comparativa para o desempenho dos modelos, para o cálculo da radiação de onda longa durante os períodos diurnos e noturnos, comparados aos dados medidos, tem mostrado que as parametrizações com mais fundamentações físicas têm melhores resultados. A equação ajustada localmente e o modelo de Sugita e Brutsaert, desenvolvido em 1993, mostraram erros menores que 1.0%, em comparação com os valores medidos. A radiação de onda longa incidente é um dos componentes do balanço de radiação mais caro e difícil de ser monitorado em estudos micrometeorológicos. Logo, a equação localmente ajustada pode ser usada para estimar a energia de onda longa incidente, necessária como dado de entrada em alguns modelos agrícolas e hidrológicos, nas regiões semi-áridas do Nordeste do Brasil, onde esta componente não é monitorada.
1. INTRODUCTION
Solar radiation (
ˆ
S d) is absorbed and relected by the
Earth´s surface and atmosphere (including clouds), and part of the absorbed shortwave radiation can be emitted back as longwave radiation, additionally, the emitted longwave radiation can as well be reflected and absorbed by Earth´s surface and atmosphere (Oke, 1996). Many biological and physical processes are controlled by the amounts of solar energy received, relected and emitted by the Earth and the atmosphere.
A measure of the quantity of energy available for processes such as evapotranspiration is often needed to be determined in agricultural, biological and engineering sciences, and in many other studies, such as climate modeling and forecasting, water resources planning and plant growth modeling (Sridhar and Elliott, 2002; Kjaersgaard et al., 2007). The methods for calculating the energy available at an evaporating surface are, in general, derived from the energy balance and for which the net radiation has to be known. Net radiation is sometimes measured. The accuracy of the net radiation term obtained from the radiation balance depends on the quality of the measurements or estimations of other terms used as input (Kjaersgaard et al., 2007).
Considerable efforts have been made to develop simplified methods to calculate atmospheric radiation. In spite of recent advances in measurement technology, there is considerable interest in determining the downward longwave radiation (Ld), which is emitted by the atmosphere and clouds,
from the available meteorological measurements such as air temperature and vapor pressure near the ground surface (Sugita and Brutsaert, 1993). The studies of surface energy balance are often complicated due to the various uncertainties in the estimation of downward longwave radiation at the surface (Crawford and Duchon, 1999). Accurate estimates of surface radiation balance, which modulates the magnitude of the surface energy balance components (including the latent heat lux), depend on good estimates of downward longwave radiation.
Instrument that measures directly the downward longwave radiation is the pyrgeometer, which is expensive and sensitive in comparison with the pyranometer which is used to measure the incoming shortwave radiation (Duarte et al., 2006). Downward longwave radiation (Ld) is the surface
radiation balance component rarely available at meteorological stations (Kruk et al., 2010). Thus, in recent decades many techniques have been developed to estimate Ld where there are no pyrgeometers, based only on surface observations. These methods have presented varied accuracy, and new techniques continue to be developed on a regional scale (Crawford and Duchon, 1999; Kruk et al., 2010).
Based on a perceived similarity between heat conduction and radiative transfer, Brunt (1932) irst theorized that Ld
was related to the square root of surface vapor pressure (ea) and developed the irst empirical relationship between these quantities, resulting in a correlation coeficient of 0.97 between observations and estimates. Swinbank (1963) concluded that Ld
was not related to ea at all, but to the square of the temperature (T), resulting in a correlation coeficient of 0.99. The equation developed by Idso and Jackson (1969), also dependent on T2,
produced a correlation coeficient of 0.99 between measured and estimated Ld. However, Brutsaert (1975) was the irst to develop a more physical parameterization of atmospheric emissivity (εa), based on the equation of Schwarzschild (Liou, 1980) and assumptions of standard atmospheric lapse rates of T and ea.
In Brazil, some studies have been made to analyze those proposed equations and to adjust the equations for clear-sky conditions with observed data. For example, Duarte et al. (2006) assessed the performance of Ldequations at an experimental
site near the city of Ponta Grossa in Paraná State, Southern Brazil. Kruk et al. (2010) adjusted the equations for Ldusing
data observed in Sertãozinho, São Paulo State, Southeast Brazil. However, no study has been developed to assess the equations and to calibrate locally the parameters for the models in the Northeast Brazil. Thus, the objective of this study is to assess the performance of downward longwave radiation equations for clear-sky conditions and to develop an equation using the observed data at an experimental site in a banana orchard for the semiarid region of Northeast Brazil.
2. MATERIALS AND METHODS
The radiation parameters and atmospheric parameters were measured at every 10 min at the micrometeorological tower installed at the Frutacor farm (5º08’44”S; 38º05’53”W; altitude 147 m), within an approximate area of 250 ha of banana crop (Musa sp.), during the months of October 2005 to June 2006. This farm is located within the irrigation district of Quixeré, in the Lower Jaguaribe basin, in Ceará state, Northeast Brazil. The area has a semiarid climate, type BSw’h’, according to the Köeppen classiication. The mean air temperature is 28.5 ºC, with maximum and minimum values of 36 ºC and 22 ºC, respectively, and mean relative humidity of 62%. The mean total annual precipitation is 772 mm.
The radiation balance equation at the surface is given by
where
S
ˆ
d is the incident solar radiation flux, Sref is therelected solar radiation lux which is related to albedo, Ld
is the atmospheric longwave radiation flux or downward longwave radiation and Lsurface is the surface longwave radiation lux which is related to the Earth’s surface temperature and
ˆ
n d ref d surface
R =S −S +L L−
4
T
Ld =
ε
aσ
(2) albedo as well (Tanaka et al., 2008). Thenet radiation (Rn) was computed using a four component net radiometer (model CNR1, Kipp & Zonnen, Delf, The Netherlands), placed at an elevation of 7.0 m above the ground level and 2.0 m above a row of plants. Downward longwave radiation was measured with a CG3 pyrgeometer contained in the CNR1 instrument. Microclimatic data of air temperature and relative humidity were measured using a Vaisala HMP45C probe. All sensors signals have been sampled at 1 minute intervals and averaged at 10 min intervals and were recorded using a Campbell Scientiic CR23X datalloger, where the data were stored for processing later. This study was developed with a new net radiation sensor and used calibration constants provided by the manufacturer. The experimental station was continuously powered by four batteries and four solar panels.
The equation for the clear-sky Ld has the general form:
where T is the air temperature near-surface, εa is the emissivity
of the clear-sky atmosphere and σ = 5.67051 x 10⁻⁸ W m-2 K-4 is the Stefan-Boltzmann constant. According to Duarte et al. (2006) and Kruk et al. (2010) Equation (2) is inspired by Stefan-Boltzmann’s law for the radiation emitted by a grey body at
d d S S c=1− ˆ
(3) uniform temperature. All the equations analyzed in this study make the assumption that εa is a function of temperature and/
or vapor pressure near the ground.
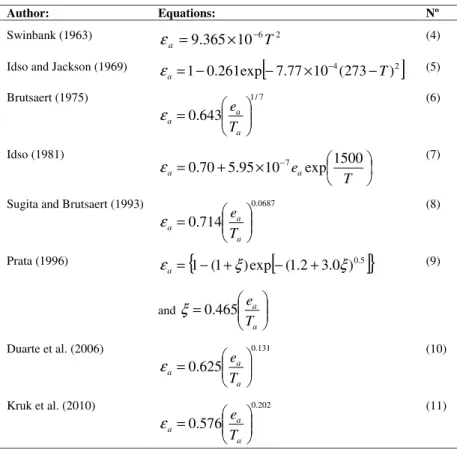
Several authors have proposed models for calculating
εa. Six popular εa formulations and those developed by Duarte et al. (2006) and Kruk et al. (2010) inserted into Equation (2) were tested against Ld data collected on the experimental ield. To analyze the consistency of the clear-sky models, proposed by different authors are presented in Table 1. A sample of 12 clear-sky days was selected. These days presented fractional cloud coverage (c), calculated from the Equation 3 (Crawford and Duchon, 1999), less than or equal to 0.05.
where Sdis the observed downward solar (shortwave) radiation at the surface and Sˆdis the theoretical downward clear-sky solar
radiation for the period obtained as in Crawford and Duchon (1999).
Statistical criteria for the evaluation of the models are given in Table 2. For each parameterization, the estimated value of Ld, which is denoted by e, were compared with
the measured values, which is denoted by m. The statistical analysis includes bias (BIAS), root mean square error (RMSE),
Author: Equations: Nº
Swinbank (1963) 6 2
10 365 . 9 T a − × = ε (4)
Idso and Jackson (1969) 1 0.261exp
[
7.77 104(273 T)2]
a = − − × −
−
ε (5)
Brutsaert (1975) 1/7
643 . 0 = a a a T e ε (6) Idso (1981) × + = − T e a a 1500 exp 10 95 . 5 70 . 0 7 ε (7)
Sugita and Brutsaert (1993) 0.0687
714 . 0 = a a a T e ε (8)
Prata (1996) ε =
{
1−(1+ξ)exp[
−(1.2+3.0ξ)0.5]
}
a
and
= a a T e 465 . 0 ξ (9)
Duarte et al. (2006) 0.131
625 . 0 = a a a T e ε (10)
Kruk et al. (2010) 0.202
576 . 0 = a a a T e ε (11)
Table 1 - Emissivity of clear-sky parameterizations based on air temperature, T (K), and water vapor pressure, ea(Pa), suggested by different
mean absolute error (MAE) and percent mean relative error (PMRE).
3. RESULTS AND DISCUSSION
The data needed for testing values of Ld (downward longwave radiation) using Equations 4 – 11 given in Table 1, included near-surface observations of downward shortwave radiation (
S
ˆ
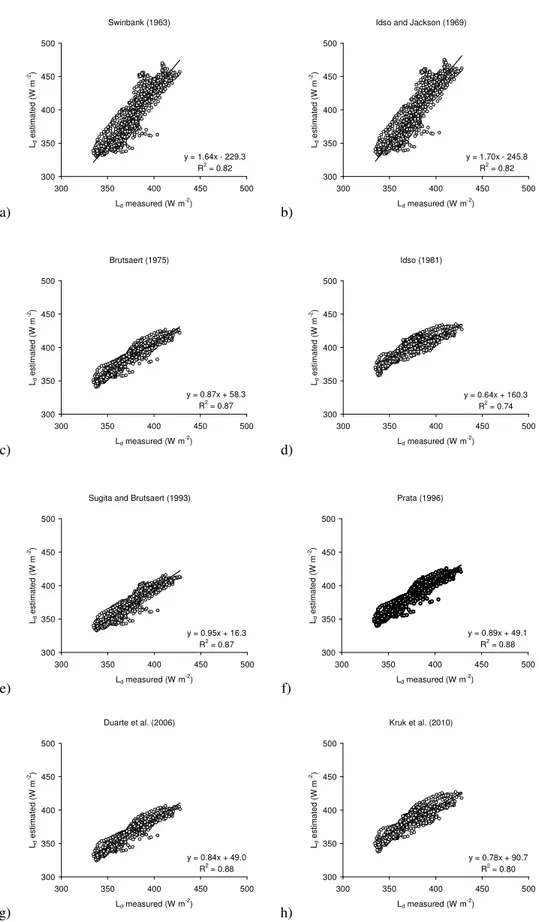
d), vapor pressure and temperature. Initially, an equation (Equation 12) has been adjusted for clear-sky conditions (c < 0.05) using the measured vapor pressure and temperature data from the experimental site in Quixeré, Ceará. The locally calibrated equation is:The least square linear regression obtained between estimated downward longwave radiation luxes and observed radiation luxes in clear-sky days are presented in Figure 1. The Equations 4 and 5, which utilize air temperature only do not employ the vapor pressure as a measure of the humidity effect on atmospheric path length, presented slope values of 1.64 and 1.70, respectively. These results indicate overestimation as showed in Figures 1a-1b. They are in agreement with those presented in Duarte et al. (2006). The other parameterizations (Equations 6 - 11) presented underestimation. The highest slope was obtained with the parameterization proposed by Sugita and Brutsaert (1993) with a = 0.95.
In Figure 2 the comparisons between downward longwave radiation fluxes estimated by Equation 12, i.e. locally calibrated equation, and the observed downward longwave radiation luxes on clear-sky days. The least square linear regression presented slope value of 0.92 indicating underestimation and showing similar results when compared with those presented by Brutsaert (1975), Sugita and Brutsaert (1993) and Prata (1996) models (see Figure 1).
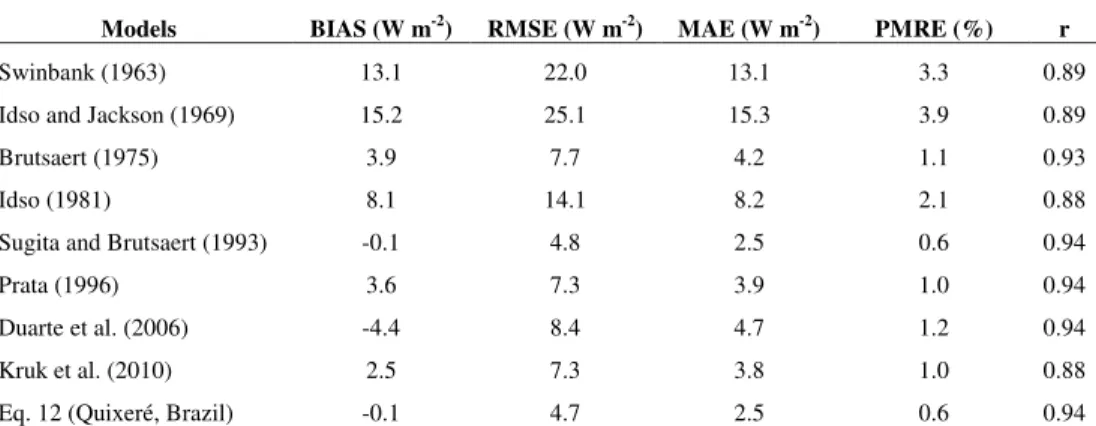
Table 3 shows the comparative statistics for the performance of the nine downward longwave clear-sky calculation models during daytime compared to measured data from the experimental site in Northeast Brazil. A 10 min input dataset was used with a total of 460 observations presenting mean value of 389.3 W m-2. Overall, those parameterizations, which use vapor pressure and air temperature to obtain the atmospheric emissivity, have the best scores during daytime. The best results, which resulted in the smallest BIAS, RMSE, MAE and PMRE were obtained by the Equation 12 followed by the Sugita and Brutsaert (1993) model. The results with the highest BIAS, RMSE, MAE and PMRE were presented by the Idso and Jackson (1969) and Swinbank (1963), respectively. These results presented by Equation 12 are in agreement with those obtained by Duarte et al. (2006) and Kruk et al. (2010). Description Symbol Calculation formula
Bias BIAS
=
− n
i
i
i m
e n
1
) ( 1
Root mean square error RMSE
=
− n
i
i
i m
e n 1
2
) ( 1
Mean absolute error MAE
=
− n
i
i
i m
e n 1
1
Percent mean relative error PMRE
=
− n
i i
i i
m m e n 1
100
Table 2 - Statistical criteria for evaluation of the parameterization performances. The sufixes e, m and n mean estimated, measured and number of observations, respectively.
0881 . 0
6905 .
0
=
T ea a
ε
(4)
Models BIAS (W m-2) RMSE (W m-2) MAE (W m-2) PMRE (%) r
Swinbank (1963) 13.1 22.0 13.1 3.3 0.89
Idso and Jackson (1969) 15.2 25.1 15.3 3.9 0.89
Brutsaert (1975) 3.9 7.7 4.2 1.1 0.93
Idso (1981) 8.1 14.1 8.2 2.1 0.88
Sugita and Brutsaert (1993) -0.1 4.8 2.5 0.6 0.94
Prata (1996) 3.6 7.3 3.9 1.0 0.94
Duarte et al. (2006) -4.4 8.4 4.7 1.2 0.94
Kruk et al. (2010) 2.5 7.3 3.8 1.0 0.88
Eq. 12 (Quixeré, Brazil) -0.1 4.7 2.5 0.6 0.94
Table 3 - Comparative statistics for the performance of the nine downward longwave clear-sky calculation models compared to measured data from
a)
Swinbank (1963)
y = 1.64x - 229.3 R2 = 0.82 300
350 400 450 500
300 350 400 450 500 Ld measured (W m-2
) Ld e s ti ma te d ( W m -2) b)
Idso and Jackson (1969)
y = 1.70x - 245.8 R2 = 0.82 300
350 400 450 500
300 350 400 450 500 Ld measured (W m-2
) Ld e s ti ma te d ( W m -2) c) Brutsaert (1975)
y = 0.87x + 58.3 R2 = 0.87 300 350 400 450 500
300 350 400 450 500
Ld measured (W m -2 ) Ld e s ti ma te d ( W m -2) d) Idso (1981)
y = 0.64x + 160.3 R2 = 0.74 300
350 400 450 500
300 350 400 450 500
Ld measured (W m -2 ) Ld e s ti ma te d ( W m -2) e)
Sugita and Brutsaert (1993)
y = 0.95x + 16.3 R2 = 0.87 300
350 400 450 500
300 350 400 450 500
Ld measured (W m -2 ) Ld e s ti ma te d ( W m -2) f) Prata (1996)
y = 0.89x + 49.1 R2 = 0.88 300
350 400 450 500
300 350 400 450 500
Ld measured (W m -2 ) Ld e s ti m a te d ( W m -2) g)
Duarte et al. (2006)
y = 0.84x + 49.0
R2 = 0.88 300 350 400 450 500
300 350 400 450 500
Ld measured (W m-2)
Ld e s ti ma te d ( W m -2) h)
Kruk et al. (2010)
y = 0.78x + 90.7
R2 = 0.80 300 350 400 450 500
300 350 400 450 500
Ld measured (W m-2)
Ld e s ti ma te d ( W m -2)
Figure 1 - Comparisons between estimated downward longwave radiation luxes and observed downward longwave radiation luxes in clear-sky
Eq. 12 (Quixeré, Brazil)
y = 0.92x + 26.9 R2 = 0.88
300 350 400 450 500
300 350 400 450 500
Ld measured (W m-2) Ld
e
s
ti
m
a
te
d
(
W
m
-2)
Figure 2 - Comparisons between downward longwave radiation luxes
estimated by Equation 12 and the observed downward longwave radiation luxes in clear-sky days.
330 360 390 420
0
0
:1
0
0
2
:0
0
0
3
:5
0
0
5
:4
0
0
7
:3
0
0
9
:2
0
1
1
:1
0
1
3
:0
0
1
4
:5
0
1
6
:4
0
1
8
:3
0
2
0
:2
0
2
2
:1
0
0
0
:0
0
Hour (Local time)
Ld
(
W
m
-2)
Calculated Measured
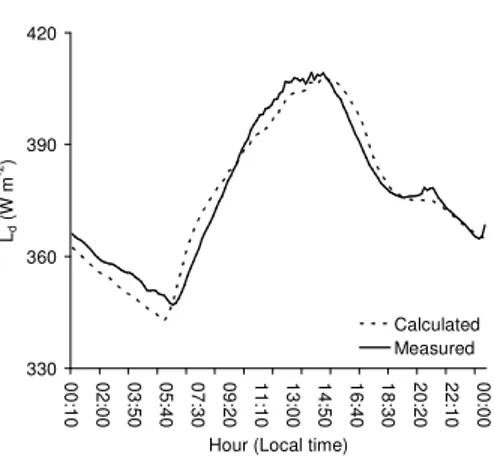
Figure 3 - Mean diurnal cycle of downward longwave radiation lux
for clear-sky days calculated using the Equation 12 and measured in the experimental ield.
Equations proposed by Sugita and Brutsaert (1993), Prata (1996), Duarte et al. (2006) and Equation 12 showed the highest correlation coeficient (r = 0.94), showing the strong correlation between the calculated and measured values of Ld.
All models presented mean relative percentage error less than 4.0% indicating good accuracy of the models. However, the adjusted Equation 12 and Sugita and Brutsaert (1993) model showed errors less than 1.0% in comparison with measured values. These results are better than those found by Duarte et al. (2006), Kjaersgaard et al. (2007) and Kruk et al. (2010).
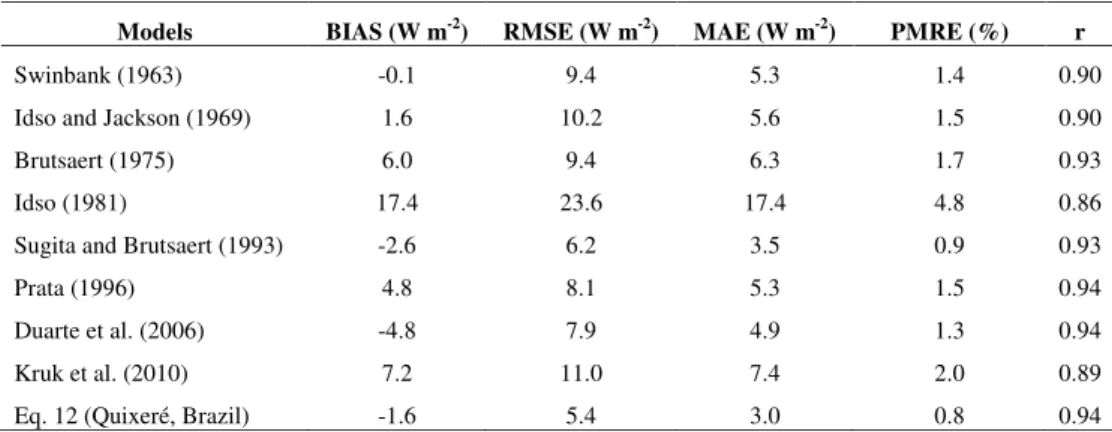
The comparative statistics of the nine downward longwave clear-sky calculation models during nighttime compared to measured data is shown in Table 4. The 10 min input dataset with a total of 596 observations and mean value of 365.2 W m-2 is used for this purpose. During the nighttime, the best results were obtained by the Equation 12, resulting in the smallest RMSE, MAE and PMRE followed by the Sugita and Brutsaert (1993) model. Idso (1981) and Kruk et al. (2010) models showed results with highe BIAS of 17.4 W m-2 and 7.2 W m-2, respectively. The higher r value equal to 0.94 has been presented by the Equation 12, Prata (1996) and Duarte et al. (2006) showing a strong correlation between the calculated and measured values of downward longwave radiation. PMRE values are less than 5.0% showing a good accuracy of the parameterizations and the adjusted Equation 12 and Sugita and Brutsaert (1993) model showed errors less than 1.0% in comparison with those measured. Again, the results have been better than those found by Duarte et al. (2006), Kjaersgaard et al. (2007) and Kruk et al. (2010). Surprisingly, the parameterizations with less physical foundations (Swinbank, 1963 and Idso and Jackson, 1969) had better scores during nighttime in comparison with those presented in the daytime analysis. Stull (1988) afirms that if there is strong convection in the daytime, both lapse rates
above the surface layer should be close to constant through the convective boundary layer (CBL), while in the nighttime under stable conditions this idea might not be valid especially for temperature lapse rate.
Figure 3 shows the mean diurnal cycle of Ld for clear-sky days calculated, using Equations 2 and 12, and field measurements. The behavior of calculated values of
Ld, between midnight and early morning, is smaller than the
measured values. In the early hours after the sunrise the model overestimated the values. However, between 10:00 AM and 15:00 PM the calculated values are underestimated and after that time they are overestimated until the sunset. Meanwhile, it can be observed that the average of Ld calculated for clear-sky days from Equation 12 closely follows the average of observed values (Figure 3), showing a good agreement between them.
The results found in this research will contribute to a better understanding of the surface energy budget in the semi-arid of Northeast Brazil and it can results in improved characterization of evapotranspiration for many applications in agriculture, biology, ecology, climatology and hydrology (Choi et al., 2008). The Ld estimates are vitally important for numerous applications requiring surface radiation and energy balance, including prediction evapotranspiration, surface temperature and frost occurrence (Flerchinger et al., 2009). Solar radiation is fundamental for crop growth, but there are many other factors that inluence plant development. For example, water availability for the plants is one of the most important factors for their development, and under some optimal conditions of water availability, the radiation use remains almost constant throughout most of the plant growth cycle, and shows no variations caused by local atmospheric conditions.
crop growth and development, and as decision support tools to help optimize crop and soil management strategies. Most crop simulation models, however, require daily records of temperature, precipitation, and radiation. Records of daily maximum and minimum temperatures, and precipitation, are available for many sites, but accurate solar radiation measurements are available for only a few sites, a situation which probably reflects not only the cost of the required instrumentation, but also the problems of maintenance and calibration of radiation sensors.
4. CONCLUSIONS
The equations which utilize air temperature only, i.e. Swinbank (1963) and Idso and Jackson (1969), overestimate the atmospheric longwave radiation while other parameterizations present underestimation. The comparative statistics for the performance of the nine downward longwave clear-sky calculation models during daytime and nighttime compared to measured data have shown that the parameterizations with more physical foundations have the best scores. The results obtained by the locally adjusted equation presented the smallest BIAS, RMSE, MAE and PMRE. The adjusted Equation 12 and Sugita and Brutsaert (1993) model showed errors less than 1.0% in comparison with measured values during the daytime and nighttime.
Since downward longwave radiation is one of the most dificult component of the radiation budget to be monitored in micrometeorological studies, it is important to evaluate a locally adjusted equation to estimate it. Hence, the locally adjusted equation (Equation 12) can be used to estimate downward longwave energy, needed as input to some agricultural and hydrological models, in semi-arid regions of the Northeast Brazil, where this component is not monitored.
Models BIAS (W m-2) RMSE (W m-2) MAE (W m-2) PMRE (%) r
Swinbank (1963) -0.1 9.4 5.3 1.4 0.90
Idso and Jackson (1969) 1.6 10.2 5.6 1.5 0.90
Brutsaert (1975) 6.0 9.4 6.3 1.7 0.93
Idso (1981) 17.4 23.6 17.4 4.8 0.86
Sugita and Brutsaert (1993) -2.6 6.2 3.5 0.9 0.93
Prata (1996) 4.8 8.1 5.3 1.5 0.94
Duarte et al. (2006) -4.8 7.9 4.9 1.3 0.94
Kruk et al. (2010) 7.2 11.0 7.4 2.0 0.89
Eq. 12 (Quixeré, Brazil) -1.6 5.4 3.0 0.8 0.94
Table 4 - Comparative statistics for the performance of the nine downward longwave clear-sky calculation models compared to measured data from
the Northeast Brazil site using nighttime measurements (n = 596, observation mean = 365.2 W m-2).
5. ACKNOWLEDGEMENTS
The authors are grateful for the National Council for Scientiic and Technological Development (CNPq) and thank the anonymous reviewers whose suggestions were helpful for improving the quality of this paper.
6. REFERENCES
BRUNT, D. Notes on radiation in the atmosphere. Quarterly Journal of the Royal Meteorological Society. v. 58, p. 389–418, 1932.
CHOI, M., JACOBS, J. M., KUSTAS, W. P. Assessment of clear and cloudy sky parameterizations for daily downwelling longwave radiation over different land surfaces in Florida, USA. Geophysical Research Letters, v. 35, L20402, doi: 10.1029/2008GL035731, 2008
CRAWFORD, T. M., DUCHON, C. E. An improved parameterization for estimating effective atmospheric emissivity for use in calculating daytime downwelling longwave radiation. Journal of Applied Meteorology, v. 38, p. 474–480, 1999
CULF, A. D., GASH, J. H. C. Longwave radiation from clear skies in Niger: a comparison of observations with simple formulas. Journal of Applied Meteorology, v. 32, p. 539–547, 1993
DUARTE, H. F., DIAS, N. L., MAGGIOTTO, S. R. Assessing daytime downward longwave radiation estimates for clear and cloudy skies in Southern Brazil. Agricultural and
Forest Meteorology, v. 139, p. 171–181, 2006
IDSO, S. B. A set of equations for full spectrum and 8 to 14 μm and 10.5 to 12.5 μm thermal radiation from cloudless skies. Water Resources Research, v. 17, p. 295–304, 1981 IDSO, S. B., JACKSON, R. D. Thermal radiation from the
atmosphere. Journal of Geophysical Research, v. 74, p. 5397–5403, 1969.
KJAERSGAARD, J. H., PLAUBORG, F. L., HANSEN, S. Comparison of models for calculating daytime long-wave irradiance using long term data set. Agricultural and Forest Meteorology, v. 143, p. 49 – 63, 2007
KRUK, N. S., VENDRAME, I. F., ROCHA, H. R, CHOU, S. C., CABRAL, O. Downward longwave radiation estimates for clear and all-sky conditions in the Sertãozinho region of São Paulo, Brazil. Theoretical and Applied Climatology, v. 99, v. 115–123, 2010
LIOU, K. N. An Introduction to Atmospheric Radiation. Academic Press, 392 pp., 1980
OKE, T. R. Boundary Layer Climates, 2nd ed.Routledge, 435 pp., 1996
PRATA, A. J. A new long-wave formula for estimating downward clear-sky radiation at the surface. Quarterly Journal of the Royal Meteorological Society, v. 122, p. 1127–1151, 1996
SRIDHAR, V., ELLIOTT, R. L. On the development of a simple downwelling longwave radiation scheme. Agricultural and Forest Meteorology, v. 112, p. 237–243, 2002
STULL , R. B. An Introduction to Boundary Layer
Meteorology, Kluwer Academic Publishers, 666 pp.,1988
SUGITA, M., BRUTSAERT, W. H. Cloud effect in the estimation of instantaneous downward longwave radiation. Water Resources Research, v. 29, p. 599–605, 1993 SWINBANK, W. C. Long-wave radiation from clear skies.